Abstract
Stress preferentially increases the consumption of high-fat foods in women, suggesting the interaction of these two factors may disproportionately predispose women toward excess weight gain. In the present study, female rats were exposed to a chronic high-fat or chow diet and were exposed to 4 weeks of chronic variable stress (CVS) or served as home cage controls. Control females exposed to a high-fat diet displayed many symptoms of the metabolic syndrome including increased body weight gain, total and visceral adiposity and insulin and leptin concentrations relative to all groups. However, CVS-high fat, CVS-chow and control chow groups had similar body weight gain and caloric efficiency. This finding suggests that CVS increases energy expenditure much more in females exposed to a high-fat diet relative to those fed a standard chow diet. The CVS-high fat group had increased adiposity and increased circulating leptin and insulin concentrations, despite the fact that their body weight did not differ from controls. As the effect of stress interacts with high-fat consumption in determining body weight, our results underscore the importance of assessing the degree of adiposity, rather than body weight alone, as an index of overall metabolic health. Overall, the data indicate that in female rats, chronic stress prevents high-fat diet related increases in body weight, but does not prevent high-fat diet induced increases in adiposity when compared to chow-fed females.
Keywords: obesity, leptin, insulin, corticosterone, metabolic syndrome, diabetes
Introduction
Chronic stress-induced dysregulation of the hypothalamic pituitary-adrenal axis is linked with visceral obesity in humans [1, 2], non-human primates [3] and some rodents [4, 5]. Stress-induced potentiation of obesity may be due to increased energy consumption, decreased energy expenditure, or a combination of both of these factors. In women, stress preferentially increases the consumption of palatable, calorically dense foods consisting mainly of a high-sugar and/or high-fat content [6]. Likewise, in non-human primates social stress increases overall caloric consumption of customized diets with varying degrees of fat in subordinate females [7]. These findings suggest that the intake of these “comfort foods” during or after stress may serve as a protective mechanism to help individuals cope with the stressor at hand. Since both chronic stress and increased consumption of high energy diets are associated with obesity, it is important to understand how these two factors interact to regulate energy homeostasis and ultimately metabolic dysfunction.
In male rodents, most stressors decrease body weight when animals are given a standard laboratory chow diet (c.f.., restraint [8], social defeat [9, 10], or chronic variable stress [11, 12]). However, there are some instances in which social defeat or foot shock increases body weight and adiposity in chow-fed males [4, 5]. The stress-induced effects on energy homeostasis in many of these studies appear to be due to a combination of both alterations in food intake and energy expenditure. Stress exposure not only modulates food intake and body weight but also modulates factors associated with overall metabolic function including adiposity, glucose, leptin and insulin [5, 12, 13]. The deleterious consequences of chronic stress on metabolic function are attributable to increases in circulating stress hormones (glucocorticoids). Chronic elevated glucocorticoids are associated with increased visceral adiposity, which can occur independently of body weight changes (as reviewed in [14]). Increased visceral adiposity (more so than overall adiposity) is strongly linked with pathological states including cardiovascular disease and Type II diabetes. Together these data suggest that stress exerts potent effects on the metabolic milieu.
In addition to chronic stress, long-term exposure to high-fat diet induces symptoms of metabolic disturbance as indicated by increases in body weight and adiposity in rodents [15]. Accordingly, chronic exposure to an obesegenic diet induces symptoms of the metabolic syndrome, characterized by hyperinsulinemia, hyperleptinemia and glucose intolerance [15–17]. Females are known to have increased stress responsiveness and are more susceptible to stress-related disorders relative to males [18], suggesting that the interaction between stress exposure and high-fat consumption may have a profound metabolic impact. Therefore, we investigated the interaction of chronic stress and high fat diet on energy homeostasis in female rats. Here, we utilized a chronic variable stress (CVS) regime which induces physiological changes that are associated with chronic HPA axis activation including increased basal glucocorticoids (i.e., corticosterone), adrenal hypertrophy, thymic involution and increased hypothalamic corticotrophin-releasing hormone expression [11, 19]. If chronic stress is associated with obesity and increased consumption of calorically dense foods, then female rats that are exposed to both chronic stress and chronic high fat diet may be predisposed to develop indices of the metabolic syndrome.
Materials and Methods
Animals
Adult female Long Evans rats (Harlan, Indianapolis, IN), weighing approximately 250g upon arrival, were individually housed and maintained on a 12-h light, 12-h dark cycle (lights on at 0600 h). All rats had ad libitum access to food and water. All procedures were approved by the University of Cincinnati IACUC. Food intake and bodyweight were monitored at least once a week throughout the study.
Diet
Rats were fed either high-fat diet (HFD: 40% fat by calories at a density of 4.54 kcal/g; Research Diets, New Brunswick, New Jersey) or Purina rodent chow (~5% calories by fat; 3.4 kcal/g).
Chronic Variable Stress Paradigm
Rats were exposed to 4 weeks of chronic variable stress (CVS) consisting of consecutive twice daily stressors presented in an unpredictable order. The AM and PM stressors occurred during the light phase of the cycle (i.e., before lights off at 6pm). The stressors included: 20 min hypoxia (8% oxygen, 92% nitrogen), 20 min warm swim (26–30 C), 10 min cold swim (17–18 C), 1 h in cold room (4 C), 5 min novel environment 1 h on rotating platform (90 rpm) or 30 min restraint stress. On the morning following CVS exposure (0800 h) all females were sacrificed, trunk blood was collected and fat pads (inguinal, parametrial, mesenteric and retroperitoneal), thymus and adrenal glands extracted, cleaned and weighed.
Experimental Groups
High-fat fed females were given three pellets of the diet for one week prior to CVS initiation to allow the animals to acclimate to the diet and to avoid an association between CVS presentation and high-fat diet. During acclimation, all females ate the three pellets of high-fat diet so there was no overall difference in caloric consumption between the high-fat fed groups prior to CVS initiation. At CVS onset, females were switched to an all high-fat diet or all chow diet. Food intake and body weight were monitored weekly and old food was replaced weekly for all groups. The number of animals per group was as follows: control-chow (n=10), control high-fat (n=10), CVS-chow (n=10) and CVS-high-fat (n=10).
Plasma Hormonal Analyses (Corticosterone, Leptin and Insulin)
Females were fasted for 4 hr prior to sacrifice. Blood samples were centrifuged (3000 × g15 min, 4 C) and plasma was stored at –20°C until analysis. Plasma corticosterone levels were measured by RIA using 125I RIA kits from MP Biomedicals (Orangeburg, NY, USA). Leptin and insulin were measured by Luminex multiplex bead assay (LINCOplex); all plasma samples were run in duplicate and analyzed within the same assay.
Glucose Analyses
Plasma glucose was measured by ELISA using a Labsystems Multiscan Plus plate reader (Fisher Scientific, Pittsburgh, PA).
Statistical Analyses
Organ, fat pad, caloric efficiency and hormonal data were analyzed by two-way analysis of variance (ANOVA) with CVS and Diet as between-subjects factors. Food intake and bodyweight were analyzed by three-way ANOVA with CVS and Diet as between-subjects factors and time as the within-subjects factor. When necessary, data that were not normally distributed, or failed the Levene’s test of homogeneity of variance were log transformed. Outliers were defined by standardized scores greater than 1.96 and when necessary, data were reanalyzed following outlier removal. Individual group differences were determined by using Fisher’s LSD test. Statistical significance was denoted as p ≤ 0.05.
Exclusion of animals from analyses
One animal from the CVS chow group was eliminated from the caloric intake analyses for weeks 1 and 5 due to excessive shredding of food, making it difficult to collect an accurate food intake measure at these time points. However, this animal was not excluded from the other weeks. As a consequence, this same animal was eliminated from the caloric efficiency analyses because this measure depends upon total calories consumed. Five animals (CVS chow (n=2), control chow (n=2) and control high fat (n=1)) were excluded from the insulin and leptin analyses due to an insufficient amount of plasma. One animal from the control high fat group was eliminated from the body fat and fat pad analyses because the degree of adiposity was significantly different than the other animals in the group and thus was deemed an outlier.
Results
Effects of CVS and diet on bodyweight
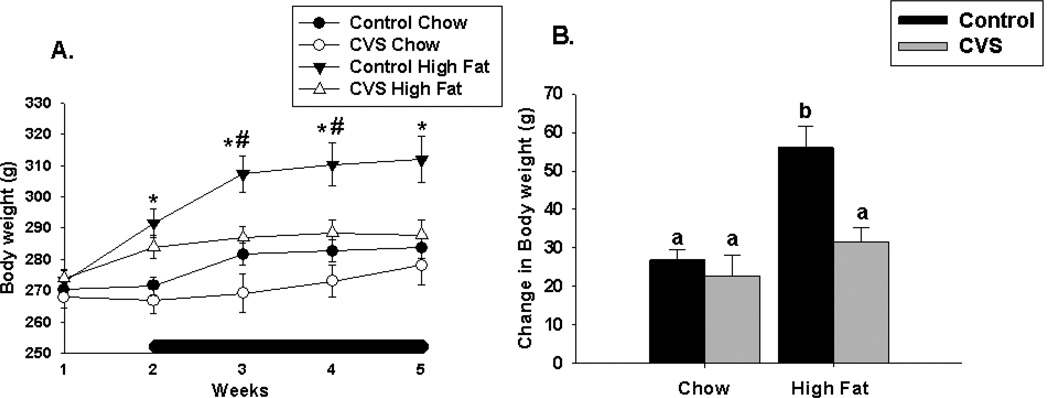
CVS exposure (F(1,36)=6.74, p<0.01), diet (F(1,36)=16.80, p<0.01) and time (F(4,144)=85.56,p<0.01) significantly modulated body weight. There were significant CVS × time (F(4,144)=16.38,p<0.01), diet × time (F(4,144)=17.43,p<0.01) and CVS × diet × time interactions (F(4,144)=5.86, p<0.01). At weeks 1 and 5, females exposed to a chronic high fat diet had significantly increased body weight compared with those on a chronic chow diet. In weeks 2 and 3, both CVS and high fat diet influenced body weight with CVS females having significantly lower body weight relative to their control counterparts and females that were on a high fat diet, regardless of CVS having significantly higher body weight compared to their chow counterparts (Figure 1A).
Figure 1.
Effects of CVS and diet on body weight gain in female rats. (A) Females fed a chronic high fat diet had increased body weight regardless of CVS exposure relative to their chow fed counterparts at weeks 2–5. CVS, regardless of diet, significantly decreased body weight at weeks 2 and 3 relative to the control group. (B) Overall, control high fat fed females gained significantly more weight relative to all other groups. There was no significant difference in overall bodyweight gain among the remaining groups. Black bar indicates stress period. Values represent mean ± SEM, n= 9–10 per group. *, # indicates significant effect of high fat diet and CVS, respectively. Non-shared letters denote statistical significance. Statistical significance is ascribed at p ≤0.05.
Body weight gain was impacted by both CVS exposure (F(1,36)=26.06, p<0.01) and diet (F(1,36)=27.12, p<0.01). There was a significant CVS × diet interaction (F(1,36)=6.12, p<0.01), with control high fat fed animals gaining significantly more body weight relative to all other groups. Body weight gain was similar among the other groups (Figure 1B).
Effects of CVS and diet on caloric intake (update this section)
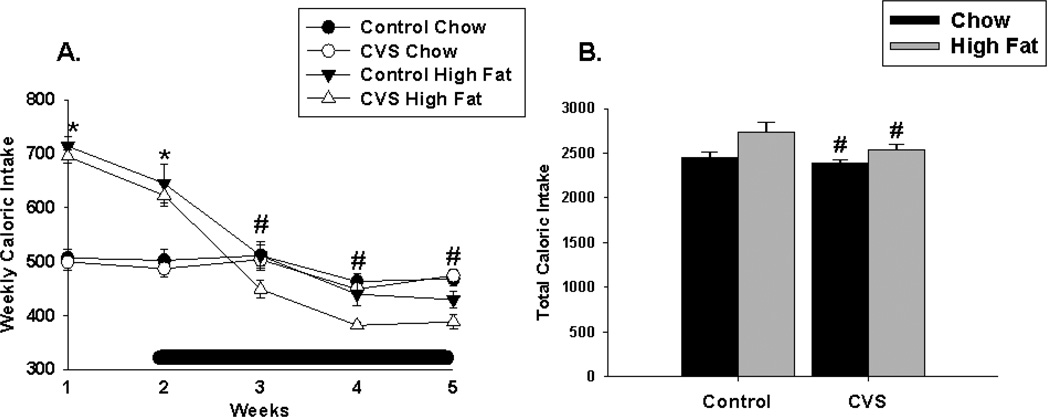
Analysis of caloric intake over time revealed a significant main effect of diet (F(1,36)=9.76, p<0.01), time (F(4,142)=88.94, p<0.01) and a significant diet × time interaction (F(4,142)=68.78, p<0.01). During the first two weeks, females fed a chronic high fat diet consumed significantly more calories relative to their chow fed counterparts. However, during weeks 4 and 5 the high-fat fed females significantly decreased their caloric intake relative to the chow group, which was mainly due to the decreased caloric consumption in the CVS-HF group. (Figure 2A). Overall caloric intake was decreased in the CVS group, (F(1,35)=4.40, p <0.05) regardless of diet. There was no significant effect of diet or significant CVS × diet interaction on total caloric intake (Figure 2B).
Figure 2.
Effects of CVS and diet on caloric intake in female rats. (A) High-fat fed females consumed significantly more calories during the first week relative to their chow-fed counterparts at weeks 1 and 2. However, by weeks 4 and 5, females exposed to chronic high fat diet consumed significantly fewer calories relative to females exposed to chow. (B) Overall, CVS significantly decreased total caloric intake. Black bar indicates stress period. Values represent mean ± SEM, n= 9–10 per group. *, # indicates significant main effect of high fat diet and CVS, respectively. Statistical significance is ascribed at p ≤0. 05.
Effects of CVS and diet on caloric efficiency
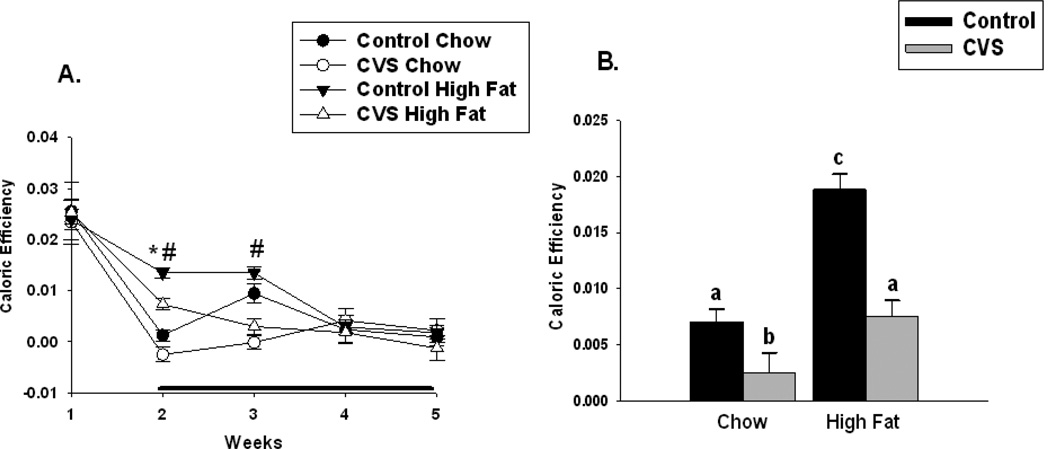
Caloric efficiency was used as an indirect measure of energy expenditure as previously reported in [4–5]. Caloric efficiency was calculated by taking the total amount of body weight gained divided by the total amount of calories consumed. There was a significant main effect of stress (F(1,35)=14.96, p <0.01) and diet (F(1,35)=9.29, p <0.05) and a significant main effect of time (F(4,142)=66.59, p <0.01) and diet by time interaction (F(4,142)=4.82, p<0.01) on weekly caloric efficiency. During week 2 the high fat fed animals had greater caloric efficiency while the opposite was true of the CVS group. At week 3, the CVS group regardless of diet had decreased caloric efficiency. There were no other significant differences in caloric efficiency among the other groups at the other time points. There was also significant main effect of CVS (F(1,35)=32.25, p<0.01) and diet (F(1,35)=30.91, p<0.01) on overall caloric efficiency, and a significant CVS × diet (F(1,35)=7.04, p<0.01) interaction. Overall, CVS decreased caloric efficiency, while consumption of a chronic high fat diet had the opposite effect. Controls fed a chronic high fat diet had significantly increased caloric efficiency relative to all other groups. Chow fed females exposed to CVS had significantly decreased caloric efficiency relative to their control chow-fed counterparts. There was no significant difference in caloric efficiency between CVS high-fat fed females relative to the control chow females (Figure 3B).
Figure 3.
Effects of CVS and diet on weekly and overall caloric efficiency in female rats. Caloric efficiency was calculated by dividing the total body weight gained by the total calories consumed. (A) At week 2, high fat fed females had greater caloric efficiency compared with chow-fed females, while CVS females at weeks 2 and 3 were less calorically efficient compared with control females. (B) Control high-fat fed females had increased overall caloric efficiency relative to all other groups. CVS chow-fed females had decreased caloric efficiency relative to the control chow-fed females. There was no difference in caloric efficiency between the CVS high-fat fed females and the control chow females. Black bar indicates stress period. Values represent mean ± SEM, n= 9–10 per group. *, # indicates significant main effect of high fat diet and CVS, respectively. Non-shared letters denote statistical significance. Statistical significance is ascribed at p ≤0. 05.
Effects of CVS and diet on adiposity
Total body fat
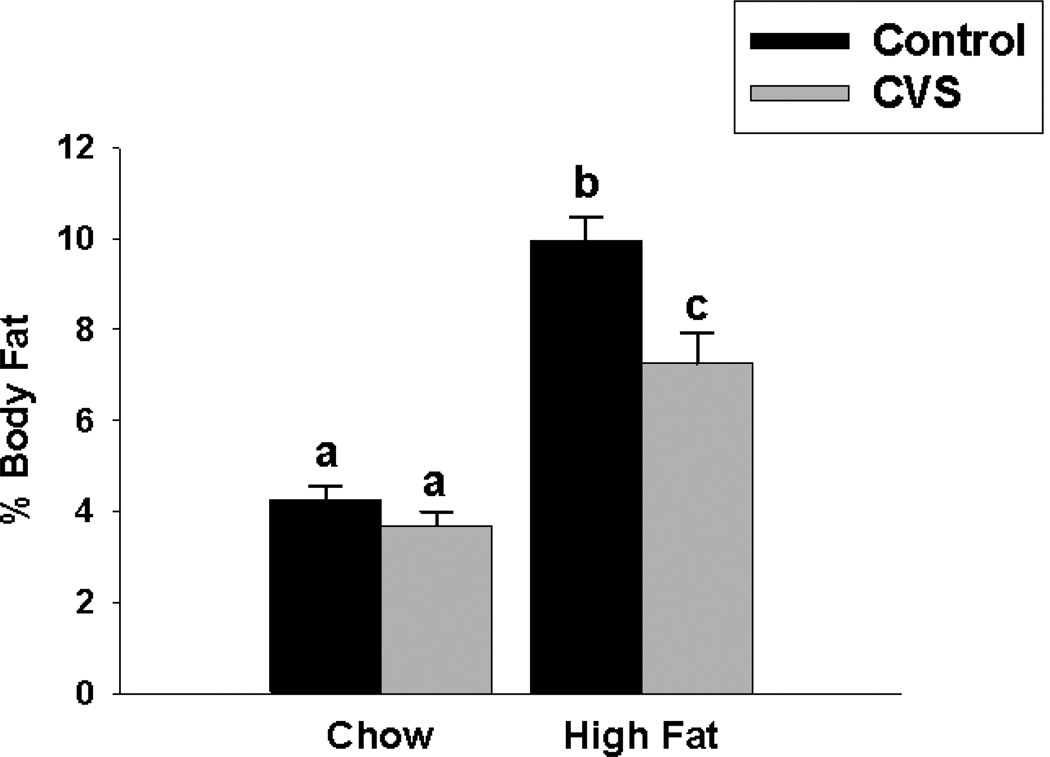
CVS decreased total (F(1,35)=12.60, p<0.01) and relative body fat (F(1,35)=11.05, p< 0.01). Diet increased the amount of total (F(1,35)=75.23, p<0.01) and relative (F(1,35)=89.47, p<0.01) body fat as well, with high-fat fed females having significantly greater adiposity relative to the chow fed females. The data also revealed significant CVS × diet interactions on total (F(1,35)=6.04, p<0.01) and relative (F(1,35)=4.64, p<0.05) body fat. Control females fed a high fat diet had significantly more body fat relative to all other groups. CVS females fed a high fat diet had significantly more body fat relative to both chow groups. There was no significant difference in overall body fat between the chow-fed groups. Actual body fat and relative body fat are represented in Table 1 and (Figure 4), respectively.
Table 1.
Effects of CVS and diet on terminal measures and circulating hormonal concentrations.
| Control | CVS | |||
|---|---|---|---|---|
| Chow | High Fat | Chow | High Fat | |
| Thymus (mg) # | 333.72±13.63 | 351.57±16.07 | 286.96±16.05 | 296.17±17.92 |
| Thymus (mg) % bw # | 117.88±5.42 | 113.34±6.08 | 103.46±5.90 | 104.42±5.96 |
| Adrenals (mg) | 35.73±3.04 | 34.70±2.68 | 36.37±2.38 | 33.82±1.77 |
| Adrenals (mg) % bw | 12.60±1.06 | 11.39±0.94 | 11.82±1.54 | 11.76±0.65 |
| Total Adiposity (g) *# | 12.10±0.95a | 31.51±2.52b | 10.19±0.79a | 21.03±2.07c |
| MWAT (g) *# | 4.78±0.33a | 12.36±1.07b | 4.19±0.37a | 7.98±0.85c |
| IWAT (g) * | 1.71±0.19 | 3.68±0.53 | 1.40±0.06 | 2.68±0.30 |
| RWAT (g) *# | 1.69±0.18 | 3.95±0.52 | 1.17±0.09 | 3.07±0.33 |
| PWAT (g) *# | 3.93±0.36a | 11.53±0.98b | 3.43±0.47a | 7.30±0.98c |
| Glucose (mg/DL) | 142.23±3.83 | 143.00±5.29 | 142.01±4.39 | 142.59±3.86 |
| Corticosterone (ng/ml) | 93.09±30.75 | 210.37±36.95 | 154.43±42.45 | 183.42±41.62 |
indicates a significant main effect for diet
indicates a significant main effect for stress. Letters indicate a significant interaction with non-shared letters indicating a statistically significant difference between groups, p < 0.05.
Abbreviations: CVS, chronic variable stress; MWAT, mesenteric white adipose tissue; IWAT, inguinal white adipose tissue; RWAT, retroperitoneal white adipose tissue; PWAT, parametrial white adipose tissue
Figure 4.
Effects of CVS and diet on % body fat in female rats. Control high-fat fed females had significantly more body fat relative to all other groups. CVS high-fat fed females had significantly more body fat relative to the chow fed females. There was no difference in body fat between CVS chow and control chow groups. Values represent mean ± SEM, n= 9–10 per group. Non-shared letters denote statistical significance. Statistical significance is ascribed at p ≤0.05.
Individual fat pad depots
Mesenteric White Adipose Tissue (MWAT) and Parametrial White Adipose Tissue (PWAT)
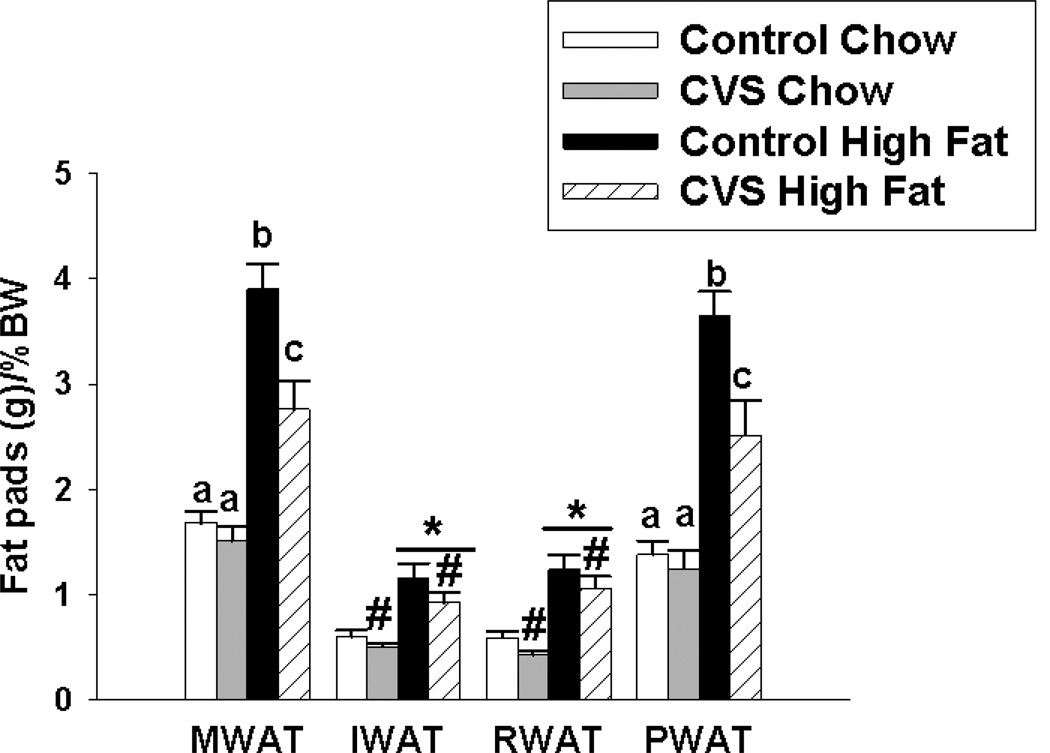
Overall CVS exposure decreased actual MWAT (F(1,35)=12.40, p<0.01) and actual PWAT (F(1,35)=10.20, p<0.01) and relative MWAT (F(1,35)=4.21, p<0.01) and relative PWAT (F(1,35)=7.52, p<0.01) fat pad weights. Females fed a high fat diet had greater actual MWAT (F(1,35)=64.94, p<0.01) and actual PWAT (F(1,35)=73.01, p<0.01) weights. High-fat fed females also had increased relative MWAT (F(1,35)=59.92, p<0.01) and relative PWAT (F(1,35)=58.26, p<0.01) fat pad weights. There was a significant CVS × diet interaction on actual MWAT (F(1,35)=7.21, p<0.01) and actual PWAT (F(1,35)=6.36, p<0.01) weights. Likewise, there was a significant CVS × diet interaction on relative MWAT (F(1,35)=5.68, p<0.01) and relative PWAT (F(1,35)=4.57, p<0.05) weights. Control females fed a chronic high fat diet had significantly increased MWAT and PWAT relative to all other groups. CVS females fed a high fat diet had significantly increased MWAT and PWAT relative to both chow groups. There was no significant difference in MWAT and PWAT between control and CVS chow-fed animals, suggesting that the CVS induced effects on these fat pads is specific to high fat diet exposure.
Inguinal White Adipose Tissue (IWAT)
CVS decreased actual (F(1,35)=4.50, p<0.05) IWAT fat pad weight (Table 1). The effect of CVS on relative IWAT did not reach significance (p=0.07). High fat diet increased actual (F(1,35)=28.33, p<0.01) and relative (F(1,35)=29.58, p<0.01) IWAT weight. There was no significant CVS × diet interaction on IWAT weight.
Retroperitoneal White Adipose Tissue (RWAT)
CVS decreased actual (F(1,35)=7.08, p=0.01) and relative (F(1,35)=6.21, p=0.01) RWAT weight. Diet also influenced actual (F(1,35)=62.74, p<0.01) and relative (F(1,35)=48.73, p<0.01) RWAT weight, with females fed a chronic high fat diet having significantly larger RWAT weight relative to their chow fed counterparts. There was no CVS × diet interaction. The data for actual and relative fat pad weights are represented in Table 1 and Figure 5, respectively.
Figure 5.
Effects of CVS and diet on individual % fat pad depots in female rats. Control high-fat fed females had significantly more MWAT and PWAT relative to all other groups. CVS high-fat fed females had significantly more MWAT relative to the chow fed females. There was no difference in MWAT weight between CVS chow and control chow groups. High-fat fed females had significantly increased IWAT relative to the chow group. Regardless of diet, CVS significantly decreased RWAT relative to the control group. In addition, high fat diet regardless of CVS exposure, significantly increased RWAT. Values represent mean ± SEM, n= 9–10 per group. *, # indicates significant main effect of high fat diet and CVS, respectively. Non-shared letters denote statistical significance. Statistical significance is ascribed at p ≤0.05.
Effects of CVS and diet on leptin, insulin, corticosterone and glucose concentrations
Leptin
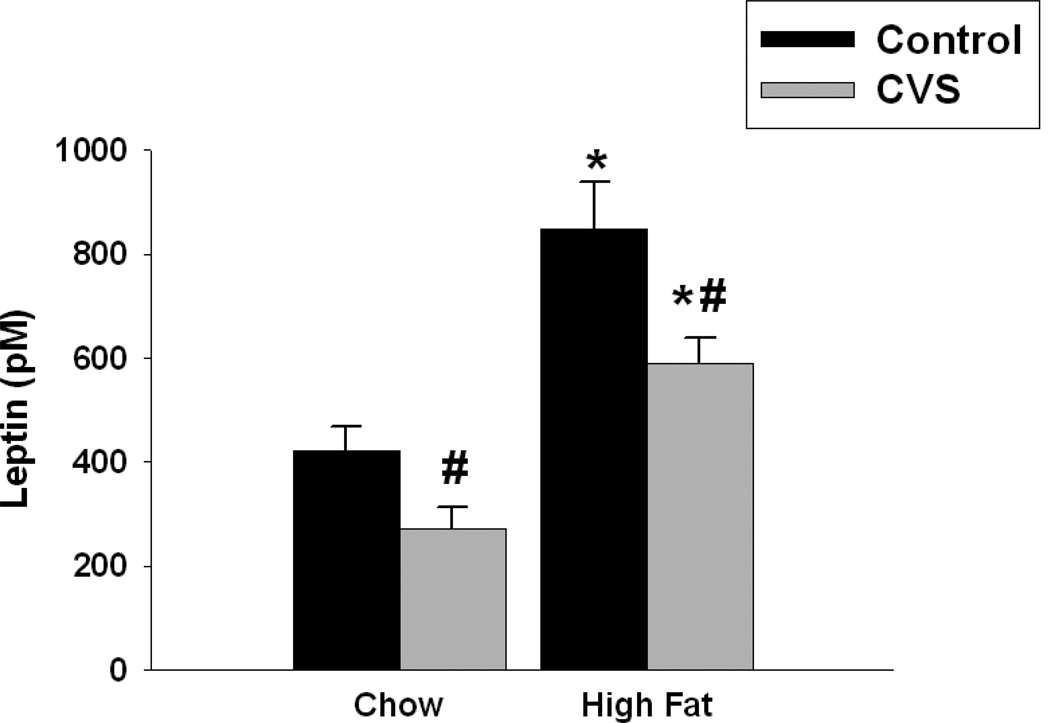
Regardless of diet, females exposed to CVS had significantly decreased leptin concentrations compared with their control counterparts (F(1,30)=9.72, p<0.01). In contrast, females fed a chronic high fat diet had increased circulating leptin concentrations compared with those fed a chow diet (F(1,30)=42.34, p<0.01). There was no CVS × diet interaction (Figure 6).
Figure 6.
Effects of CVS and diet on leptin concentrations in female rats. High fat diet, regardless of CVS significantly increased leptin concentrations. Likewise, CVS regardless of diet significantly decreased leptin concentrations. Values represent mean ± SEM, n= 8–10 per group. *, # indicates significant main effect of high fat diet and CVS, respectively. Statistical significance is ascribed at p ≤0.05.
Insulin
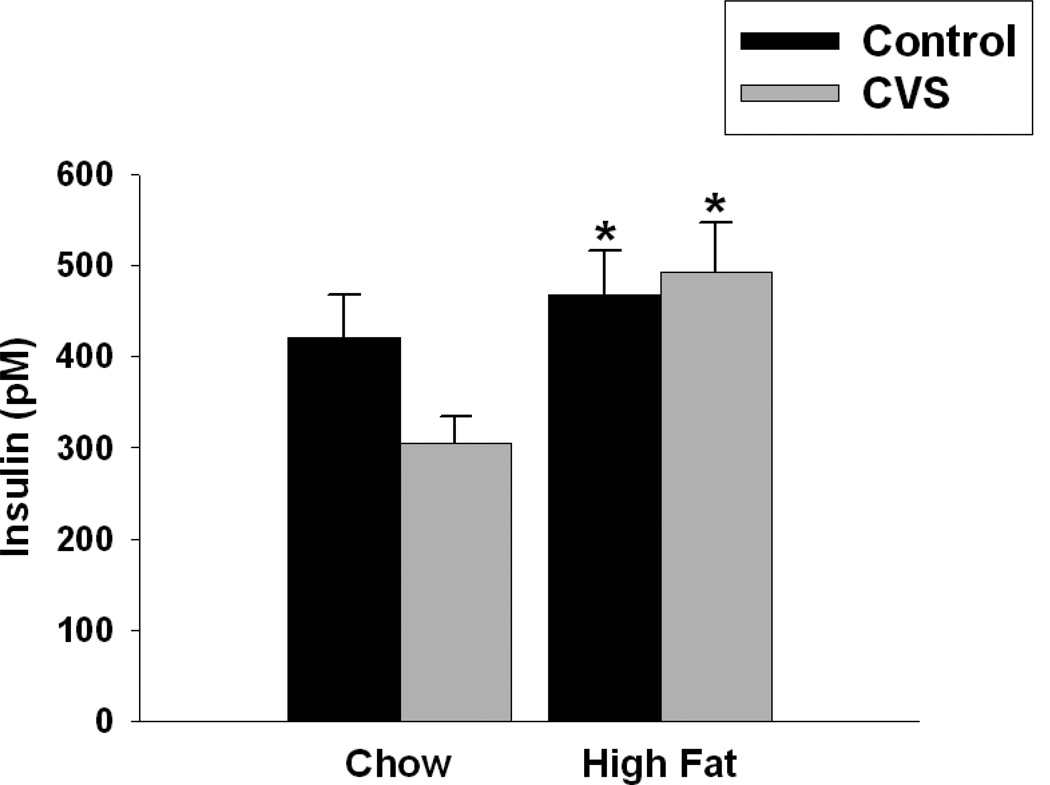
High fat fed females had significantly higher circulating insulin relative to those fed a chow diet (F(1,31)=4.19, p<0.05). Unlike the CVS induced effects on leptin, there was no significant main effect of CVS on insulin. There was no significant interaction of CVS and diet on insulin concentrations (Figure 7).
Figure 7.
Effects of CVS and diet on insulin concentrations in female rats. High fat diet regardless of CVS significantly increased insulin concentrations. Values represent mean ± SEM, n= 8–10 per group. * indicates significant main effect of high fat diet. Statistical significance is ascribed at p ≤0.05.
Corticosterone and Glucose
There was no difference among any of the groups with regard to circulating corticosterone and glucose concentrations (Table 1).
Discussion
Both chronic stress and increased consumption of high-fat diets are associated with the growing obesity trend. Here, we determined whether the combination of these two factors trigger symptomalogy characteristic of the metabolic syndrome in female rats. In the current study we found that female rats exposed to CVS exhibited decreased food intake, body weight and caloric efficiency regardless of diet, suggesting a stress-induced increase in energy expenditure. CVS also decreased circulating leptin concentrations. As expected, control females fed a chronic high-fat diet weighed significantly more and had increased overall adiposity and caloric efficiency, suggesting decreased energy expenditure. Control high-fat fed females also had higher circulating insulin and leptin concentrations relative to all other groups. Overall, the findings suggest opposite effects of CVS and high-fat diet on metabolic parameters with high fat diet increasing and CVS attenuating, body weight gain and decreasing total adiposity and circulating leptin concentrations. Interestingly, the CVS high-fat group had increased total and visceral adiposity and circulating leptin concentrations when compared with the chow fed groups, despite a similar weight gain trajectory. Contrary to our original hypothesis, the latter data indicates that chronic stress attenuates high-fat diet induced increases in body weight and adiposity.
Females exposed to a high-fat diet, regardless of CVS had increased body weight relative to the chow-fed females at weeks 2–5. The increased body weight gain in the chronic high-fat fed females was largely reflected as increased adiposity in all WAT fat pads and is consistent with previous data demonstrating high-fat diet induced increases in body weight and/or adiposity [20]. When diet was not a factor, CVS decreased bodyweight and RWAT fat pad weights. By the end of the study, there was no difference in body weight gain in the control chow, CVS-chow and CVS-high-fat groups. Interestingly, CVS did not completely reverse high-fat diet induced increases in visceral (MWAT) and reproductive (PWAT) fat. These data suggest that CVS-induced effects on overall adiposity are more apparent with obesegenic diets than with standard chow.
Chronic stress or excess glucococorticoid secretion is associated with increased visceral adiposity (i.e., MWAT) in rodents [14]. In the present study, CVS alone did not increase visceral MWAT fat pad weight. One argument for this lack of an effect might be that the animals were not “stressed.” Although we did not observe a CVS-induced increase in basal cortisosterone, CVS attenuated body weight gain, decreased overall caloric intake and induced thymic involution, suggestive of an engaged HPA axis over the 4 week CVS regime. Despite the fact that CVS attenuated high-fat diet induced excess body weight gain relative to the chow fed groups, the CVS high-fat group had increased total and visceral adiposity compared to the chow groups. Given the similarities in body weight and caloric efficiency among the CVS-high-fat group and the chow fed groups, one would also expect similar adiposity among these groups. This finding may have important implications regarding the role of body weight vs. adiposity as an indicator of overall metabolic health.
During the first week of the study, the high-fat fed females consumed significantly more calories than their chow-fed counterparts. This initial hyperphagia with novel exposure to high-fat diet is not uncommon in rodents. However, by the end of the study, the high-fat fed females (when CVS was not a factor) consumed significantly less calories as a percentage of body weight compared with the chow groups. Thus, diet-induced obesity in females may be more likely due to decreases in energy expenditure rather than significant increases in caloric consumption. Overall, CVS led to a decrease in caloric intake. The stress-induced decrease in food intake is associated with decreases in caloric intake in the CVS-high fat group, as there is not much of a difference in calories consumed between the CVS-chow and control chow groups. Past studies in both humans and rodents suggest that stress increases the consumption of calorically dense foods [6, 21]. In the present study, we did not observe a CVS-induced increase in high fat consumption. In fact, we observed almost the opposite with the CVS-high fat group significantly decreasing their caloric intake. One explanation for the lack of a stress effect on increased high fat consumption may be that the females did not have a choice. Previous studies report increased preference for high fat consumption under periods of stress when stress-sensitive animals are given a diet choice [13]. Therefore, future studies may explore the impact of stress on diet preference in females.
Although we did not directly measure energy expenditure in the present study, caloric efficiency was utilized as an indirect measure. Our data largely suggest a CVS-induced decrease in caloric efficiency. A decrease in caloric efficiency is suggestive of increased energy expenditure. Before CVS initiation, the high fat groups, weighed more and consumed more calories. However, during week 2 the CVS high fat group was less calorically efficient compared with the control high fat group, but had greater caloric efficiency relative to both chow groups. At week 2, the CVS high-fat group maintained greater (although not significant) caloric efficiency compared with the CVS chow group. The initial increase in caloric efficiency in the CVS high fat group (week 2 and 3) compared with the chow groups may account for their increased adiposity despite similar body weight gain. There is some variability in calories consumed and caloric efficiency within our control groups during weeks 2 and 3. The increased variability may be due to several factors including housing situation and estrous cycle variations. First, our animals are all housed in the same room and thus our control animals may have experienced some minor effects of the CVS due to ultrasonic vocalizations. Second, our females were randomly cycling and it is well known that gonadal hormone fluctuations can vary food intake. Our CVS induced decrease in caloric efficiency is consistent with previous studies employing a similar CVS paradigm [13]. However, some studies indicate that chronic social stressors decreases energy expenditure in some rodents [4, 5]. Together, these findings suggest that chronic stress effects on energy expenditure may be related to the nature of the stimulation paradigm.
Leptin and insulin are adiposity signals. In general, the amount of circulating leptin and insulin is proportional to the amount of overall body fat. Females exposed to a high-fat diet regardless of CVS exposure had significantly higher circulating leptin and insulin concentrations relative to the chow-fed females. Overall, CVS decreased leptin concentrations, most likely reflecting the decrease in adiposity in the CVS group relative to the control group. In contrast, there was no significant effect of CVS on circulating insulin concentrations in female rats. Likewise, circulating concentrations of insulin were similar between the CVS high fat and control high fat groups, despite decreased body fat and bodyweight in the CVS high fat group. Surprisingly we did not observe a high fat diet induced increase in circulating glucose concentrations in females. Previous studies demonstrate that calorically dense foods causes glucose intolerance in males [17], whereas females appear to be protected [22]. These data suggest a sex difference in glucose homeostasis under obesegenic diets. Clearly more studies are needed to determine the underlying hormonal mechanisms that may be associated with this phenomenon.
Overall, the data in the present study indicate that chronic stress alone does not favor excess weight gain and adiposity in female rats. The combination of high-fat diet and CVS attenuates high-fat diet induced weight gain and adiposity compared with the control high fat group suggesting a protective effect of CVS on these metabolic parameters. The effects of stress on metabolic endpoints may reflect the nature of our CVS regime. For example, during the CVS period, females are exposed to not only a number of psychogenic stressors (i.e., restraint, shaker and open-field exposure) but also physically-challenging stressors including cold and warm swim and cold room exposure. The combined presentation of these stressors over time increased energy expenditure resulting in decreases in body weight gain and adiposity. Although we did not assess body composition via carcass composition or nuclear magnetic resonance (NMR), data from our laboratory report decreases in fat and lean tissue in males exposed to CVS (Jankord, R and Herman, JP, unpublished observations). It is likely that the marked decrease in body weight in body weight gain in our CVS high fat females is due to significant decreases in lean tissue weight. This loss in lean tissue weight in the CVS high fat group may explain the similar body weight yet increased adiposity among the CVS high fat group and chow fed groups.
The fact that we did not observe a stress-induced increase in body weight and adiposity may be due to timing. For example, we assessed the impact of stress on body weight while the animals were actively undergoing chronic stress. Previous studies report that in the face of chronic social stress, subordinate male rats lose a significant amount of body weight and body fat. However, during the recovery phase, these previously stressed animals are hyperphagic and gain a considerable amount of body weight mainly due to increases in adiposity [23]. At face value, one can assume that the subordinates are consuming more calories and body fat in order to defend themselves against bigger, dominant conspecifics. In that vein, the data suggest that the actual stressful episodes may not be the culprit for increases in obesity in rodents but more so the anticipation of the “perceived” stress.
Acknowledging that humans are constantly faced with various stressors, and that stress is associated with obesity in humans, our data raise concern regarding the need for suitable rodent models for stress-induced obesity that adequately model the human phenomenon. Clearly there are several factors that must be considered when examining stress-induced changes in energy homeostasis including the type, severity and duration of the stressors. Here, we utilized a CVS paradigm which entailed the use of mixed stressors, both physical and psychological in nature. The use of other stress models (i.e., social stress) might yield a different outcome of stress on energy homeostasis.
In conclusion, the findings of the present study are among few that have carefully examined the impact of stress and diet on food intake, body weight and adiposity in female rodents. Overall, the data suggest that CVS attenuates high-fat diet induced increases in body weight and adiposity.
Research Highlights.
One of few studies to examine the combination of stress and high fat diet exposure in female rodents
Overall chronic stress attenuates body weight gain in females
Chronic stress prevents high-fat diet induced increases in body weight
Chronic stress does not prevent high-fat induced increases in adiposity and leptin
Acknowledgements
The authors would like to thank Nathan Evanson, Ph.D., Rong Zhang, Ph.D., Yvonne Ulrich-Lai, Ph.D., Anne Christiansen, Kenneth Jones and Benjamin Packard for help with tissue collection and help with radioimmunoassay. We also thank Michelle Foster, Ph.D. and Stephen Woods Ph.D. for thoughtful discussions concerning the manuscript. Finally, we would like to thank Diego Perez-tilve for help with the insulin and leptin analyses. This work was supported in part by NIH MH 069725 to JPH and an ARRA supplement to MBS.
Footnotes
Publisher's Disclaimer: This is a PDF file of an unedited manuscript that has been accepted for publication. As a service to our customers we are providing this early version of the manuscript. The manuscript will undergo copyediting, typesetting, and review of the resulting proof before it is published in its final citable form. Please note that during the production process errors may be discovered which could affect the content, and all legal disclaimers that apply to the journal pertain.
References
- 1.Kyrou I, Tsigos C. Stress hormones: physiological stress and regulation of metabolism. Curr Opin Pharmacol. 2009;9(6):787–793. doi: 10.1016/j.coph.2009.08.007. [DOI] [PubMed] [Google Scholar]
- 2.Wajchenberg BL, et al. Estimation of body fat and lean tissue distribution by dual energy X-ray absorptiometry and abdominal body fat evaluation by computed tomography in Cushing's disease. J Clin Endocrinol Metab. 1995;80(9):2791–2794. doi: 10.1210/jcem.80.9.7673425. [DOI] [PubMed] [Google Scholar]
- 3.Shively CA, Clarkson TB. Regional obesity and coronary artery atherosclerosis in females: a non-human primate model. Acta Med Scand Suppl. 1988;723:71–78. doi: 10.1111/j.0954-6820.1987.tb05930.x. [DOI] [PubMed] [Google Scholar]
- 4.Foster MT, et al. Social defeat increases food intake, body mass, and adiposity in Syrian hamsters. Am J Physiol Regul Integr Comp Physiol. 2006;290(5):R1284–R1293. doi: 10.1152/ajpregu.00437.2005. [DOI] [PubMed] [Google Scholar]
- 5.Solomon MB, et al. Social defeat and footshock increase body mass and adiposity in male Syrian hamsters. Am J Physiol Regul Integr Comp Physiol. 2007;292(1):R283–R290. doi: 10.1152/ajpregu.00330.2006. [DOI] [PubMed] [Google Scholar]
- 6.Epel E, et al. Stress may add bite to appetite in women: a laboratory study of stress-induced cortisol and eating behavior. Psychoneuroendocrinology. 2001;26(1):37–49. doi: 10.1016/s0306-4530(00)00035-4. [DOI] [PubMed] [Google Scholar]
- 7.Wilson ME, et al. Quantifying food intake in socially housed monkeys: social status effects on caloric consumption. Physiol Behav. 2008;94(4):586–594. doi: 10.1016/j.physbeh.2008.03.019. [DOI] [PMC free article] [PubMed] [Google Scholar]
- 8.Harris RB, et al. Chronic disruption of body weight but not of stress peptides or receptors in rats exposed to repeated restraint stress. Horm Behav. 2006;49(5):615–625. doi: 10.1016/j.yhbeh.2005.12.001. [DOI] [PubMed] [Google Scholar]
- 9.Tamashiro KL, et al. Metabolic and endocrine consequences of social stress in a visible burrow system. Physiol Behav. 2004;80(5):683–693. doi: 10.1016/j.physbeh.2003.12.002. [DOI] [PubMed] [Google Scholar]
- 10.Pulliam JV, et al. Social defeat stress produces prolonged alterations in acoustic startle and body weight gain in male Long Evans rats. J Psychiatr Res. 44(2):106–111. doi: 10.1016/j.jpsychires.2009.05.005. [DOI] [PMC free article] [PubMed] [Google Scholar]
- 11.Solomon MB, et al. The medial amygdala modulates body weight but not neuroendocrine responses to chronic stress. J Neuroendocrinol. 22(1):13–23. doi: 10.1111/j.1365-2826.2009.01933.x. [DOI] [PubMed] [Google Scholar]
- 12.Ulrich-Lai YM, et al. Daily limited access to sweetened drink attenuates hypothalamic-pituitary-adrenocortical axis stress responses. Endocrinology. 2007;148(4):1823–1834. doi: 10.1210/en.2006-1241. [DOI] [PMC free article] [PubMed] [Google Scholar]
- 13.Teegarden SL, Bale TL. Effects of stress on dietary preference and intake are dependent on access and stress sensitivity. Physiol Behav. 2008;93(4–5):713–723. doi: 10.1016/j.physbeh.2007.11.030. [DOI] [PMC free article] [PubMed] [Google Scholar]
- 14.Dallman MF, Pecoraro NC, la Fleur SE. Chronic stress and comfort foods: self-medication and abdominal obesity. Brain Behav Immun. 2005;19(4):275–280. doi: 10.1016/j.bbi.2004.11.004. [DOI] [PubMed] [Google Scholar]
- 15.Woods SC, et al. A controlled high-fat diet induces an obese syndrome in rats. J Nutr. 2003;133(4):1081–1087. doi: 10.1093/jn/133.4.1081. [DOI] [PubMed] [Google Scholar]
- 16.Hoffler U, et al. Diet-induced obesity is associated with hyperleptinemia, hyperinsulinemia, hepatic steatosis, and glomerulopathy in C57Bl/6J mice. Endocrine. 2009;36(2):311–325. doi: 10.1007/s12020-009-9224-9. [DOI] [PMC free article] [PubMed] [Google Scholar]
- 17.Wang Y, et al. The development of diabetes mellitus in Wistar rats kept on a high-fat/low-carbohydrate diet for long periods. Endocrine. 2003;22(2):85–92. doi: 10.1385/endo:22:2:85. [DOI] [PubMed] [Google Scholar]
- 18.Solomon MB, Herman JP. Sex differences in psychopathology: of gonads, adrenals and mental illness. Physiol Behav. 2009;97(2):250–258. doi: 10.1016/j.physbeh.2009.02.033. [DOI] [PMC free article] [PubMed] [Google Scholar]
- 19.Choi DC, et al. The role of the posterior medial bed nucleus of the stria terminalis in modulating hypothalamic-pituitary-adrenocortical axis responsiveness to acute and chronic stress. Psychoneuroendocrinology. 2008;33(5):659–669. doi: 10.1016/j.psyneuen.2008.02.006. [DOI] [PMC free article] [PubMed] [Google Scholar]
- 20.Priego T, et al. Sex-differential expression of metabolism-related genes in response to a high-fat diet. Obesity (Silver Spring) 2008;16(4):819–826. doi: 10.1038/oby.2007.117. [DOI] [PubMed] [Google Scholar]
- 21.Pecoraro N, et al. Chronic stress promotes palatable feeding, which reduces signs of stress: feedforward and feedback effects of chronic stress. Endocrinology. 2004;145(8):3754–3762. doi: 10.1210/en.2004-0305. [DOI] [PubMed] [Google Scholar]
- 22.Lu Z, et al. Protection from high-fat-diet-induced impaired glucose tolerance in female Sprague-Dawley rats. Gynecol Endocrinol. 2009;25(7):464–471. doi: 10.1080/09513590902770107. [DOI] [PubMed] [Google Scholar]
- 23.Tamashiro KL, et al. Social stress and recovery: implications for body weight and body composition. Am J Physiol Regul Integr Comp Physiol. 2007;293(5):R1864–R1874. doi: 10.1152/ajpregu.00371.2007. [DOI] [PubMed] [Google Scholar]


