Abstract
Objectives
We coupled two strategies – trait extremes and genome-wide pooling – to discover a novel BP locus that encodes a previously uncharacterized thiamine transporter.
Background
Hypertension is a heritable trait that remains the most potent and widespread cardiovascular risk factor, though details of its genetic determination are poorly understood.
Methods
Representative genomic DNA pools were created from male and female subjects in the highest and lowest 5th %iles of BP in a primary care population of >50,000 individuals. The peak associated SNPs were typed in individual DNA samples, as well as twins/siblings phenotyped for cardiovascular and autonomic traits. Biochemical properties of the associated transporter were evaluated in cellular assays.
Results
After chip hybridization and calculation of relative allele scores, the peak associations were typed in individual samples, revealing association of hypertension, SBP, and DBP to the previously uncharacterized solute carrier SLC35F3. The BP genetic association at SLC35F3 was validated by meta-analysis in an independent sample from the original source population, as well as the ICBP (across North America and Western Europe). Sequence homology to a putative yeast thiamine (vitamin B1) transporter prompted us to express human SLC35F3 in E. coli, which catalyzed [3H]-thiamine uptake. SLC35F3 risk allele (T/T) homozygotes displayed decreased erythrocyte thiamine content on microbiological assay. In twin pairs, the SLC35F3 risk allele predicted heritable cardiovascular traits previously associated with thiamine deficiency, including elevated cardiac stroke volume with decreased vascular resistance, and elevated pressor responses to environmental (cold) stress. Allelic expression imbalance (AEI) confirmed that cis-variation at the human SLC35F3 locus influenced expression of that gene, and the AEI peak coincided with the hypertension peak.
Conclusions
Novel strategies were coupled to position a new hypertension susceptibility locus, uncovering a previously unsuspected thiamine transporter whose genetic variants predicted several disturbances in cardiac and autonomic function. The results have implications for the pathogenesis and treatment of systemic hypertension.
Keywords: SLC35F3, thiamine, transporter, hypertension
INTRODUCTION
Hypertension is the most common and lethal of cardiovascular risk factors (1), but despite pharmacological advances it remains inadequately controlled by medications (2). BP displays substantial heritability (h2 typically in the range of ~30–50%)(3), but its genetic determinants remain largely elusive, a problem referred to as the “missing heritability” (4). While rare Mendelian syndromes of familial hypertension have been documented, usually in association with renal or electrolyte disturbances (5), the bulk of common heritable BP variation in the population remains unexplained (6). Genetic linkage (meiotic co-segregation) approaches generally possess insufficient resolution for very complex traits such as hypertension (7), and even recent successes in genome wide association have detected loci with high significance but small effect sizes (8).
We took a different approach to genetic determinants of BP variation in the population: harnessing the power of trait extremes (9), coupled with pooling for genome wide association (10). The use of phenotypic extremes is a powerful approach both theoretically and practically (11) in genetic association studies, and genomic DNA pooling has been an efficient strategy in genome wide searches for susceptibility alleles. Here we coupled these two strategies, discovering and verifying the role of a novel solute transporter in association with systemic hypertension.
METHODS
Human subjects
Subjects were volunteers, and each subject gave informed, written consent; the protocols were approved by the institutional review board. Recruitment procedures, definitions and confirmation of subject diagnoses are according to previous reports. Genomic DNA of each individual was prepared from blood leukocytes. Characteristics of the 3 human population samples are given in Table 1.
Table 1.
Human subject groups evaluated in this study of SLC35F3 genetic variation and BP.
| Age, years | ||||||
|---|---|---|---|---|---|---|
| Group genotyped for SLC35F3 |
Purpose in study | Total n tudied |
% Female |
Mean | SEM | % with hypertension: SBP≥140 or DBP≥90 mmHg, or on BP-rx |
|
UCSD twins/siblings |
“Intermediate” (early) traits |
616 | 71.8% | 40.0 | 0.7 | 11.2% |
|
San Diego (Kaiser) population BP extremes |
Discovery of BP association (pooled → individual) |
1994 | 60.8% | 58.2 | 0.3 | 48.0% |
| ICBP | Replication of BP association |
29,453 | 54.7% | 49.9 | 1.1 | 32.5% |
| Total | 32,063 | |||||
Blood pressure: Population trait extreme samples in San Diego
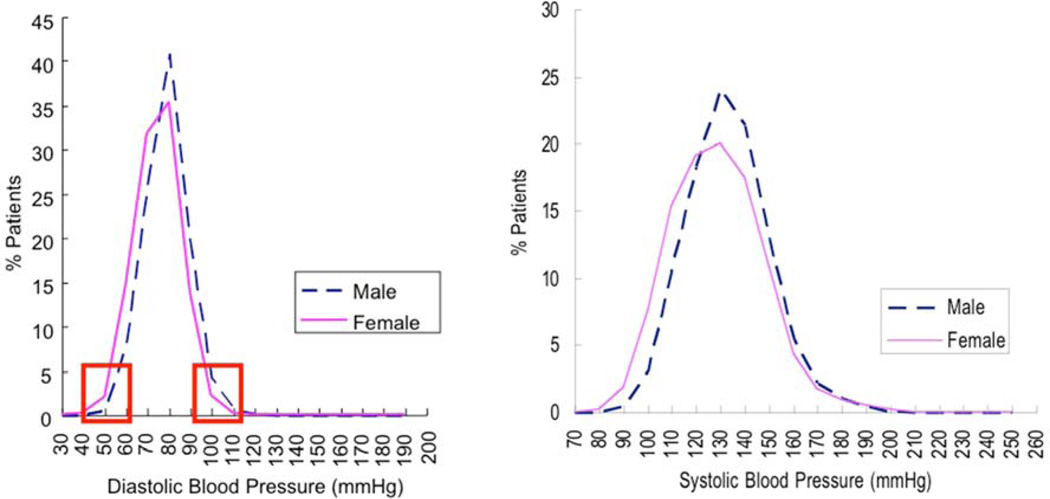
The power of an association study on extreme samples was computed (9) under varying disease allele frequencies for type I error rate (alpha). We thus determined that this sample has >90% power to detect genotype association with a trait when the genotype contributes as little as 3% to the total variation in men; the power is even higher in the female cohort. We began by studying subjects of white (European, by self identification) ancestry, recruited from a large adult primary care (Kaiser Permanente) population in San Diego, as previously described (9). In this primary care population, ~81% attended the clinic, and ~46% consented to participation in the study, with collection of blood for preparation of genomic DNA. Subjects who did or did not participate were similar in self-reported age- and sex-specific history of myocardial infarction (men: 4.6% vs. 4.0%; women: 1.4% vs. 1.3%) or in other conditions including hypertension, diabetes, obesity, or high cholesterol level. BP was measured by trained health assistants in the same Health Appraisal office within a single facility (Kaiser Permanente, Clairemont Mesa Medical Offices, 7060 Clairemont Mesa Blvd., San Diego, CA 92111), in seated subjects with a regularly calibrated aneroid system, including a manual blood pressure cuff and auscultation of the brachial artery at the antecubital fossa. The protocol included cuff inflation to 200 mmHg, with pressure then gradually released. SBP was recorded as the pressure at which the first sound is heard (i.e., Korotkoff-1), while DBP was recorded as the pressure at which the sounds disappear (i.e., Korotkoff-5). If blood pressure was either >150/>90 mmHg (or both), a second reading was taken. From consented participants, the subjects in this study were selected, based upon measurement of DBP, to represent the highest and lowest ~5th DBP percentiles in that population (Figure 1). Subjects were ascertained by using DBP as the trait because twin and family studies provide evidence that DBP is substantially heritable (12–14), and SBP correlates highly with DBP. In the trait-extreme subjects, there was substantial and non-overlapping separation between both the DBP and SBP values. A second sampling of different individuals from within BP extremes of the same population allowed for replication. The statistical power of association between bi-allelic DNA markers and human quantitative trait loci can be substantially augmented by the sampling individuals from opposite (upper and lower) ends of the trait distribution (11), and analyses of the quantitative trait in extreme subjects (as opposed to dichotomization of the trait) further enhances power (9) (15). This population sample afforded us >90% power to detect genotype association with a trait when the genotype contributes as little as ~2.5% to the total variation in males (even at p<10−8); the power is even higher in the females. To accomplish this, lower BP individuals were selected from the bottom 5th percentiles of DBP, while the higher BP group was selected from the top 5th percentiles of DBP. Both SBP and DBP differed significantly between the BP extreme groups (P<0.0001). Forty-one percent of patients in the higher BP group were taking one or more antihypertensive medications (including diuretics and angiotensin-converting enzyme [ACE] inhibitors), while none in the lower BP group were on such treatment. Further BP/SNP association studies were replicated in an independent sample of different individuals from the same primary health care provider, using the same recruitment criteria as the first cohort described above. The research was approved by the local Human Research Protection Program, and all subjects gave informed written consent.
Figure 1. Population BP extremes: A powerful approach to genotypes underlying hypertension.
Blood pressure distribution in a primary care population of ~53,000 adults. From a primary care database of over 53,000 people (27,478 females and 25,528 males), we ascertained age-, gender-and ethnicity-matched individuals with extremely high and low DBPs (from the upper and lower 5th percentiles of the DBP distribution). This approach has >90% power to detect loci contributing >2.5% of BP variance. Red rectangles: DBP range for upper and lower %ile (extreme) sample selection. Schork et al. AJHG 67:1208–1218, 2000. Kaiser health maintenance screening, San Diego, California.
Extension of hypertension association into an additional population sample: Replication in ICBP
Extension of associations in our blood pressure extreme cohorts was sought in the International Consortium for Blood Pressure Genome-Wide Association Studies (ICBP), across North America and Western Europe. Complete details of ICBP methodology have previously been presented (6). In short, ICBP data <http://www.georgehretlab.org/icbp_088023401234-9812599.html> were analyzed separately for SBP and DBP, with local SLC35F3 region data plotted at LocusZoom <http://csg.sph.umich.edu/locuszoom/>. For the peak BP-associated SNP in the 2nd intron (rs16842784, C>A), the numbers of available ICBP individuals for SBP/DBP were n=27,865/n=29,452.
Twin pairs and siblings for autonomic and cardiac phenotyping (UCSD)
From 235 nuclear families, 399 individuals including twin and sibling pairs were recruited from southern California to conduct the following study. Zygosity was confirmed by extensive microsatellite and SNP genotyping, as described (16). Twins ranged in age from 15–84 years; 10% were hypertensive. Thus, the twin/sibling analyses were adjusted for sex and age. All of the twins in these allelic/haplotype association studies were self-identified as being of European (Caucasian) ancestry.
Cardiac and vascular function
Baseline/resting cardiovascular traits (SBP, DBP, HR, CI [cardiac index], and SVRI [systemic vascular resistance index]) were estimated in twins/siblings non-invasively using the DynaPulse oscillometric device (PulseMetric, Vista, CA) as previously described (17). Flow parameters (CO, SVR) were normalized to body surface area, to yield CI and SVRI. The correspondence between DynaPulse and more traditional or invasive determinations of cardiac output and systemic vascular resistance have been documented recently (18).
Environmental (cold) stress test
To probe the functional significance of common variation at SLC35F3, we examined the potential influence of polymorphisms on the blood pressure response during the environmental (cold) stress test (19) of 399 twin (MZ or DZ) and sibling individuals. During the stressor, the subject immersed the non-dominant hand into ice (0°C) water for one minute, with averaged measurements of SBP, DBP, and HR, stable over 3 beats pre- and post-procedure.
Autonomic neural function
Sensitivity of the baroreceptor reflex arc (in msec/mmHg) was tested by the ramp (time domain) method, using spontaneous excursions of SBP upwards (with reflex bradycardia) and downwards (with reflex tachycardia), as described (20,21). BP (in mmHg) and pulse interval (R-R interval or heart period, in msec per beat) were recorded continuously and noninvasively for 5 minutes in seated subjects with a radial artery applanation device and dedicated sensor hardware (Colin Pilot, Colin Instruments, San Antonio, Tex) and software (ATLAS, WR Medical, Stillwater, MN; Autonomic Nervous System, Tonometric Data Analysis [ANS-TDA], Colin Instruments, San Antonio, Tex) calibrated every 5 minutes against ipsilateral brachial arterial pressure with a cuff sphygmomanometer. Heart rate was recorded continuously with thoracic ECG electrodes to the Colin Pilot. BP and heart rate were recorded continuously with the same devices during spontaneous excursions of BP with reciprocal heart rate changes: upward excursions of BP with reflex bradycardia and downward excursions of BP with reflex tachycardia. In each case, baroreceptor slope in the “time domain” was calculated with the ANS-TDA software, with beat-by-beat regression of change in pulse interval (R-R interval; ms/beat) as a function of change in SBP (SBP, mmHg) on the preceding beat (phase lag = 1 beat). Time windows of >4 beats were used, with change in SBP of >1 mmHg and change in R-R of >6 msec. Baroreceptor slope (msec/mmHg) values were recorded for regressions with correlation coefficients of r >0.9. The slopes for 3 such regressions, if each was within ±10% of the mean value, were averaged to yield the final value for baroreceptor slope.
Secretoneurin assay
Human plasma treated with EDTA as an anticoagulant was frozen and stored at −70°C prior to assay. The biologically active secretoneurin fragment of human SCG2 (TNEIVEEQYTPQSLATLESVFQELGKLTGPNNQ) was measured by RIA, as previously described (22) with a rabbit polyclonal antibody directed against synthetic human secretoneurin (SCG2154–165) and iodination on the endogenous Tyr. The assay sensitivity in plasma was <40 pmol/L, with a reference range of <220 pM (<0.22 nM).
Genome wide association
The rationale, methodology, and quality metrics for the pooling approach to genome wide association have been presented detail (10). Briefly, we formed representative DNA pools from 4 groups of subjects with the most extreme (upper and lower 5th %iles) of BP in a large primary care population: highest male (n=277), highest female (n=283), lowest male (n=241), and lowest female (n=330). Genomic DNA was prepared from blood leukocytes in each individual, then quantified by PicoGreen fluorescence, and then equivalent amounts of DNA from each individual were incorporated into each of the 4 pools. The quality of the pooled DNA was verified by appearance on 1% agarose gel followed by ethidium bromide staining. The 4 pooled DNA samples were then hybridized (after digestion with either NspI or StyI) to replicate Affymetrix 5.0 (~500K) SNP arrays (4 arrays per pooled sample). In addition, the same samples were hybridized to replicate Illumina HumanHap300 (~300K) SNP arrays.
Relative Allele Scores (RAS = A/[A+B]), were calculated for bi-alleleic SNPs as described <http://bioinformatics.tgen.org/brunit/software/tgen-array/>, where A=major allele and B=minor allele), to highlight the most significantly associated SNPs. RAS were calculated in the highest versus lowest BP groups, which were then ranked for each SNP. SNP loci with RAS values most different between extreme cases and extreme controls, for both the Affymetrix-5.0 and Illumina HumanHap300, were pursued further. First, we ranked all SNPs by their allele frequency differences between the two blood pressure groups. Second, we took the top 250 SNPs from each array (Affymetrix and Illumina) and computed the absolute (bp) distances between each neighboring SNP in these top lists. For those SNPs that were on different arrays but were ranked in the top 250 SNPs, and had a nearby neighbor SNP from the opposite array, we ranked (supplemental Table 1) and selected candidates for follow up replication genotyping, resulting in 5 selected SNP pairs. Since the initial decision for locus/SNP follow-up was based on genotyped pools, standard statistical tests were not applicable at this stage.
Individual SNP genotyping
Diploid rs17514104 (SLC35F3 tagging SNP in Intron-2: TGGAA[C/T]TTGAC; alleles C>T) or rs16842784 (C>A, also in Intron-2) genotypes were determined by either two extension-based techniques, either the MALDI (matrix assisted laser desorption ionization) mass spectrometry method of Sequenom (La Jolla, CA), or the luminescent base incorporation method of Pyrosequencing (Biotage, Qiagen), in which genotypes were verified by visual inspection, with exclusion of artifactual data from further analysis, or by the TaqMan primer/probe system on an ABI-7900HT device (Applied Biosystems; Foster City, CA). Reproducibility of diploid genotypes was verified with blinded replicate samples, indicating 98.8% concordance. In the twin/sib sample, genotypes were acquired as part of a genome-wide scan (Illumina-610-Quad; Illumina, La Jolla, CA), and verified in each subject by TaqMan. rs17514104 diploid genotypes were in Hardy-Weinberg Equilibrium (HWE c2=0.001, p=0.966; minor allele frequency ~27–28%).
Statistics and bioinformatics
Statistics
Estimates are stated as mean value ± one standard error. Traits that were not normally distributed were log10-transformed prior to parametric data analyses. Two-way ANOVA or multivariate general linear modeling, as well as post-hoc corrections, were performed in SPSS-11.5 (Chicago, IL) to evaluate the significance of single variants during in vivo association studies as well as in vitro transporter activity. During marker-on-trait associations in vivo, results of descriptive statistics (mean±SEM for each diploid genotype) were plotted in order to select the optimal model (additive versus dominant/recessive) for inferential statistical testing (F, chi-square, p). BP analyses were adjusted for age and sex, as well as the effects of antihypertensive treatment, by adding a fixed value (10/5 mmHg) to each treated BP, as described (23); although such adjustments are necessarily imperfect, their value is reinforced by restoration of familial (sibling/sibling) BP correlations (23). Parametric, general linear model (typically, 2-way ANOVA) analyses tested associations of SLC35F3 diploid genotypes and continuous BP traits (mmHg). Dichotomous variables (e.g., hypertension) were analyzed by proportions and chi-square test. For twin pair analyses, descriptive (genotype-specific mean±SEM) and inferential (chi-square, p value) statistics were computed across all of the twins, using generalized estimating equations (GEEs; PROC GENMOD) in SAS (Statistical Analysis System; Cary, NC) or SPSS, to account for correlated trait values within each twinship, using an exchangeable correlation matrix (24). In twin pairs, heritability (or the fraction of trait variance accounted for by genetic variance, h2=VG/VP) was estimated by SOLAR (Sequential Oligogenic Linkage Analysis Routines) (25), available at <http://www.txbiomed.org/departments/genetics>. Haplotypes were imputed from unphased diploid genotypes on the DBH promoter region using an expectation-maximization algorithm in PLINK (version 1.07, Harvard University; Cambridge, MA), available at available at <http://pngu.mgh.harvard.edu/~purcell/plink/>. Meta-analyses were carried out with the command META, testing fixed effect (i.e., genotype as independent variable) models in STATA-12 (College Station, TX), after individual study regression analysis in SPSS or R, incorporating individual study data to derive significance as well as pooled genotype effect size (beta, or slope per allele) and its SE (standard error). FDR (False Discovery Rate): In consideration of testing the effects of multiple correlated alleles (or diploid genotypes) at a locus on a trait, we employed estimation of the FDR, in order to minimize false negative results while maximizing true positive results, using the Excel calculator of FDR from p-values, at <http://www.rowett.ac.uk/~gwh/fdr.html>. Alternative mRNA splicing: Based on transcript and EST (Expressed Sequence Tag; short mRNA→cDNA fragment) evidence (with sequence data processing at <http://ccg.vital-it.ch/tromer> according to (26)), computationally derived alternative splicing patterns were viewed at <http://genome.ucsc.edu>.
SLC35F3 functional and structural predictions
Transporter homology predictions were conducted within the Transporter Classification DataBase (TCDB), at <http://www.tcdb.org>, evaluating sequence similarity as well as functional classification and likely orthologs, paralogs, and membrane-spanning secondary structures. Amino acid sequence alignments were conducted in Clustal-W, at <http://www.ebi.ac.uk/Tools/msa/clustalw2/>. Cellular localization (organelle) targeting sequences were evaluated at <http://www.cbs.dtu.dk/services/TargetP/>.
SLC35F3 and thiamine metabolism
SLC35F3 expression
The human SLC35F3 full-length cDNA (Unigene Hs. 158748, RefSeq mRNA XM_001132419.1, Image clone 5273868, NCBI accession BC037878.1, IRAK75-e24) was obtained from Geneservice Ltd. <http://www.geneservice.co.uk> in pBluescript-R, and subcloned into the prokaryotic expression plasmid pZE12luc (27), under the control of the PLlacO-1 promoter. E. coli strain MW25113 (with endogenous thiamine transport [ThiBPQ = sfuABC] and biosynthetic [ThiH] genes inactivated) was transformed by this plasmid, under selection by ampicillin, with expression of SLC35F3 triggered by 1 mM IPTG.
Thiamine uptake catalyzed by SLC35F3
Thiamine [3H(G)] hydrochloride, at 10–20 Ci/mmol (0.37–0.74 TBq/mmol) was obtained from American Radiolabeled Chemicals (ART-0710; St. Louis, MO). The uptake protocol followed our previous studies (28), with modifications as noted here. E. coli grown in minimal medium (M9 with 0.2% glucose, 100 ng/ul ampicillin, and 1 mM IPTG) was harvested in the exponential growth phase, pelleted and washed once in ice-cold M9 medium, and resuspended in M9 (plus 0.2% glucose), with cell density adjusted to OD500=1 (light scattering). [3H]-thiamine was added at 20 nM, and uptake studies were conducted at 18°C; in an initial kinetic experiment (time course), cellular net uptake of [3H]-thiamine, catalyzed by SLC35F3 expression, was maximal by 5 minutes. Aliquots (100 µl) were periodically removed from the 1-ml cell suspensions, diluted 15-fold with M9 buffer, filtered (0.45-µm Millipore filters) and washed twice with the same buffer. After drying the filters under a heat lamp for 15 min, radioactivity was measured by scintillation counting using 10 ml of Biosafe NA scintillation fluid (Research Products International, Mt. Prospect, IL, USA). Uptake activity attributed to SLC35F3 alone was obtained by subtracting the activity remaining in the absence of SLC35F3 function from the cDNA-expressed activity, assuming that absence of SLC35F3 does not activate some other transporter.
Human erythrocyte thiamine (vitamin B1) determination
Blood was obtained from individuals of known diploid genotype at SLC35F3 rs17514104, specifically major allele (C/C) and minor allele (T/T) homozygotes, into EDTA anticoagulant tubes, whereupon whole blood was frozen at −70°C prior to thawing and thiamine assay by a microbiological method as described (29,30), wherein a thiamine-growth-dependent strain of Lactobacillus fermentum is used on a coated 96-well microtiter plate in a commercial spectrophotometric kit (Immundiagnostik AG, Stubenwald-Allee 8a, 64625 Bensheim, Germany <www.immundiagnostik.com)>. After incubation at 37°C for 48 h, the growth of Lactobacillus fermentum is measured turbidimetrically at 630 nm in an ELISA spectrophotometric reader, and a standard curve is generated from the dilution series. The amount of vitamin B1 is directly proportional to the turbidity. Assay standards ranged from 0–15 µg/L, and blood samples were typically assayed in duplicate or triplicate at 1:10 dilution. The results correlate well with HPLC methods (r=0.886), and the coefficients of variation were: intra-assay 2.75% (n=28), and inter-assay 3.81% (n=5). Results are expressed as µg/L blood.
Allelic Expression Imbalance (AEI) at the SLC35F3 locus
The rationale for the AEI approach is detailed in (31): AEI was employed to provide evidence that a cis-QTL (in particular, a cis-eQTL for mRNA expression) exists at the SLC35F3 locus; that is, the abundance of SLC35F3 transcripts is tested for dependence upon the diploid genotype (both alleles) at the same locus encoding the transcript.
Human AEI
From 53 CEU lymphoblastoid cell lines, genomic DNA and double-stranded cDNA were used for the parallel genotyping and AEI analysis on Illumina Infinium Human1M or Human1M-Duo SNP bead microarrays, as described (32). Briefly, the results of SNP genotyping and allelic transcript ratios as defined by averaging across all measured SNPs in each sample for the annotated transcripts were coupled by linear regression to discover cis-rSNPs. Prior to averaging allele ratios across each transcript we applied a polynomial normalization to account for intensity dependent variation in allelic expression ratios observed in cDNA samples as previously described (33). Multiple testing was addressed by permutation tests at the transcripts; based on permutation tests, significance of p<1E-7 was considered genome-wide significant, as defined by a false-positive rate of ~50–100 per 10,000 measured transcripts (32).
Rodent (mouse) AEI
AEI in mouse strains was measured using F1 animals generated from 4 inbred strains with known genetic sequence. 6 F1 strains (all possible pairings) were generated from parental strains A/J (A), C3H/HeJ (C), C57BL/6NJ (B), and DBA/2J (D). Liver RNA was obtained from 6 male F1 animals from each F1 strain. The RNA from these 6 animals was pooled into two groups of 3 which were hybridized to the Mouse Diversity Array (MDA) (34), a genotype array containing 600,000 SNPs polymorphic in mouse strains. The genomic DNA from each of the F1s was also hybridized to the MDA. By comparing the different levels of relative intensity of the alleles in the genomic DNA compared to the intensity of the alleles in the RNA, we can measure the amount of AEI in each F1 strain.
RESULTS
Genome wide association: Population BP extreme samples in San Diego
Based on Relative Allele Scores in the higher versus lower BP groups, on both the Affymetrix 5.0 (~500K) and Illumina HumanHap300 (~300K) SNP array hybridizations, the variants within each gender analysis were then ranked by allele frequency differences and prioritized for validation genotyping. At this point, results of pooling were not amenable to standard statistical testing. Tagging SNPs were then selected for further study by individual genotyping in the original (unpooled) population extreme BP samples (from which the pools had been formed). Since individual genotyping results on SLC35F3 (a ~420-kbp locus on chromosome 1q42) achieved statistical significance with BP, that locus was selected for additional evaluation. The BP-associated region of SLC35F3, as defined by tag SNPs, is within Intron-2 of this ~420 kbp locus.
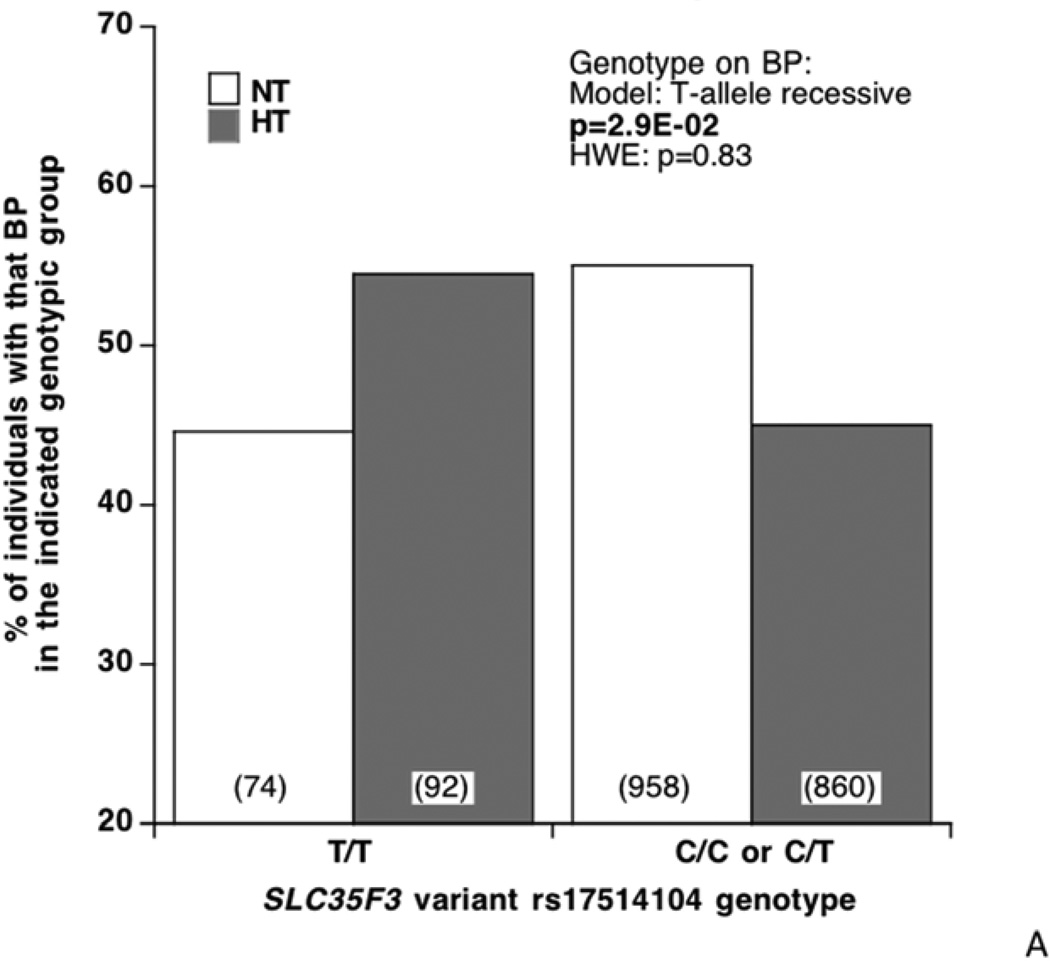
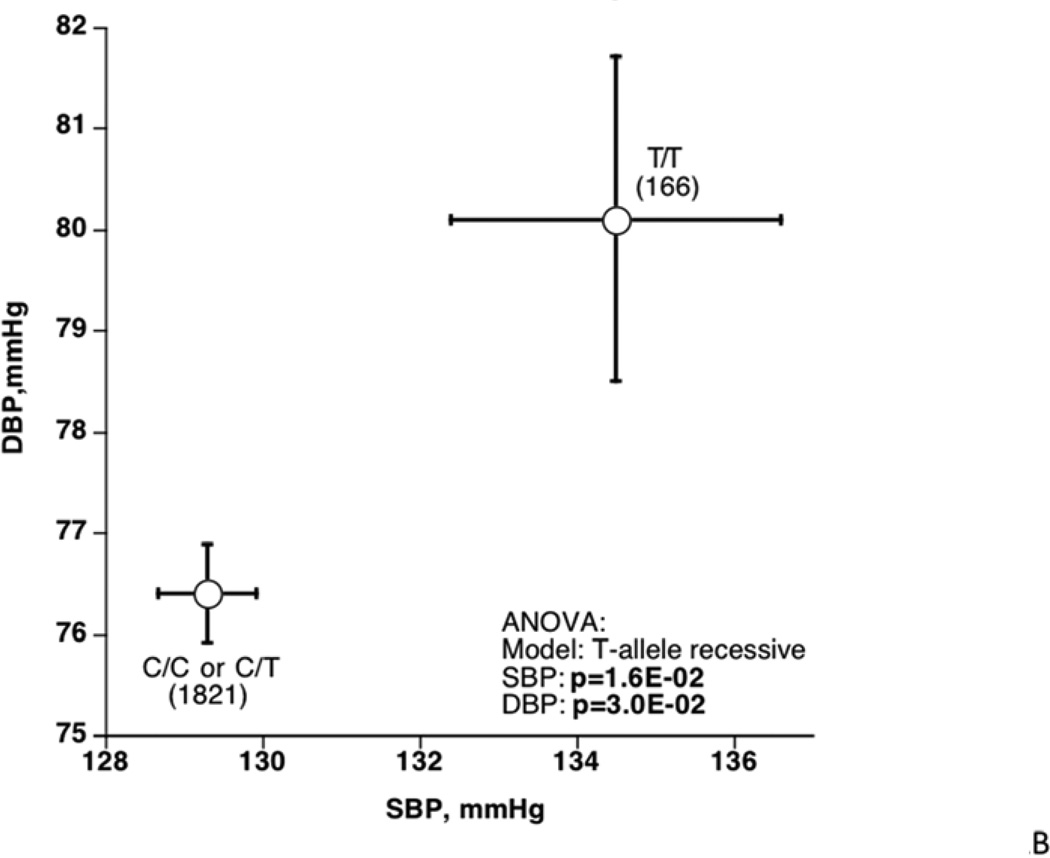
SLC35F3 tag SNP rs17514104 (MAF ~27–28%) was typed in not only the original population extreme BP individual samples, but also in individuals from a second BP extreme sample from the same source population. In these samples, examination of the distribution of diploid genotypes by BP status (highest, lowest; Figure 2A) revealed an over-representation of T/T (minor allele) homozygosity among hypertensives, with a corresponding depletion of C alleles (among C/C minor allele homozygotes or C/T heterozygotes) in the normotensives (p=2.9E-2). When BP is evaluated as a continuous trait (Figure 2B), T/T homozygotes display parallel elevations in both SBP/DBP (p=1.6E-2/p=3.0E-2). Meta-analysis (Table 2) indicated that the genotype effects were directionally consistent in each San Diego population sample, for both SBP/DBP (p=1.9E-2/p=1.9E-2).
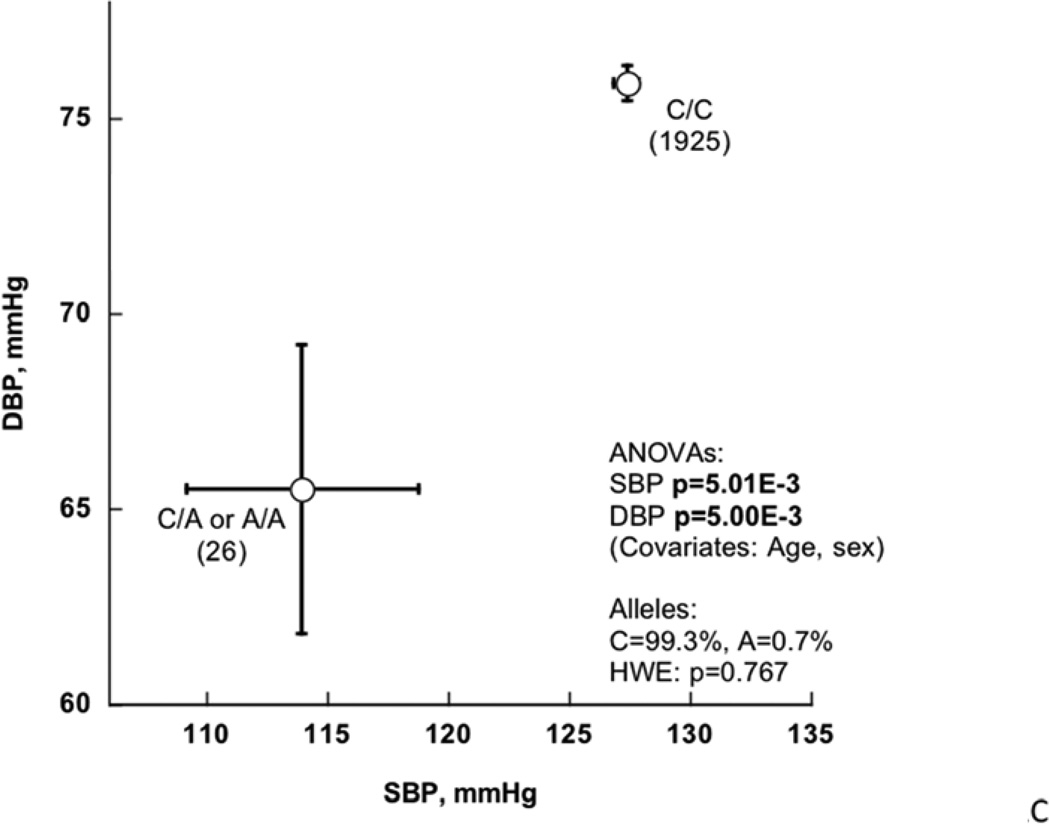
Figure 2. SLC35F3 tagging variants.
Effect on blood pressure in population BP extreme subjects, and replication. Each of the two tagging variants is located within the same LD block in SLC35F3 Intron-2.
A: Effect of rs17514104 on BP status (diagnosis: hypertensive, normotensive) as a dichotomous trait. The statistical test was chi-square.
B: Effect of rs17514104 on SBP and DBP as quantitative traits (mmHg). The statistical test was ANOVA, adjusted for age and sex.
C. Effect of rs16842784 on SBP and DBP as quantitative traits (mmHg). ANOVA was adjusted for sex and age.
Table 2.
Effects of SLC35F3 intronic variant rs17514104 on the quantitative BP traits (SBP and DBP, in mmHg) in two independent population samples: Meta-analysis.
| Group | Alleles Minor/ Major |
Minor allele frequency |
N | Trait (mmHg) |
Model | Beta (slope per allele) |
SE (of beta) |
P-value |
|---|---|---|---|---|---|---|---|---|
| KWE1 | T/C | 27.6% | 922 | SBP | T-recessive | 3.492 | 1.691 | |
| KWE2 | T/C | 27.3% | 1072 | SBP | T-recessive | 1.823 | 1.328 | |
| Meta-result | T/C | 27.5% | 1994 | SBP | T-recessive | 2.460 | 1.044 | 1.90E-02 |
| KWE1 | T/C | 27.6% | 922 | DBP | T-recessive | 1.612 | 1.392 | |
| KWE2 | T/C | 27.3% | 1072 | DBP | T-recessive | 1.979 | 0.964 | |
| Meta-result | T/C | 27.5% | 1994 | DBP | T-recessive | 1.860 | 0.792 | 1.90E-02 |
KWE1: First population BP extreme sample. KWE2: Second population sample. Covariates in these analyses were age and sex, and BP values in the hypertensives were adjusted for medications, as described in the Methods.
Extension of BP association to SLC35F3 in ICBP
The ICBP program allowed replication into an additional population sample of >27,000 adults (in North America or Western Europe); inspection of the trait-associated region of SLC35F3 (by LocusZoom plot; suppl Figure 1) revealed peak BP association in SLC35F3 Intron-2 at rs 16842784, which is 17,474 bp downstream (3’) of previous tag SNP rs17514194 (D’=1.0 in HapMap CEU, suppl Table 2), and within the same LD block, as judged by the cM/Mb tracing. Thus we typed rs1 6842784 (C>A, MAF ~0.7–0.8%) in the original San Diego subjects, and found that the BP associations were significant for SBP/DBP in both ICBP (p=4.18E-4/p=1.64E-4) and the San Diego BP extremes (p=1.10E-2/p=8.00E-3); subsequently meta-analysis documented the replication for both SBP/DBP, at p<1.00E-4/p<1.00E-4 (Table 2).
Figure 2C plots the effect of rs1 6852784 on SBP/DBP in the San Diego BP extreme samples: effects on SBP/DBP were significant at p=5.01E-3/p=5.00E-3, and the effect of the minor/A allele was to decrease SBP/DBP by ~13/~10 mmHg. The proportion of trait variance (R2) explained by rs16852784 in the San Diego population sample on SBP/DBP was 0.063% / 0.096%, highlighting the substantial difference between the effect of a relatively rare (here, MAF ~0.8%) genetic variant on the trait in individuals segregating the allele (Figure 2C), versus the effect in the overall population (R2).
SLC35F3 haplotype and BP: Population BP extreme samples in San Diego
Since SLC35F3 genotype data from both rs16842784 and rs17514104 were available and in LD (D’=1.0; suppl. Table 2), we also examined the effects of rs16842784 (C>A, MAF ~0.8%) → rs17514104 (C>T, MAF ~28%) haplotypes on BP. Haplotypes C→C (~71.9%), A→C (~27.6%), and C→T (~0.5%) were observed, while doubly minor allele haplotype A→T was not observed (0%). By regression on the BP traits, rarest haplotype C→T had strong effects on both SBP (p=0.00103) and DBP (p=0.00031), while haplotype A→C had more modest effects on the traits (SBP p=0.025; DBP p=0.039), and most common haplotype C→C did not influence BP.
Bioinformatic analyses of SLC35F3: Homology to a thiamine transporter
Within the Transporter Classification DataBase (TCDB) international consensus system <http://www.tcdb.org> human SLC35F3 (Uniprot Q8IY50) is a member of the DMT (Drug/Metabolite Transporter; category 2.A.7) superfamily of membrane transporters (SLC35F3 classification in TCDB: 2.A.7.24.8).
Sequence similarity analyses within that TCDB group indicate that the closest homolog with functional data is likely to be transporter 2.A.7.24.1, initially represented by Thi74 of yeast (S. cerevisiae), known as a thiamine-repressible mitochondrial membrane protein (Uniprot Q04083; yeast locus YDR438W), although Q04083 did not possess a classical mitochondrial targeting sequence, when tested at <http://www.cbs.dtu.dk/services/TargetP/>; indeed, Q04083 possesses a hydrophobic amino terminus typical of a signal peptide for the secretory pathway or cell envelope (supplemental Table 2): MNRVGIDVDHMIGVLLLAVVVVFWV. Sequence homologies between the two proteins are tallied in supplemental Table 2, and secondary structure predictions are given in supplementary Figure 2A/2B: each protein is likely to give rise to 10 membrane-spanning (hydrophobic) domains, in a “2+8” configuration, with the most amino-terminal two hydrophobic domains somewhat displaced from the remaining 8 hydrophobic domains by a relatively long hydrophilic intervening sequence (between the first 2 and the final 8 hydrophobic domains).
Thiamine metabolism studies
[3H]-thiamine uptake catalyzed by human SLC35F3 protein expression in E. coli
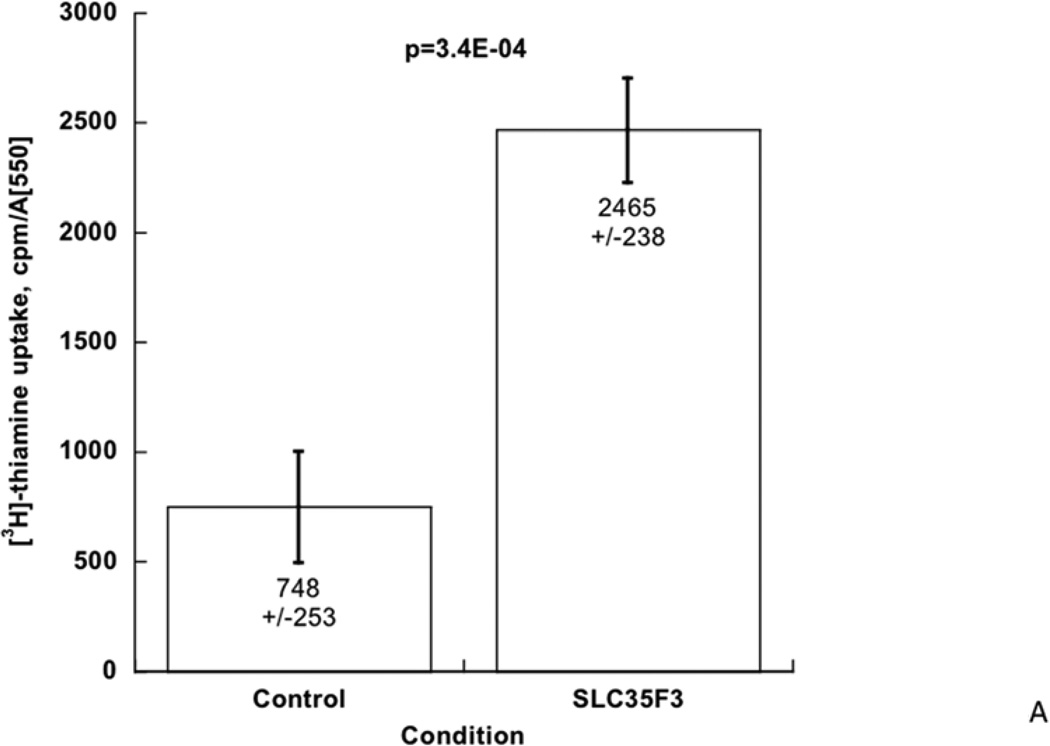
To test whether human SLC35F3 can catalyze thiamine transport, we expressed its cDNA in an E. coli strain (previously disabled for thiamine uptake [ThiBPQ] or synthesis [ThiH]; see Methods), and evaluated cellular uptake of [3H]-thiamine. During SLC35F3 expression, [3H]-thiamine uptake rose substantially, by ~3.3-fold (p=3.4E-04, Figure 3A).
Figure 3. SLC35F3 and thiamine metabolism.
A: Uptake of [3H]-thiamine by expression of human SLC35F3 cDNA in E. coli. Augmentation of [3H]-thiamine uptake was ~3.3-fold in n=7 points (p=3.4E-04). The results were normalized to E.coli growth in the sample (A550).
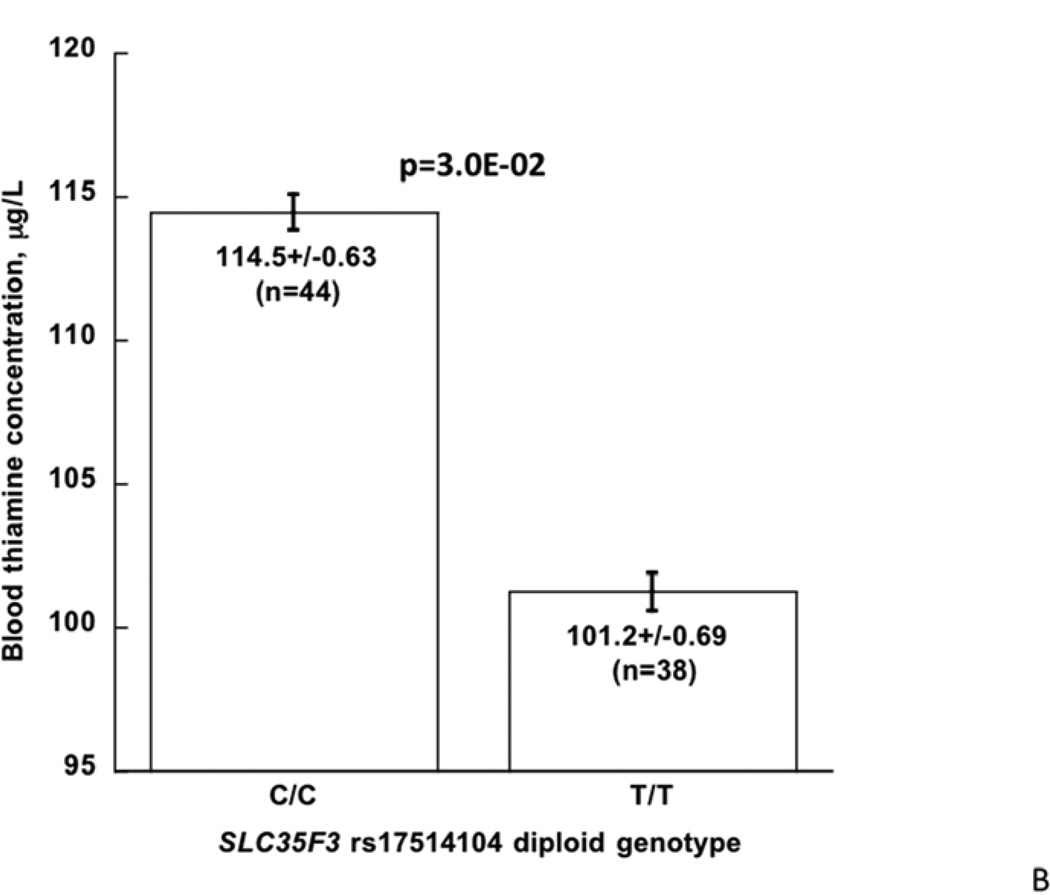
B: SLC35F3 genotype (C/C versus T/T homozygosity at rs17514104): Effect on blood thiamine concentration in twins and siblings.
Thiamine content of human erythrocytes: Stratification by SLC35F3 genotype
We measured thiamine in individuals stratified by previously determined rs17514104 genotype, either major allele (C/C) or minor allele (T/T) homozygotes. Individuals with the T/T (i.e., hypertension-associated) genotype displayed a significant reduction in blood thiamine content, from 114.5±0.63 to 101.2±0.69 µg/L (p=3.0E-02; Figure 3B). Both values were in the range previously reported for healthy subjects.
Heritable cardiac and autonomic effects of human SLC35F3 genetic variation in twin pairs
Subjects with profound thiamine deficiency experience both cardiovascular (“wet beri-beri”) and neurological (“dry beri-beri”) manifestations of the deficiency (35). We therefore examined the influence of SLC35F3 on heritable cardiac and autonomic traits in a series of twin pairs. Trait heritability (h2 = VG/VP, where VG is genetic variance and VP is total phenotypic variance), estimated from twin pair variance components in SOLAR (25), is given in Table 4; each trait displayed substantial heritable determination.
Table 4.
SLC35F3variant rs17514104: Effect on heritable autonomic traits in twins and sibs.
| Category/Trait | Trait heritability (h2) in twin pairs (n=338) |
rs17514104 (C/T) diploid genotype (n=399) |
P- value |
FDR | |||
|---|---|---|---|---|---|---|---|
| Estimate ± SEM |
P-value | C/C (225) | C/T (147) | T/T (36) | |||
| Biochemical | |||||||
| Plasma secretoneurin (SCG2 fragment), nM |
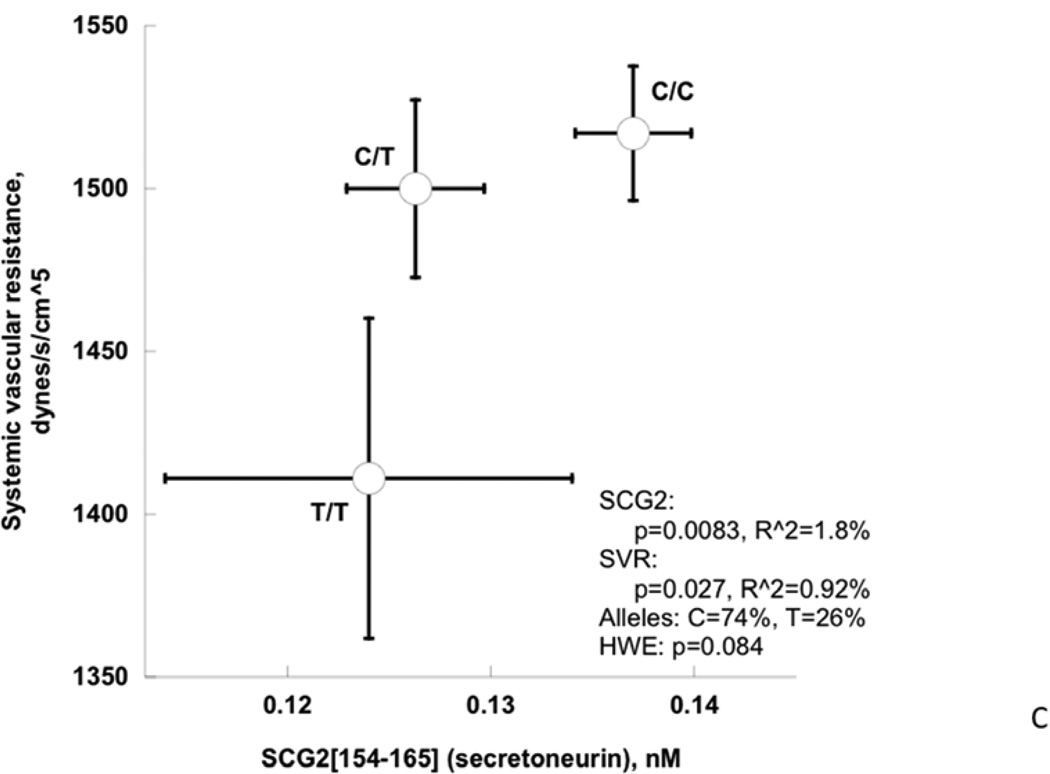
0.73±0.04 | 3.08E-26 | 0.137±0.0029 | 0.126±0.00 34 |
0.124±0.00 65 |
0.0083 | 0.017 |
| Physiological/Hemodynamic (resting) | |||||||
| Heart rate, beats/min | 0.31±0.07 | 3.94E-05 | 71.2±1.44 | 74.6±1.62 | 72.2±2.42 | 0.413 | 0.184 |
| Cardiac index (CI), L/min/m2 | 0.71 ±0.04 | 2.51E-19 | 2.73±0.033 | 2.78±0.041 | 2.86±0.081 | 0.065 | 0.037 |
| Stroke volume index (SVI), mL/min/m2 | 0.66±0.05 | 1.81E-17 | 39.3±0.31 | 39.6±0.35 | 41.1±0.77 | 0.017 | 0.023 |
| Systemic vascular resistance index (SVRI), dynes/s/cm5 /m2 |
0.55±0.06 | 7.70E-12 | 1517±20.7 | 1500±27.3 | 1411±49.1 | 0.027 | 0.027 |
|
Autonomic: Baroreceptor slope msec/mmHg. |
|||||||
| Upward deflections | 0.25±0.08 | 1.91E-03 | 15.1±0.67 | 14.2±0.69 | 14.1±1.06 | 0.730 | 0.265 |
| Downward deflections | 0.37±0.08 | 6.30E-06 | 11.8±0.45 | 11.5±0.50 | 11. 7±0.94 | 0.718 | 0.287 |
| Environmental stress (cold pressor test) | |||||||
| Delta-SBP, mmHg | 0.65±0.05 | 2.60E-16 | 11.0±1.74 | 14.3±2.03 | 18.5±5.57 | 0.053 | 0.035 |
| Delta-DBP, mmHg | 0.54±0.06 | 7.52E-11 | 8.6±1.06 | 11.5±1.24 | 16.6±2.82 | 0.0036 | 0.014 |
| Post-SBP, mmHg | 0.29±0.07 | 1.48E-04 | 128.2±2.4 | 131.2±3.13 | 132.6±6.50 | 0.142 | 0.071 |
| Post-DBP, mmHg | 0.29±0.08 | 1.67E-04 | 72.1±1.42 | 75.5±1.66 | 77.8±3.68 | 0.027 | 0.027 |
Heritability (h2) was estimated from variance components in twins, with SOLAR. Descriptive statistics were computed in twins and sibs, by GEE in SAS. Bold: p<0.05. CI: cardiac index. SVRI: systemic vascular resistance index. SVI: stroke volume index. “Index”: Hemodynamic value (CO or SVR) normalized to body surface area (in m2). “()”: n. FDR: False Discovery Rate. In consideration of testing the effects of multiple correlated alleles (or diploid genotypes) at a locus on a trait, we employed estimation of the FDR, in order to minimize false negative results while maximizing true positive results, using the Excel calculator of FDR from p-values, at <http://www.rowett.ac.uk/~gwh/fdr.html>. Twin and sibling analyses were adjusted for sex and age.
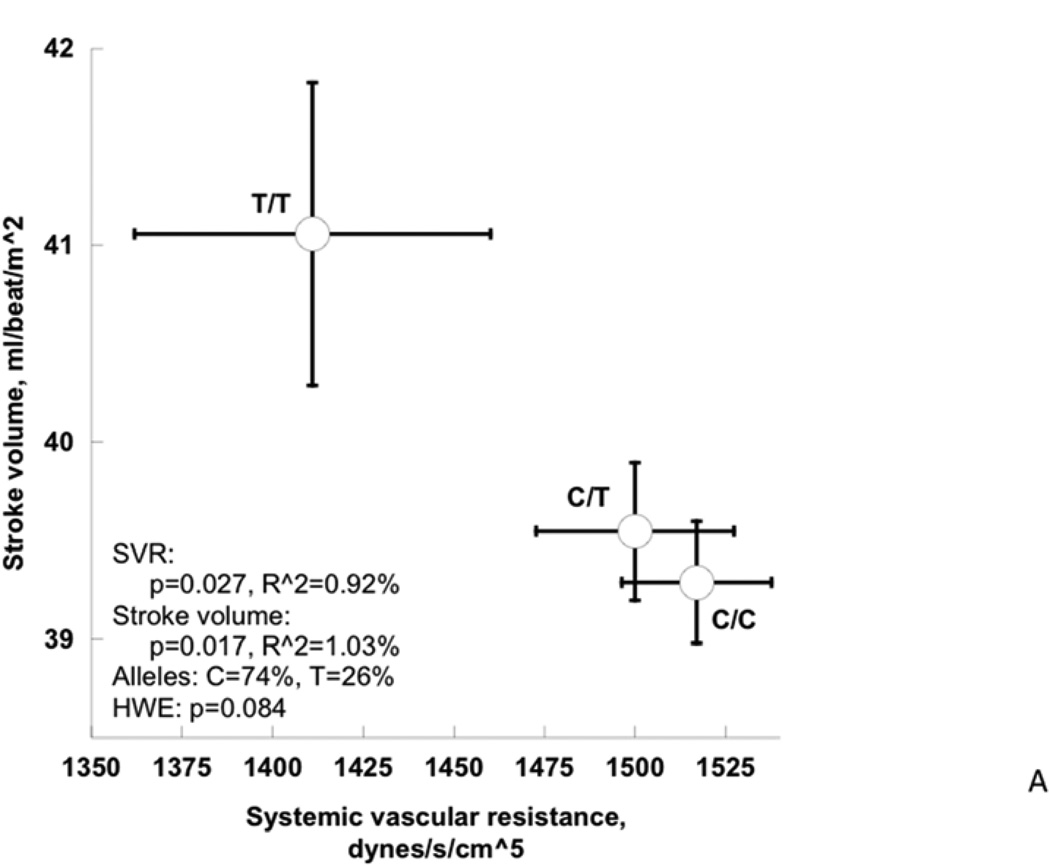
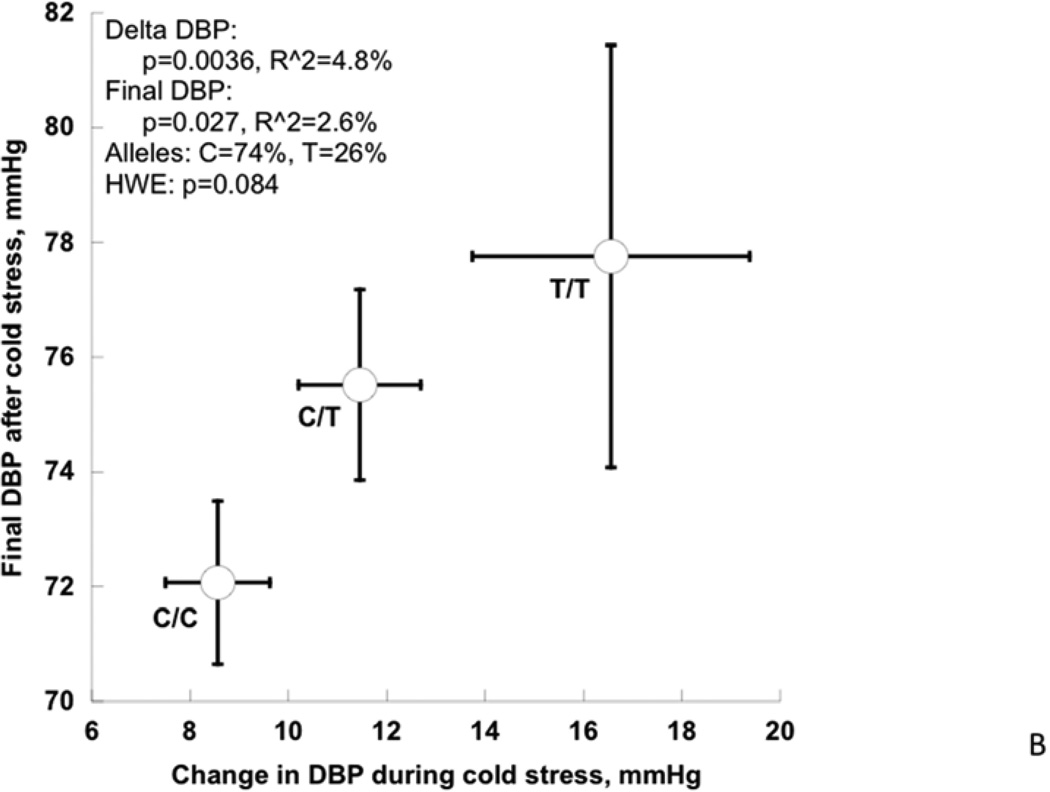
Among cardiac traits (Table 4, Figure 4A), the rs17514104 T-allele conferred an increase in stroke volume index (p=0.017) with a borderline change in cardiac index (p=0.065), and a corresponding fall in systemic vascular resistance index (p=0.027). Among pressor traits (Table 4, Figure 4B), the T-allele conferred an increase in the DBP response to cold stress (p=0.0036) as well as the post-stress/final DBP (p=0.027). Among neuroendocrine biochemical traits (Table 4, Figure 3C), the T-allele conferred a decline in secretoneurin (neuroendocrine secretogranin-II fragment) secretion (p=0.0083). Finally, among autonomic neural traits (Table 4), baroreceptor slope (an integrated afferent/efferent reflex arc) was unchanged. FDR (False Discovery Rate) analysis indicated that significance was preserved after accounting for the multiple phenotype tests. The second (lower minor allele frequency) SLC35F3 SNP, rs16842784, also affected heart rate (p=0.009) and cardiac index (p=0.007).
Figure 4. SLC35F3 and hypertension: Effects on early pathogenic (or “intermediate”) traits in twins and siblings.
Twin and sibling analyses were adjusted for sex and age.
A: SLC35F3 variant rs17514104 effects on systemic vascular resistance and stroke volume in twins and sibling pairs.
B: SLC35F3 variant rs17514104 effects on change in DBP and final DBP during cold stress.
C: SLC35F3 variant rs17514104 effects on sympathochromaffin exocytosis (secretion of SCG2 fragment secretoneurin) and systemic vascular resistance.
Thus, genotype-associated trait changes were primarily cardiac rather than neurological. The relatively young age of this phenotyped twin/sibling cohort (Table 1) should be considered in interpretation of their cardiovascular data.
Physical characteristics of subjects with rs17514104 T/T homoygosity, or altered cardiac and vascular function
We profiled each group we studied (twin pairs; population BP extremes, samples 1&2) to test whether there were readily identifiable demographic or clinical signatures of the underlying genotype. The twins were profiled for cardiac and vascular function; stratification of the twins/siblings by rs17514104 diploid genotype did not reveal differences (all p>0.15 by ANOVA) in: age, sex, BMI, height, or weight. Within the BP-extreme samples, stratification of either cohort-1 (n=934) or cohort-2 (n=1072) by rs17514104 diploid genotype did not reveal any differences (all p>0.05 by ANOVA) in: age, sex, BMI, height, or weight.
Hematological effects of human SLC35F3 genetic variation
Since patients with other thiamine transporter (SLC19A2, SLC19A3) mutations may exhibit megaloblastic anemia, our subjects from the population BP extreme samples (Figure 1) also had determination of the following hematological traits: hemoglobin, hematocrit, MCV (mean corpuscular volume), ferritin, and transferrin saturation. None of these traits was influenced by SLC35F3 rs17514104 genotype (all not significant) in our subjects, perhaps not surprising in that depletions of erythrocyte thiamine in our subjects (p=3.0E-02, Figure 3B) still remained within the typical range of normal.
Allelic Expression Imbalance (AEI; allele specific expression) at SLC35F3
AEI can provide independent evidence that a cis-QTL does exist at a locus, such as SLC35F3 (see Methods).
Human
Two nearby SNP variants (separated by only 501 bp; LD as D’=1.0; suppl Table 2) within the SLC35F3 locus (both in Intron-2) achieved substantial significance in their effects on SLC35F3 transcript abundance in CEU lymphoblastoid cells (supplemental Table 4): rs10910399 (p=4.80E-07, R^2=0.4005, C-allele over-expressed) and rs12029247 (p=5.92E-07, R^2=0.3956, A-allele over-expressed). Thus these 2 SNPs accounted for ~40% of the variance in transcript abundance. The relative positions of these two AEI SNPs are given in suppl Table 2. Notably, these two AEI SNPs were within 78,974 bp of the BP-tagging SNPs, (all 4 in Intron-2 within the same LD block), with LD estimated at D’=0.406. However, neither of these two AEI SNPs predicted either SBP or DBP in the ICBP cohort (p>0.2 in each case).
Rodent (mouse)
AEI was consistently observed at SLC35F3 in F1 strains constructed from inbred mouse strains. 6 F1 strains (all possible pairings) were generated from parental strains A/J (A), C3H/HeJ (C), C57BL/6NJ (B), and DBA/2J (D). We observed strong signals of AEI in four of the six groups of F1 animals: AxB, AxD, HxB, and HxD. The AEI signal was observed from two SNPs (Chr8:128874317 and Chr8:128904545). For F1s AxH and BxD, the SNPs are homozygous preventing our ability to observe AEI. However, for the four of F1s (AxB, AxD, HxB, and HxD) where the SNPs are heterozygous, the ratio of intensities of the two alleles from the RNA hybridization are significantly different from the ratio of intensities of the two alleles from the DNA hybridization (p < 0.0001) providing evidence for AEI at this locus.
DISCUSSION
Overview
Hypertension is perhaps the most common and ultimately lethal of cardiovascular risk factors (1). Complex traits (36) such as hypertension remain largely enigmatic in cause, with evidence for both hereditary and environmental determinants. Twin and family studies suggest substantial heritability (h2) for BP traits, yet the genes responsible for the bulk of BP variance in the population remain elusive (37). While particular (and relatively uncommon) families display Mendelian co-segregation of hypertension with alterations in renal electrolyte transport (5), heritable blood pressure variation in the population remains largely unaccounted for, despite recent successes in genome wide association of large population samples (6).
Here we harnessed the power of trait extremes (38), coupled with a pooled genome wide association strategy (9) to approach genetic determinants of human hypertension. Exploiting the statistical power that is possible with a very large sample size, we selected individuals through a sampling design with the power to detect small contributions to BP variation, ascertaining individuals within the highest and lowest 5th percentiles of BP in a primary care setting in southern California with a large community database (>53,000 subjects) of men and women whose BP was measured at routine health maintenance visits. Genomic DNA pooling is an effective initial strategy that has been successful in detecting genetic associations for amyotrophic lateral sclerosis (39), memory performance (40), progressive supranuclear palsy (41), multiple sclerosis (42), and melanoma (43).
By these strategies, we identified a novel BP association on chromosome 1q42, within the SLC35F3 locus encoding a previously uncharacterized solute transporter with homology to a unspecified thiamine transporter in yeast; we then documented that SLC35F3 can catalyze thiamine (vitamin B1) transport, and that risk allele homozygotes displayed depletion in blood thiamine content. Allelic expression imbalance (AEI) confirmed that cis-variation at the SLC35F3 locus influenced gene expression, and both the clinical marker-on-hypertension effect and the AEI effect resulted from allelic variation in SLC35F3 Intron-2.
Although the involvement of SLC35F3 in hypertension is an emerging proposal, the picture now derives from multiple lines of evidence:
Initial pooled association was found with both Affymetrix and Illumina chips.
Association was verified by individual genotyping in the same population sample with BP extremes.
Association was extended by meta-analysis into an independent BP extreme sample from the same population, as well as a new population.
“Intermediate” (or pathogenic precursor) phenotypes for hypertension, such as cold stress-induced ΔDBP and post-stress DBP observed in the twin and sibling pairs, provide a physiological basis for the SLC35F3 association.
SLC35F3 may encode a novel thiamine transporter, as evidenced by depletion of in vivo blood thiamine stores, and catalysis of in vitro bacterial uptake of [3H]-thiamine.
Role of thiamine transport and SLC35F3 in hypertension risk
We were able to document that SLC35F3 can mediate thiamine transport and that risk allele homozygotes (T/T) have diminished blood thiamine content. Two other high-affinity thiamine transporters are known: SLC19A2 and SLC19A3. Rare Mendelian deficiency of SLC19A2 leads to Thiamine Responsive Megaloblastic Anemia (with diabetes and deafness) (44); however, our SLC35F3 risk allele was not associated with alterations in hemoglobin or mean corpuscular volume. Rare variants at SLC19A3 cause autosomal recessive basal ganglia disease (45). We have not yet characterized the relative affinity or abundance of SLC35F3 in comparison to the better characterized thiamine transporters SLC19A2 and SLC19A3, particularly in relevant cells in brain, heart, and blood vessels.
Since thiamine deficiency can cause a spectrum of phenotypes, from cardiovascular (“wet beri-beri”) to neurological (“dry beri-beri”), we evaluated such traits in a series of twins and siblings, and found that such traits were heritable, and the SLC35F3 risk (T) allele was associated with alterations of cardiac stroke volume and systemic vascular resistance, and pressor responses, although not neural reflex control of the circulation. Thus, the modest thiamine decrement we observed here apparently does have hemodynamic (though not autonomic) consequences, consistent with those seen in “wet beri-beri”.
Thiamine (vitamin B1) replacement or supplementation reportedly corrects abnormalities of both BP and glucose metabolism in the CD36 (fatty acid translocase)-defective SHR (Spontaneously Hypertensive Rat) (38). In this model (38), thiamine repletion not only corrected glucose oxidation, hyperinsulinemia, and elevated BP, but also decreased expression of mRNAs encoding angiotensin converting enzyme (ACE), angiotensin (AGT), and the angiotensin II (type-1) receptor (AGTR1). Also of note for our human cardiovascular and autonomic findings with SLC35F3, dietary depletion of thiamine in the SHR (38) results primarily in cardiovascular signs of “wet beri-beri”, consistent with our cardiac findings in twins and siblings. The SLC35F3 locus also lies within the confidence interval (RNO chr 19; HSA chr 1q42.13-1q42.3) for linkage to SBP at rat BP QTL 32 (Bp32) in recombinant inbred strains from an HXBxBXH cross (46), wherein the hypertensive strain is the SHR.
In humans, thiamine administration reportedly improves endothelium-dependent vasodilation (47); an older report suggests a beneficial effect of thiamine on BP in human hypertension (48), and more recently thiamine lowered SBP in elderly patients with biochemically documented subclinical thiamine deficiency (49), for which diuretic use may be a risk factor (50).
Why might thiamine exert such beneficial effects in hypertension? In addition to potential repair of the “wet beri-beri” lesions noted above, analyses of the transcriptome in rodent genetic models of hypertension reveal widespread changes in mRNAs encoding components of carbohydrate intermediary metabolism (51–53), including the thiamine-dependent transketolase step in the pentose phosphate pathway.
Functional genetic variation at SLC35F3?
What genetic variant(s) at SLC35F3 confers functional change on the gene, either qualitative or quantitative? At the human SLC35F3 locus on chromosome 1q42, common non-synonymous (amino acid replacement) variation has not been detected at SLC35F3 (NCBI dbSNP at <http://www.ncbi.nlm.nih.gov/SNP/snp_ref.cgi?locusId=148641)>, despite extensive exome sequencing of 2n=4504 chromosomes as part of the NHLBI Exome Sequencing Project <https://esp.gs.washington.edu/drupal/>, as well as sequencing across the entire region in 2n=358 chromosomes within the 1000 Genomes Project <http://www.ncbi.nlm.nih.gov/SNP/snp_viewTable.cgi?h=1000GENOMES>. Thus, the precise genetic variant(s) underlying the thiamine and BP traits in this report remains elusive, but is therefore likely to be non-coding (and perhaps regulatory). Notably, both the BP-associated SNPs (rs16842784, rs17514104) and the SNPs displaying AEI for transcript abundance (rs10910399, rs12029247; suppl Table 2) are contained within a 78,974 bp stretch within Intron-2 (suppl Table 2), and each is in LD with the others (minimum D’=0.406). Thus, a relatively circumscribed region of SLC35F3 seems to harbor alleles contribution to variance in both BP and transcript abundance.
The peak genetic association within SLC35F3 Intron-2 suggests the possibility of splice variation as a possible genetic culprit; indeed, based on transcript and EST, splice variation in this region of SLC35F3 does indeed occur, resulting in alternative retention/exclusion of RefSeq (NM_173508) Exons 1, 2 or 3 (NC_000001_4176 at <http://ccg.vital-it.ch/tromer/>).
A micro-RNA gene encoding hsa-miR-4671 is embedded within Intron-3 of SLC35F3; however, the downstream targets of hsa-miR-4671 are not yet defined, and thus we did not pursue this micro-RNA in light of our positive findings for thiamine transport and storage.
The relative abundance of SLC35F3 expression across human tissues has been reported (54): SLC35F3 is widely expressed across tissues pertinent to BP control, such as brain (maximal in cerebellum), adipocytes, heart, kidney, and smooth muscle. In the mouse transcriptome, SLC35F3 is most highly expressed in the CNS <GeneAtlas_MOE430>: ciliary bodies > retinal pigment epithelium > iris > dorsal striatum > nucleus accumbens > spinal cord <http://biogps.org>.
Advantages and limitations for this study
Strengths
This study began with a genome-wide approach in subjects with the most extreme BP values in the population, an approach that has enhanced power to detect genetic marker-on-trait association, even when the genotype contributes only modestly to total trait variation (38). Evidence for involvement of the SLC35F3 gene in hypertension then emerged from multiple lines of evidence: clinical, genetic, and biochemical.
Caveats
However, our studies on SLC35F3 in hypertension and autonomic physiology were conducted in subjects of limited diversity in biogeographic ancestry; studies of additional ethnic or population groups would be required to evaluate whether these SLC35F3 results are of more general importance across the overall population. Caution should be exercised in interpreting the results of pooled genetic association studies; however, we then undertook individual genotyping, based on preliminary pooling results, in order to apply appropriate statistical tests to our results. “Intermediate” cardiovascular traits, such as cardiac output, were studied in a relatively young cohort of twins and siblings (Table 1), on average ~18 years younger than the population BP extreme sample and ~10 years younger than the ICBP; since the relative contribution of elevated cardiac out put to hypertension declines with advancing age, additional cardiovascular (output and resistance) data in older subjects would be useful. Despite initial findings that SLC35F3 is involved in thiamine transport, we do not yet understand the details of such action, including the affinity, capacity, and selectivity of SLC35F3 for its thiamine substrate; nor have we examined the effect of thiamine replacement upon BP or its precursor traits, though previous work in experimental animals (38) and humans (48) suggests a beneficial effect.
Conclusions and perspectives
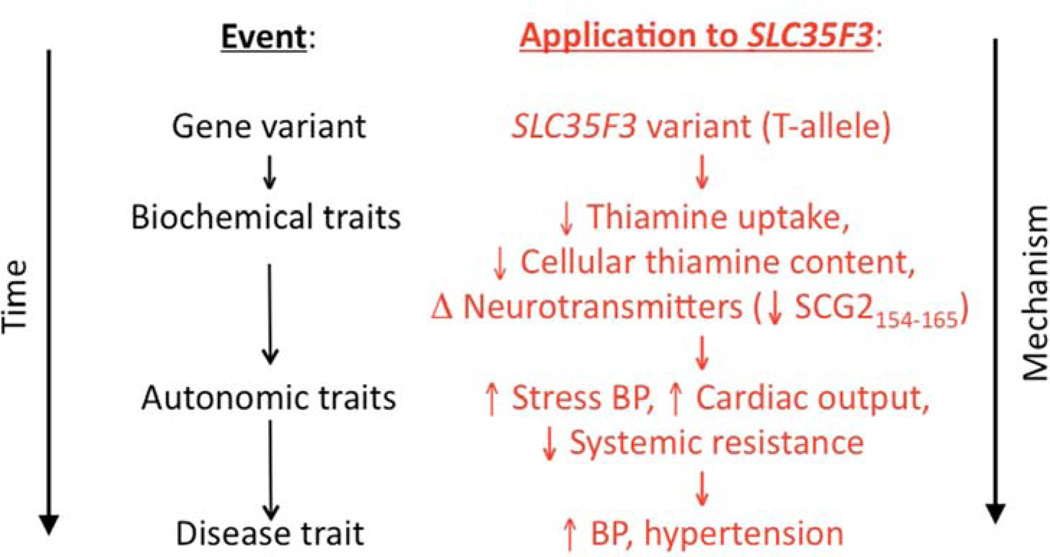
We coupled two novel strategies, quantitative trait extreme sampling and pooled genome-wide association, to discover a new hypertension susceptibility locus, uncovering a previously unsuspected thiamine transporter whose genetic variants predicted several disturbances in cardiac and autonomic function. Figure 5 integrates our findings into an overall hypothetical schema. The results have implications for the heritability of the BP trait and the pathogenesis systemic hypertension, and open up new approaches to the rational prevention or treatment of the trait.
Figure 5. SLC35F3 genetic variation.
Hypothetical schema for the consequences of SLC35F3 polymorphism for thiamine regulation and cardiovascular disease.
Supplementary Material
Table 3.
SBP/DBP determination by SLC35F3 tagging variant rs16842784: Replication by meta-analysis across two independent study groups.
| Group | Alleles, Minor/M ajor |
Minor allele frequency |
n | Trait (mmHg) |
Model | Beta (slope per allele) |
SE (of Beta) |
P-value |
|---|---|---|---|---|---|---|---|---|
| ICBP- | ||||||||
| GWAS | A/C | 0.8% | 27865 | SBP | Additive | −4.986 | 1.413 | 4.18E-04 |
| KWE1+2 | A/C | 0.7% | 1951 | SBP | Additive | −7.092 | 3.140 | 1.10E-02 |
| Overall | A/C | 0.8% | 29816 | SBP | Additive | −5.341 | 1.289 | <1.00E-04 |
| ICBP- | ||||||||
| GWAS | A/C | 0.8% | 29452 | DBP | Additive | −3.340 | 0.886 | 1.64E-04 |
| KWE1+2 | A/C | 0.7% | 1944 | DBP | Additive | −5.394 | 2.359 | 8.00E-03 |
| Overall | A/C | 0.8% | 31396 | DBP | Additive | −3.594 | 0.829 | <1.00E-04 |
Covariates in these analyses were age, sex, and BMI, and BP values in the hypertensives were adjusted for medications, as described in the Methods. ICBP: International Collaboration for Blood Pressure/Genome Wide Association Studies.
Acknowledgments
Support/funding: National Institutes of Health [DK094894; HL58120; UL1RR031980 (UCSD Clinical and Translational Research Institute); MD000220 (UCSD Comprehensive Research Center in Health Disparities, CRCHD)], Department of Veterans Affairs.
ABBREVIATIONS
- DZ
Dizygotic (fraternal twin)
- FDR
False Discovery Rate
- GWAS
Genome-Wide Association Study
- ICBP
International Consortium for Blood Pressure Genome-Wide Association Studies
- HWE
Hardy-Weinberg Equilibrium
- LD
Linkage Disequilibrium
- MAF
Minor Allele Frequency
- MZ
Monozygotic (identical twin)
- TCDB
Transporter Classification DataBase
Footnotes
Publisher's Disclaimer: This is a PDF file of an unedited manuscript that has been accepted for publication. As a service to our customers we are providing this early version of the manuscript. The manuscript will undergo copyediting, typesetting, and review of the resulting proof before it is published in its final citable form. Please note that during the production process errors may be discovered which could affect the content, and all legal disclaimers that apply to the journal pertain.
Conflicts of interest: None to disclose.
REFERENCES
- 1.D'Agostino RB, Vasan RS, Pencina MJ, et al. General cardiovascular risk profile for use in primary care: the Framingham Heart Study. Circulation. 2008;117:743–753. doi: 10.1161/CIRCULATIONAHA.107.699579. [DOI] [PubMed] [Google Scholar]
- 2.Kanavos Panos JO, Michael A. A global assessment of current efforts to control high blood pressure and an analysis of future options to prevent a silent epidemic affecting hundreds of millions worldwide. New York: 2007. Weber, editor High blood pressure and health policy. Where we are and where we need to go next. [Google Scholar]
- 3.Kupper N, Ge D, Treiber FA, Snieder H. Emergence of novel genetic effects on blood pressure and hemodynamics in adolescence: the Georgia Cardiovascular Twin Study. Hypertension. 2006;47:948–954. doi: 10.1161/01.HYP.0000217521.79447.9a. [DOI] [PubMed] [Google Scholar]
- 4.Manolio TA, Collins FS, Cox NJ, et al. Finding the missing heritability of complex diseases. Nature. 2009;461:747–753. doi: 10.1038/nature08494. [DOI] [PMC free article] [PubMed] [Google Scholar]
- 5.Lifton RP, Gharavi AG, Geller DS. Molecular mechanisms of human hypertension. Cell. 2001;104:545–556. doi: 10.1016/s0092-8674(01)00241-0. [DOI] [PubMed] [Google Scholar]
- 6.Ehret GB, Munroe PB, Rice KM, et al. Genetic variants in novel pathways influence blood pressure and cardiovascular disease risk. Nature. 2011;478:103–109. doi: 10.1038/nature10405. [DOI] [PMC free article] [PubMed] [Google Scholar]
- 7.Risch N, Merikangas K. The future of genetic studies of complex human diseases. Science. 1996;273:1516–1517. doi: 10.1126/science.273.5281.1516. [DOI] [PubMed] [Google Scholar]
- 8.Ehret GB, Morrison AC, O'Connor AA, et al. Replication of the Wellcome Trust genome-wide association study of essential hypertension: the Family Blood Pressure Program. Eur J Hum Genet. 2008;16:1507–1511. doi: 10.1038/ejhg.2008.102. [DOI] [PMC free article] [PubMed] [Google Scholar]
- 9.Rana BK, Insel PA, Payne SH, et al. Population-based sample reveals gene-gender interactions in blood pressure in White Americans. Hypertension. 2007;49:96–106. doi: 10.1161/01.HYP.0000252029.35106.67. [DOI] [PubMed] [Google Scholar]
- 10.Pearson JV, Huentelman MJ, Halperin RF, et al. Identification of the genetic basis for complex disorders by use of pooling-based genomewide single-nucleotide-polymorphism association studies. Am J Hum Genet. 2007;80:126–139. doi: 10.1086/510686. [DOI] [PMC free article] [PubMed] [Google Scholar]
- 11.Schork NJ, Nath SK, Fallin D, Chakravarti A. Linkage disequilibrium analysis of biallelic DNA markers, human quantitative trait loci, and threshold-defined case and control subjects. Am J Hum Genet. 2000;67:1208–1218. doi: 10.1086/321201. [DOI] [PMC free article] [PubMed] [Google Scholar]
- 12.Evans A, Van Baal GC, McCarron P, et al. The genetics of coronary heart disease: the contribution of twin studies. Twin Res. 2003;6:432–441. doi: 10.1375/136905203770326439. [DOI] [PubMed] [Google Scholar]
- 13.Kupper N, Willemsen G, Riese H, Posthuma D, Boomsma DI, de Geus EJ. Heritability of daytime ambulatory blood pressure in an extended twin design. Hypertension. 2005;45:80–85. doi: 10.1161/01.HYP.0000149952.84391.54. [DOI] [PubMed] [Google Scholar]
- 14.Snieder H, Harshfield GA, Treiber FA. Heritability of blood pressure and hemodynamics in African- and European-American youth. Hypertension. 2003;41:1196–1201. doi: 10.1161/01.HYP.0000072269.19820.0D. [DOI] [PubMed] [Google Scholar]
- 15.Tenesa A, Visscher PM, Carothers AD, Knott SA. Mapping quantitative trait loci using linkage disequilibrium: marker- versus trait-based methods. Behav Genet. 2005;35:219–228. doi: 10.1007/s10519-004-0811-5. [DOI] [PubMed] [Google Scholar]
- 16.Rao F, Zhang L, Wessel J, et al. Tyrosine hydroxylase, the rate-limiting enzyme in catecholamine biosynthesis: discovery of common human genetic variants governing transcription, autonomic activity, and blood pressure in vivo. Circulation. 2007;116:993–1006. doi: 10.1161/CIRCULATIONAHA.106.682302. [DOI] [PubMed] [Google Scholar]
- 17.Seasholtz TM, Wessel J, Rao F, et al. Rho kinase polymorphism influences blood pressure and systemic vascular resistance in human twins: role of heredity. Hypertension. 2006;47:937–947. doi: 10.1161/01.HYP.0000217364.45622.f0. [DOI] [PubMed] [Google Scholar]
- 18.Chio SS, Tsai JJ, Hsu YM, et al. Development and validation of a noninvasive method to estimate cardiac output using cuff sphygmomanometry. Clin Cardiol. 2007;30:615–620. doi: 10.1002/clc.20164. [DOI] [PMC free article] [PubMed] [Google Scholar]
- 19.O'Connor DT, Kailasam MT, Kennedy BP, Ziegler MG, Yanaihara N, Parmer RJ. Early decline in the catecholamine release-inhibitory peptide catestatin in humans at genetic risk of hypertension. J Hypertens. 2002;20:1335–1345. doi: 10.1097/00004872-200207000-00020. [DOI] [PubMed] [Google Scholar]
- 20.Rao F, Wen G, Gayen JR, et al. Catecholamine release-inhibitory peptide catestatin (chromogranin A(352–372)): naturally occurring amino acid variant Gly364Ser causes profound changes in human autonomic activity and alters risk for hypertension. Circulation. 2007;115:2271–2281. doi: 10.1161/CIRCULATIONAHA.106.628859. [DOI] [PubMed] [Google Scholar]
- 21.Wang L, Rao F, Zhang K, et al. Neuropeptide Y(1) Receptor NPY1R discovery of naturally occurring human genetic variants governing gene expression in cella as well as pleiotropic effects on autonomic activity and blood pressure in vivo. J Am Coll Cardiol. 2009;54:944–954. doi: 10.1016/j.jacc.2009.05.035. [DOI] [PMC free article] [PubMed] [Google Scholar]
- 22.Stridsberg M, Eriksson B, Janson ET. Measurements of secretogranins II, III, V and proconvertases 1/3 and 2 in plasma from patients with neuroendocrine tumours. Regul Pept. 2008;148:95–98. doi: 10.1016/j.regpep.2008.03.007. [DOI] [PubMed] [Google Scholar]
- 23.Cui JS, Hopper JL, Harrap SB. Antihypertensive treatments obscure familial contributions to blood pressure variation. Hypertension. 2003;41:207–210. doi: 10.1161/01.hyp.0000044938.94050.e3. [DOI] [PubMed] [Google Scholar]
- 24.Do KA, Broom BM, Kuhnert P, et al. Genetic analysis of the age at menopause by using estimating equations and Bayesian random effects models. Stat Med. 2000;19:1217–1235. doi: 10.1002/(sici)1097-0258(20000515)19:9<1217::aid-sim421>3.0.co;2-q. [DOI] [PubMed] [Google Scholar]
- 25.Almasy L, Blangero J. Multipoint quantitative-trait linkage analysis in general pedigrees. Am J Hum Genet. 1998;62:1198–1211. doi: 10.1086/301844. [DOI] [PMC free article] [PubMed] [Google Scholar]
- 26.Florea L, Hartzell G, Zhang Z, Rubin GM, Miller W. A computer program for aligning a cDNA sequence with a genomic DNA sequence. Genome research. 1998;8:967–974. doi: 10.1101/gr.8.9.967. [DOI] [PMC free article] [PubMed] [Google Scholar]
- 27.Lutz R, Bujard H. Independent and tight regulation of transcriptional units in Escherichia coli via the LacR/O, the TetR/O and AraC/I1-I2 regulatory elements. Nucleic Acids Res. 1997;25:1203–1210. doi: 10.1093/nar/25.6.1203. [DOI] [PMC free article] [PubMed] [Google Scholar]
- 28.Zhang Z, Feige JN, Chang AB, et al. A transporter of Escherichia coli specific for L- and D-methionine is the prototype for a new family within the ABC superfamily. Arch Microbiol. 2003;180:88–100. doi: 10.1007/s00203-003-0561-4. [DOI] [PubMed] [Google Scholar]
- 29.Jones A, Finch M. Plate assay of thiamine. I. Using Kloeckera brevis. Appl Microbiol. 1959;7:309–311. doi: 10.1128/am.7.5.309-311.1959. [DOI] [PMC free article] [PubMed] [Google Scholar]
- 30.Hughes BJ, Jones A. Plate assay of thiamine. II. Using Lactobacillus fermenti. Appl Microbiol. 1959;7:311–314. doi: 10.1128/am.7.5.311-314.1959. [DOI] [PMC free article] [PubMed] [Google Scholar]
- 31.Pastinen T. Genome-wide allele-specific analysis: insights into regulatory variation. Nat Rev Genet. 2010;11:533–538. doi: 10.1038/nrg2815. [DOI] [PubMed] [Google Scholar]
- 32.Ge B, Pokholok DK, Kwan T, et al. Global patterns of cis variation in human cells revealed by high-density allelic expression analysis. Nat Genet. 2009;41:1216–1222. doi: 10.1038/ng.473. [DOI] [PubMed] [Google Scholar]
- 33.Grundberg E, Adoue V, Kwan T, et al. Global analysis of the impact of environmental perturbation on cis-regulation of gene expression. PLoS Genet. 2011;7:e1001279. doi: 10.1371/journal.pgen.1001279. [DOI] [PMC free article] [PubMed] [Google Scholar]
- 34.Yang H, Ding Y, Hutchins LN, et al. A customized and versatile high-density genotyping array for the mouse. Nat Methods. 2009;6:663–666. doi: 10.1038/nmeth.1359. [DOI] [PMC free article] [PubMed] [Google Scholar]
- 35.Butterworth R. Thiamin. In: Shils MESM, Ross AC, Caballero B, Cousins RJ, editors. Modern Nutrition in Health and Disease. 10th ed. Baltimore: Lippincott Williams & Wilkins; 2006. [Google Scholar]
- 36.Lander ES, Schork NJ. Genetic dissection of complex traits. Science. 1994;265:2037–2048. doi: 10.1126/science.8091226. [DOI] [PubMed] [Google Scholar]
- 37.Zhang K, Weder AB, Eskin E, O'Connor DT. Genome-wide case/control studies in hypertension: only the 'tip of the iceberg'. J Hypertens. 2010;28:1115–1123. doi: 10.1097/HJH.0b013e328337f6bc. [DOI] [PMC free article] [PubMed] [Google Scholar]
- 38.Tanaka T, Sohmiya K, Kono T, et al. Thiamine attenuates the hypertension and metabolic abnormalities in CD36-defective SHR: uncoupling of glucose oxidation from cellular entry accompanied with enhanced protein O-GlcNAcylation in CD36 deficiency. Mol Cell Biochem. 2007;299:23–35. doi: 10.1007/s11010-005-9032-3. [DOI] [PubMed] [Google Scholar]
- 39.Dunckley T, Huentelman MJ, Craig DW, et al. Whole-genome analysis of sporadic amyotrophic lateral sclerosis. N Engl J Med. 2007;357:775–788. doi: 10.1056/NEJMoa070174. [DOI] [PubMed] [Google Scholar]
- 40.Papassotiropoulos A, Stephan DA, Huentelman MJ, et al. Common Kibra alleles are associated with human memory performance. Science. 2006;314:475–478. doi: 10.1126/science.1129837. [DOI] [PubMed] [Google Scholar]
- 41.Melquist S, Craig DW, Huentelman MJ, et al. Identification of a novel risk locus for progressive supranuclear palsy by a pooled genomewide scan of 500,288 single-nucleotide polymorphisms. Am J Hum Genet. 2007;80:769–778. doi: 10.1086/513320. [DOI] [PMC free article] [PubMed] [Google Scholar]
- 42.Comabella M, Craig DW, Camina-Tato M, et al. Identification of a novel risk locus for multiple sclerosis at 13q31.3 by a pooled genome-wide scan of 500,000 single nucleotide polymorphisms. PLoS One. 2008;3:e3490. doi: 10.1371/journal.pone.0003490. [DOI] [PMC free article] [PubMed] [Google Scholar]
- 43.Brown KM, Macgregor S, Montgomery GW, et al. Common sequence variants on 20q11.22 confer melanoma susceptibility. Nat Genet. 2008;40:838–840. doi: 10.1038/ng.163. [DOI] [PMC free article] [PubMed] [Google Scholar]
- 44.Labay V, Raz T, Baron D, et al. Mutations in SLC19A2 cause thiamine-responsive megaloblastic anaemia associated with diabetes mellitus and deafness. Nat Genet. 1999;22:300–304. doi: 10.1038/10372. [DOI] [PubMed] [Google Scholar]
- 45.Debs R, Depienne C, Rastetter A, et al. Biotin-responsive basal ganglia disease in ethnic Europeans with novel SLC19A3 mutations. Archives of neurology. 2010;67:126–130. doi: 10.1001/archneurol.2009.293. [DOI] [PubMed] [Google Scholar]
- 46.Pravenec M, Gauguier D, Schott JJ, et al. Mapping of quantitative trait loci for blood pressure and cardiac mass in the rat by genome scanning of recombinant inbred strains. J Clin Invest. 1995;96:1973–1978. doi: 10.1172/JCI118244. [DOI] [PMC free article] [PubMed] [Google Scholar]
- 47.Arora S, Lidor A, Abularrage CJ, et al. Thiamine (vitamin B1) improves endothelium-dependent vasodilatation in the presence of hyperglycemia. Ann Vasc Surg. 2006;20:653–658. doi: 10.1007/s10016-006-9055-6. [DOI] [PubMed] [Google Scholar]
- 48.Romanova EV, Gaevyi MD. [Effect of thiamine bromide on cerebral circulation and arterial pressure (an experimental and clinical study)] Farmakol Toksikol. 1976;39:173–176. [PubMed] [Google Scholar]
- 49.Wilkinson TJ, Hanger HC, Elmslie J, George PM, Sainsbury R. The response to treatment of subclinical thiamine deficiency in the elderly. Am J Clin Nutr. 1997;66:925–928. doi: 10.1093/ajcn/66.4.925. [DOI] [PubMed] [Google Scholar]
- 50.Suter PM, Haller J, Hany A, Vetter W. Diuretic use: a risk for subclinical thiamine deficiency in elderly patients. J Nutr Health Aging. 2000;4:69–71. [PubMed] [Google Scholar]
- 51.Fries RS, Mahboubi P, Mahapatra NR, et al. Neuroendocrine transcriptome in genetic hypertension: multiple changes in diverse adrenal physiological systems. Hypertension. 2004;43:1301–1311. doi: 10.1161/01.HYP.0000127708.96195.E6. [DOI] [PubMed] [Google Scholar]
- 52.Friese RS, Gayen JR, Mahapatra NR, Schmid-Schonbein GW, O'Connor DT, Mahata SK. Global metabolic consequences of the chromogranin A-null model of hypertension: transcriptomic detection, pathway identification, and experimental verification. Physiological genomics. 2010;40:195–207. doi: 10.1152/physiolgenomics.00164.2009. [DOI] [PMC free article] [PubMed] [Google Scholar]
- 53.Friese RS, Ye C, Nievergelt CM, et al. Integrated computational and experimental analysis of the neuroendocrine transcriptome in genetic hypertension identifies novel control points for the cardiometabolic syndrome. Circ Cardiovasc Genet. 2012;5:430–440. doi: 10.1161/CIRCGENETICS.111.962415. [DOI] [PMC free article] [PubMed] [Google Scholar]
- 54.Nishimura M, Suzuki S, Satoh T, Naito S. Tissue-specific mRNA expression profiles of human solute carrier 35 transporters. Drug metabolism and pharmacokinetics. 2009;24:91–99. doi: 10.2133/dmpk.24.91. [DOI] [PubMed] [Google Scholar]
Associated Data
This section collects any data citations, data availability statements, or supplementary materials included in this article.


