

Abstract
Herein, we report fifty four membered, a new set of novel NIR Raman reporters and CyRLA-572 has been selected to be the best among them considering the signal intensity and stability. This new reporter molecule is an excellent partner with our in house Raman reporters (Cy7LA and Cy7.5LA). These three NIR Raman reporters are adsorbed on the gold nanoparticles to obtain their corresponding unique SERS fingerprints in which three individual characteristic peaks are capable to multiplex among them. These multiplexed Raman reporters are applied to develop biocompatible and specific targeting SERS nanotags after tagging with specific antibodies. These multiplex targeted SERS nanotags are applied to detect three targeting receptors in differentiated mouse embryonic stem cells (mESCs) consisting three germ layers such as ectoderm, mesoderm and endoderm. After successful recognition of cells by SERS techniques, we detect simultaneously three germ layers in teratoma which is a monster tumor formed from mESC cells in animal xenograft model.
Keywords: Gold nanoparticles, multiplexing, teratoma, biocompatible, nanotags, in vivo, SERS, cell mapping, differentiated germ layers, mesoderm, endoderm, ectoderm
Introduction
Embryonic stem cells (ESCs) have the capability to differentiate into cell types consisting three embryonic germ layers [1]. This type of phenomenon of ESCs may potentially help in tissue engineering and cell replacement therapy for many diseases such as Parkinson’s disease [2], diabetes [3] and heart disease [4]. However, one major difficulty in the clinical application of ESCs is the potential threat of teratoma formation [5]. A teratoma is a monster tumor that consists of tissue from all three germ layers which are ectoderm, mesoderm, and endoderm. Due to the tumorigenicity of embryonic stem cells, tracking them in vivo is one of the vital steps in future clinical applications [6]. Therefore, there is an unmet need for a high sensitive method to be implemented in this purpose.
In the recent times, nanoprobes that produce signal from surface enhanced Raman scattering (SERS) have been the focus of profound study [7]. Typically these probes are based on colloidal metallic nanoparticle (NP) cores with adsorbed reporter dyes into the surface which engender characteristic SERS spectrum. By changing the adsorbed dye, various sets of NPs are obtained and, as their Raman peak widths are usually <5 nm FWHM (Full width at half maxima), potentiality in multiplex use significantly exceeds that of any other present imaging technique [8-10]. Consequently, benefits of SERS labels over existing labeling methods comprise the great spectral multiplexing capacity for simultaneous target detection owing to the sharp width of vibrational Raman bands; quantification with the help of fingerprint intensity of the analogous SERS label; the requirement for only a single laser source having single excitation wavelength to excite the Raman spectra of all SERS labels; high photostability and optimal contrast by using red to near-infrared (NIR) excitation in order to minimize the disturbing auto fluorescence of cells and tissues [11]. Because of these above advantages, to date, in vitro multiplexing of cell lines detection using SERS nanotags has been studied by different research groups [12,13]. Our research group also recently demonstrated the multiplex targeted in vivo tumor detection by applying biocompatible NIR SERS nanotags [14]. In that study, a single targeting receptor in tumor has been recognized by varying three different nanotags which were functionalized either by positive or negative antibody. However, to the best of our knowledge there is no study to identify multiple targets simultaneously in in vivo by applying multiple nanotags that can multiplex. Herein, first time, we aimed to detect three simultaneous targets in teratoma, both in vitro and in vivo by applying three multiplexing targeted SERS nanotags. To achieve this goal, firstly we develop a novel highly sensitive NIR Raman reporter CyRLA-572 which shows distinct multiplexing capability with previously developed Raman Reporter-set (Cy7LA and Cy7.5LA) for deep tissue excitation and its application to construct SERS nanotags for the active multiplex targeted in vivo teratoma detection in a live mouse.
Materials and methods
Surface plasmon absorption spectra were measured on a SpectraMax M2 spectrophotometer (Molecular Devices), and the data analysis were performed using Microsoft excel 2007, Origin 8. SERS measurements were carried out in a Renishaw InVia Raman (UK) microscope with a laser beam directed to the sample through 50 × and 20 × objective lens and a Peltier cooled CCD detector in Singapore Bioimaging Consortium, Agency for Science, Technology and Research (A*STAR), Singapore. Samples were excited with a 785 nm excitation wavelength laser and Stokes shifted Raman spectra were collected in the range of 400 to 2000 cm-1 with 1 cm-1 resolution. Prior to every measurement, a calibration with a silicon standard (Raman peak centered at 520 cm-1) was performed. WiRE 3.0 software package was used for data acquisition. Citrate capped colloidal gold nanoparticles (60 nm diameter) were purchased from BBI.
Synthesis of lipoic acid nitrophenol resin
Aminomethyl nitrophenol polystyrene resin was prepared according to reported procedures. The nitrophenol resin (2 g, 2.9 mmol, 1 eq.) was swollen in 10 mL of Dimethylformamide (DMF), and lipoic acid (2 g, 10 mmol, 3.3 eq.), N,N’-diisopropylcarbodiimide (DIC; 1.2 mL, 12 mmol, 4 eq.) and a catalytic amount of 4-Dimethylaminopyridine (DMAP; 20 mg) were added to the resin, which was continuously shaken for 24 h at r.t. Subsequently, the resin was washed with dichloromethane (DCM; 10 × 25 mL) and dried under vacuum until use.
General procedure for the synthesis of the CyRLA library
To synthesized CyRLA library, each of 1 μmol CyR library compound (80 compounds) was taken according to their plate code in the 2 mL of 96-deep well plate. About 30 mg (~20 μmol, 20 eq.) of active-ester resin was added to the each well of the CyR library containing plate. Then, DCM: ACN (acetonitrile) (7:1) solvent mixture of around 500 μL and catalytic amount of saturated solution of sodium bicarbonate (NaHCO3) were poured in to each well. The plate was kept in the shaker with moderate shaking for 6 hours. Then, the solution was filtered from the resin and dried to obtain pure products.
High throughput SERS screening
A freshly prepared solution (20 μM, 10 μL) of 54 Raman reporters were incubated separately with citrate stabilized 60 nm gold colloids (90 μL) in a ratio of 1:10 (v/v) for 10 mins. From this mixture, 20 μL was placed on glass slide and another glass cover slip was covered before the Raman measurement. The Raman spectra were carried out at 785 nm excitation laser source and similar exposure time to reveal the sensitive Raman reporters among 54 reporters.
SERS measurement of three different Raman reporters
Raman reporters used in the study are 1) λ795: CyRLA-572; 2) λ740: Cy7LA and 3) λ770: Cy7.5LA. A freshly prepared Raman reporter solution (20 μM, 20 μL) was added drop-wise to gold nanoparticles (180 μL, 2 × 10¹⁰ number of AuNPs/mL) with stirring at a ratio of 1:10 (v/v). Then, Raman reporter’s adsorbed AuNPs solution (20 μL) was placed on a clean glass slide then covered with a cover slip and Raman shift was measured by Raman Microscope under 50 × objective lens. Experiments were repeated for three times.
UV-Vis spectroscopy
UV-visible spectra were acquired with a Hitachi U2090 spectrophotometer. A gold nanoparticle solution (1 mL) was placed in a cell, and spectral analysis was performed in the 200 to 900 nm range at room temperature.
Mixed PEG encapsulation of SERS nanoparticles and stability
A freshly prepared aqueous solution of Raman reporters (20 μM, 400 μL) was added drop wise to AuNPs with stirring at a ratio of 1:10 (v/v). This mixing strategy facilitated evenly distributions of the Raman reporters on the surface of AuNPs. Furthermore, Raman reporters were well adsorbed to AuNPs by the process of chemisorption. Optimum concentration of Raman reporters was standardized for maximal SERS intensities and minimal colloidal aggregation. After 10 min of incubation, a SH-C2H4-CONH-PEG-C3H6-COOH (PEGMW: 3000 dalton; RAPP Polymer GmbH) solution (10 μM × 60 μL) was added drop wise to the Raman-encoded AuNPs to have the minimum surface coverage. Another 15 min later, CH3-PEG-SH (PEGMW: 5000 dalton; RAPP Polymer GmbH) (10 μM × 1800 μL) was added drop wise to have the maximum surface coverage of AuNPs. This surface coverage helps to form a monolayer of PEG on the AuNPs surface. Free CH3-PEG-SH was removed after 3 hours of mixing by three rounds of centrifugation (4000 rpm, 15 mins) and it was re-suspended in PBS buffer which was ready for the covalent conjugation at the carboxyl terminal of heterofunctional PEG. This monolayer protected gold colloids stabilized in various environments. The stability was studied at deionized water (DI) for 20 to 30 days. Three triplicates measurements were performed to check the SERS signal intensity.
Transmission electron microscopy (TEM)
Gold nanoparticles were visualized using 200 keV TEM (JEOL 2010, Japan). Ten microliter droplets of the sample were drop casted onto a piece of ultrathin Formvar-coated 300-mesh copper grid (Electron Microscopy Sciences, Inc.) and left to dry in air. TEM images of the prepared colloidal gold nanoparticles were used for the size distribution measurements. For each sample, the size of at least 100 particles was measured and the average size and the standard distribution were obtained. In all cases, mean size and standard distribution measured by TEM were used for the calculations.
Antibody conjugation to SERS nanotags
A mouse monoclonal anti-CD34, CD184 and Notch1 antibodies purchased from Santa Cruz Biotechnology, Inc. and BioLegend. For bio-conjugation, the carboxyl functional groups on the nanoparticle surface were activated by adding ethyl dimethylaminopropyl carbodiimide (EDC, 4 μL) and N-hydroxy succinimide (NHS, 5 μL) solution at a concentration of 25 mM each respectively. After 30 mins of mixing, the excess EDC and NHS were removed by single round of centrifugation (8000 rpm, 5 min) and resuspended in PBS. The purified Au-NPs with activated carboxyl groups were then reacted with azide free antibodies at 25°C for 2 hours in PBS buffer (20 mM, pH 7.3) and then stored the antibody conjugated nanotags at 4°C for overnight. Further non-specific binding chemicals and antibodies were removed by centrifugation (8000 rpm, 5 min) and final nanotags conjugated with specific antibodies were re-suspended in PBS.
Cell preparation of mESC
mESC was maintained on gelatinized tissue culture dishes in high glucose DMEM supplemented with 20% ES FBS, 1% Pen Strep Glutamine, 1% Non-Essential Amino acid, 0.1% β-mercaptoethanol and 100 U/ml leukemia inhibitory factor (LIF, Chemicon). For trypsinization, after removing the old media and washing by PBS (pH 7.3) the cells were incubated in the culture plates using 0.25% trypsin with 1 mM Ethylenediaminetetraacetic acid (EDTA) solution (Invitrogen) for 3 min at 37°C to obtain a single cell suspension. After neutralizing the trypsin by media spin down (1500 rpm for 3 min) in a falcon tube to collect the pellet which is subcultured in non gelatinated cell culture dishes in the mESC media without leukemia inhibitory factor (LIF) and incubate for a 4-6 days to make an embryonic body. After neutralizing the trypsin by media spin down (1500 rpm for 3 min) in a falcon tube to collect the pellet of embryonic body which is subcultured in gelatin coated chamber slide with mESC culture media without LIF for 4 days.
Spectral measurements
The spectral measurements were carried out in a Raman microscope (Renishaw InVia, UK) using an excitation wavelength at 785 nm under 50 × objective lens coupled to a Peltier cooled CCD detector. The WiRE 3.0 software provided with the instrument was used for measurements, data acquisition and analysis. Raman spectra were collected in the range of 400-2000 cm-1 with a resolution of about 1 cm-1 and the exposure time was set at 10 s throughout the measurements. Baseline correction of the measured spectra was performed to remove the broad background and fluorescence background.
Cytotoxicity measurement
mESC was maintained on gelatinized tissue culture dishes in high glucose DMEM supplemented with 20% ES FBS, 1% Pen Strep Glutamine, 1% Non-Essential Amino acid, 0.1% β-mercaptoethanol and 100 U/ml leukemia inhibitory factor (LIF, Chemicon). For trypsinization, after removing the old media and washing by PBS (pH 7.3) the cells were incubated in the culture plates using 0.25% trypsin with 1 mM EDTA solution (Invitrogen) for 3 min at 37°C to obtain a single cell suspension. After neutralizing the trypsin by media spin down (1500 rpm for 3 min) in a falcon tube to collect the pellet which is subcultured in gelatinated cell culture plate (96 well opaque cell culture plate) 3000 cells/well in 100 μL of mESC media. After preincubation of cells for 24 h, gold nanoparticles (AuNPs), dyes (Cy7LA) and variable concentration of nanoparticle conjugates (AuNPs with Cy7LA dye coated with mixed PEG) were incubated for 3 h at humidified cell culture conditions (37°C; 5% CO2) in mESC media. Then, CellTiter-Blue® solution (CellTiter-Blue® Cell Viability Assay from Promega) (20 μl/well) was added and cells were incubated for 4 hour before recording fluorescence (560Ex/590Em) using a SpectraMax M2 plate reader.
Cell SERS mapping of mESC cells
For the cell SERS mapping experiment, cells were plated in 8 well glass slide chamber which is perfect for the SERS mapping experiment in Renishaw InVia Raman microscope system with a laser beam directed to the sample through a 50 × objective lens, and a Peltier cooled CCD detector. When the embryonic body differentiated into three germ layers on the glass slide chamber, 50 μL of each antibody conjugated three nanotags (Cy7LA@AuNPs@PEG-anti-CD184, CyRLA-572@AuNPs@PEG-anti-CD34 and Cy7.5LA@AuNPs@PEG-anti-Notch1) were applied in three individual wells in glass slide chambers. The nanotags treated glass slide chambers were incubate for 2 h and washed carefully by media and PBS buffer. Briefly, the cells were washed by media (5 min incubation followed by washing for thrice) and PBS (× 3, phosphate–buffered saline) after incubation at 37°C with 5% CO2. Finally, the cover slide was placed on the glass slide chamber using a mounting solution, Electron Microscopy Science (EMS). This glass slide was applied for cell mapping experiment in streamline camera with 785 nm laser source. Cell mapping measurements at 523 cm-1, 586 cm-1 and 503 cm-1 were carried out as raster scans in 2 μm steps over the specified area (aprox. 50 × 50 μm2) with 2 s as the integration time per step.
In vivo teratoma detection and SERS mapping experiment
Balb/c nude mice (age of 4-6 weeks, weight 18 g) from the Biological Resource Centre (Biomedical Sciences Institute, A*STAR) were anesthetized by intraperitoneal injection (i.p) of ketamine (150 mg/kg)/xylazine (10 mg/kg) and differentiated mESC (mouse embryonic stem cells) cells were injected subcutaneously into the rear flank (5 × 10⁶ cells) per site in a volume of 100 μL. When the teratoma grew to a size around 4 mm Cy7LA@AuNPs@PEG-anti-CD184 nanotags (400 pM, 100 μL) were injected into the tail vein of that mice. After 4 h, mice were anesthetized by i.p injection of ketamine and xylazine mixture solution and in vivo teratoma detection was performed by scanning in the range from 400-1600 cm-1 using a Renishaw InVia Raman microscope with 785 nm laser excitation coupled with streamlines CCD camera and 70 mW laser power. The integration time was set as 10 s and the laser was coupled to the sample through a 20 × objective lens with a beam spot of aprox. 2 μm. In another experiment, a mixture of three nanotags (100 μL, 130 pM of each nanotags i.e Cy7LA@AuNPs@PEG-anti-CD184, CyRLA-572@AuNPs@PEG-anti-CD34 and Cy7.5LA@AuNPs@PEG-anti-Notch1) were injected through tail vein and spectra were recorded in the range from 400-800 cm-1 after 4 h post injection. In the same time, mapping experiments at 523 cm-1 and 503 cm-1 and 586 cm-1 were carried out as raster scans in 2 μm steps over the specified area (aprox. 50 × 50 μm2) with 2 s as the integration time per step from teratoma and liver area. The animal experiment procedures were performed in accordance with a protocol approved by the Institutional Animal Care and Use Committee (IACUC # 120735).
Results
Development of biocompatible multiplex SERS active nanoparticles
A fifty four membered CyRLA library (Chart S1, Scheme S1, Table S1) was screened in presence of gold colloids. Surprisingly, five reporters (CyRLA-442 (F9), CyRLA-572 (E10), CyRLA-364 (H5), CyRLA-335 (C5) and CyRLA-240 (D5)) showed SERS signal intensity much higher compare to the rest of the reporters (Figure 1). Hence, these five reporters were resynthesized (characterize by 1HNMR, ESI-MS, see supporting information) and then compared their SERS signal intensity to identify CyRLA-442, CyRLA-572 and CyRLA-240 as the most promising reporters. Furthermore, we studied their signal stability at 523 cm-1 for a month (Figures S4, S5, S6) after coating with biocompatible polymer, polyethylene glycol (PEG). Considering both signal intensity and stability, we selected CyRLA-572 was the best. This CyRLA-572 along with other two in house Raman reporters absorb light in NIR regions (Figure S3) which helps to resonance with excitation laser source at 785 nm to gain higher intensity. The adsorption of these Raman reporters was confirmed by comparing the surface Plasmon resonance (SPR) of gold colloids after and before treatment of Raman reporters (Figure S3). Furthermore, transmission electron microscopy (TEM) images of AuNPs@CyRLA-572@PEG (Figure S7) indicate that these nanoparticles are well dispersed after PEG encapsulation. After successful development of highly sensitive NIR Raman reporter, we evaluated the multiplexing ability of this CyRLA-572 with previously reported NIR active Raman reporters Cy7LA and Cy7.5LA under a single excitation wavelength (e.g. 785 nm diode lasers). Figure 2 clearly indicates that this new CyRLA-572 Raman reporter is good multiplex partner with Cy7.5LA and Cy7LA (SI, Figure S2). To test the biocompatibility of these Au-conjugates, we performed cell cytotoxicity by using CellTiter-Blue® Cell Viability Assay. The results showed that the cells were almost >94% viable with respect to either free AuNPs or Tris buffer in cell culture media (Figure 3).
Figure 1.
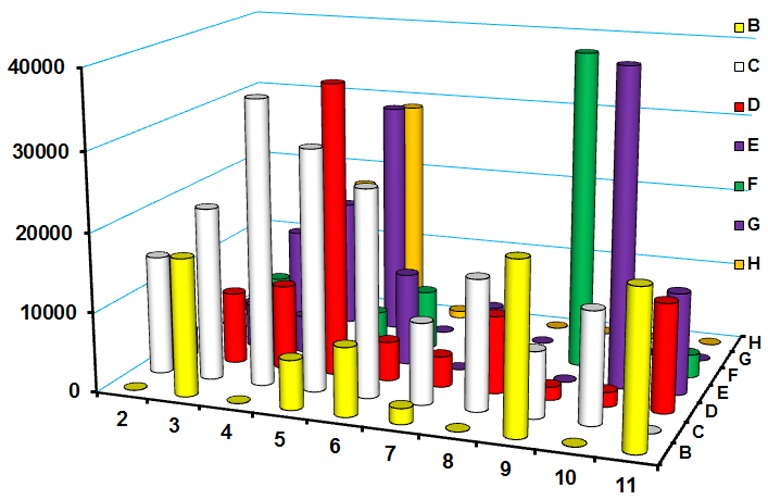
SERS intensity plot among different structure of cyanine derivatives (CyRLA compounds). Each dye was incubated with 60 nm gold nanoparticles for 10 min before the spectra measurement. The most sensitive Raman reporters are found C4, C5, D5, E10, F9, and H5 named as CyRLA-329, CyRLA-335, CyRLA-240, CyRLA-572, CyRLA-442, and CyRLA-364 respectively. The spectra were measured in Renishaw InVia Raman microscope (Renishaw, UK, model: HPNIR785) using an excitation wavelength of 785 nm. The reference peak for the comparison of the Raman intensity was 1208 cm-1.
Figure 2.
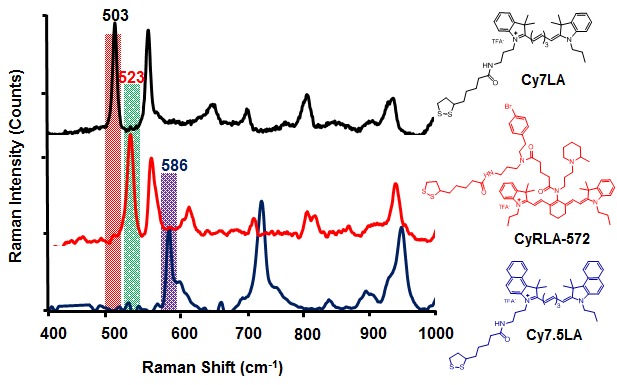
Normalized SERS spectra of Cy7LA, Cy7.5LA and CyRLA-572 after chemisorption on gold nanoparticle with sizes of 60 nm. Spectra were measured in a Raman microscope (785 nm laser excitation, 1.2 mW laser power, and acquisition time: 10 s.
Figure 3.
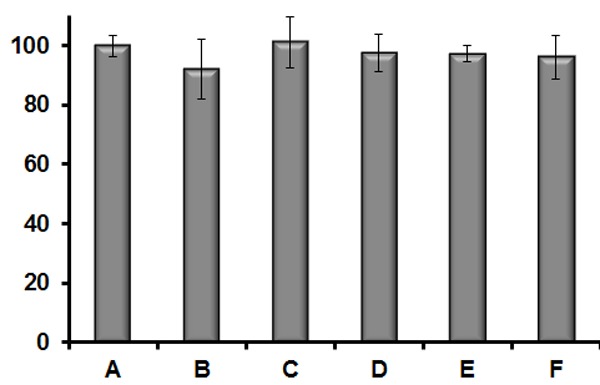
Cell viability of mESC cells after 3 h incubation with A. Media+2 mM Tris Buffer; B. Cy-7LA (2 × 10⁻⁶ M); C. AuNPs (5.6 × 10⁻⁸ M); D. AuNPs@Cy7LA@PEG (5.6 × 10⁻⁸ M); E. AuNPs@Cy7LA@PEG (2.8 × 10⁻⁸ M); F. AuNPs@Cy7LA@PEG (1.4 × 10⁻⁸ M).
Preparation of multiplex SERS nanotags
After developing biocompatible SERS Au-conjugates, these were applied to develop three multiplex targeting nanotags by tagging with three specific antibodies. Hence, three different targeting antibodies anti-CD34, anti-CD184 and anti-Notch1 which specifically recognize their respective receptors on the cell surface of mesoderm, endoderm and ectoderm [15-21], were conjugated to three multiplexed SERS based AuNPs which were individually exposed by multiplexed Raman reporters such as Cy7LA, Cy7.5LA and CyRLA-572 and coated with mixed PEG. As a result, Cy7LA@AuNPs@PEG-anti-CD184, Cy7.5LA@AuNPs@PEG-anti-Notch1 and CyRLA-572@AuNPs@PEG-anti-CD34 nanotags were obtained. A successful conjugation of antibody was characterized by the maximum absorbance of proteins at 280 nm (Figure S8).
In vitro application of SERS nanotags
Hereafter, we focused for the application of these multiplex SERS nanotags for the detection of differentiated mESC cells. Three individual experiments were performed after incubating the targeted nanotags (Cy7LA@AuNPs@PEG-anti-CD-184, Cy7.5LA@AuNPs@PEG-anti-Notch1 and CyRLA-572@AuNPs@PEG-anti-CD34) to the glass slide chamber having differentiated mESC cells. The mapping experiment was performed in stream line CCD camera after putting the cover slide on the mounted glass slide chamber. In Figure 4, cell SERS mapping shows that the cell surface receptors of differentiated mESC are distinctly recognized to their corresponding nanotags. Contrary, similar cell SERS experiments which were performed with unlabeled nanotags (Au-conjugates coated with PEG) and nanotags with control antibody (anti-HER2) in differentiated mESC cells did not show any significant signal (Figures S9, S10).
Figure 4.
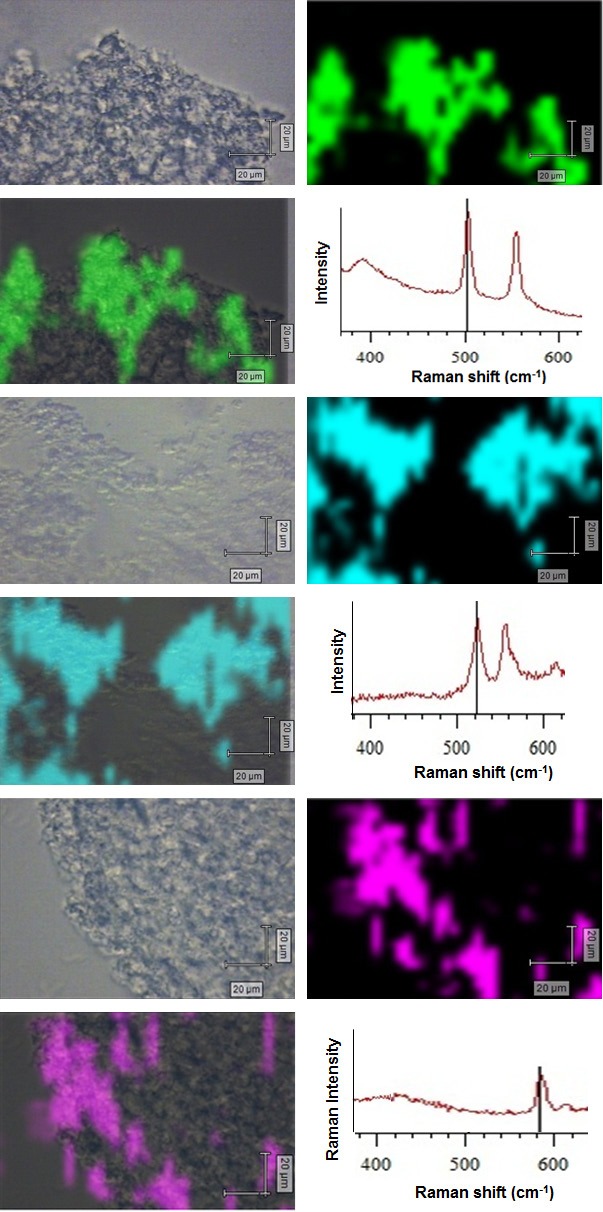
Bright field, SERS mapping images, merged images and complementary SERS spectra of differentiated mouse embryonic stem cells (mESC) treated with three multiplexed mamotags (CyRLA-572@AuNPs@PEG-anti-CD34, Cy7LA@AuNPs@PEG-anti-CD184 and Cy7.5LA@AuNPs@PEG-anti-Notch1. All mapping images were scanned at multiplex peaks of corresponding nanotags (523 cm-1, 503 cm-1 and 584 cm-1) at an interval of 2 μm (785 nm excitation) and the intensities were normalized between the lowest (0) and the highest color (1) values. Scale bar: 20 μm.
In vivo application of multiplex SERS nanotags
After successful demonstration in cells, we moved forward to identify a single germ layer in differentiated mESC cells which formed a monster tumor named as teratoma in vivo. Firstly, we injected an endoderm marker among three germ layers, Cy7LA@AuNPs@PEG-anti-CD184 nanotags (100 μL, 400 pM) through tail vain of a nude mice bearing 4 mm teratoma. After 4 h post injection of nanotags, animal was anaesthetized and the SERS spectra were recorded in the teratoma region through the skin using an NIR laser beam in the range from 400 cm-1 to 2000 cm-1. Interestingly, a very strong SERS signals were perfectly obtained (Figure 5) from one of the germ layer of teratoma. Secondly, we injected unlabeled nanotags (AuNPs@Cy7LA@PEG) to validate that there was no nonspecific binding to the teratoma. Interestingly, there was no SERS signal from the teratoma but a very clear SERS spectrum of Cy7LA was observed from the liver after 4 h of i.v. injection (Figure S11).
Figure 5.
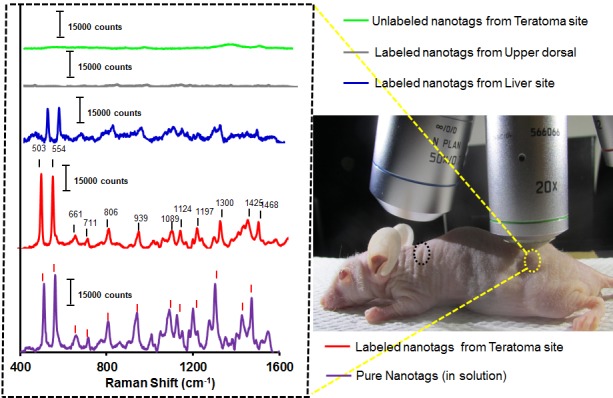
In vivo SERS spectra from teratoma (yellow circle) and non-teratoma (upper dorsal; black circle) regions upon injection of Cy7LA@AuNPs@PEG-anti-CD184 nanotags. The spectra were scanned at an interval of 2 μm (785 nm excitation wavelength) and the intensities were normalized after baseline corrections; acquisition time: 30 s.
In order to detect simultaneously three germ layers in teratoma, we applied multiplex targeted three nanotags. We injected a mixture of three nanotags (total final volume 100 μL, 130 pM of each nanotag) which were conjugated with three different targeting antibodies corresponding to three different germ layers. After 4 h of injection, the SERS spectra were recorded in the range from 400 cm-1 to 800 cm-1. Three multiplexed peaks at 503 cm-1, 523 cm-1 and 586 cm-1 from three different nanotags were noticeably found from the teratoma region (Figure 6). Similarly, three multiplexed peaks were found from the liver area (Figure S12). A mapping experiment was performed to get images from teratoma area also (Figure S13).
Figure 6.
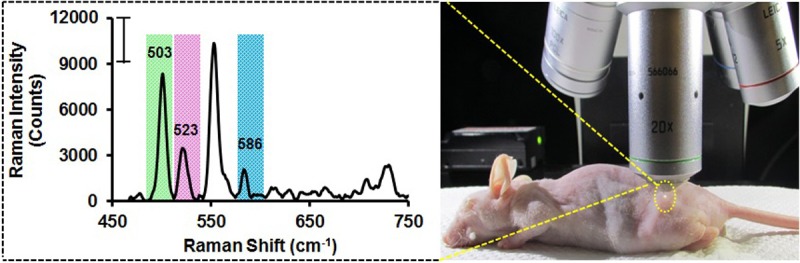
In vivo SERS spectra from teratoma (yellow circle) regions upon injection of CyRLA-572@AuNPs@PEG-anti-CD34, Cy7LA@AuNPs@PEG-anti-CD184 and Cy7.5LA@AuNPs@PEG-anti-Notch1 nanotags. The spectra were scanned at an interval of 2 μm (785 nm excitation wavelength) and the intensities were normalized after baseline corrections. acquisition time: 40 s.
Discussion
In general, tricarbocyanine dyes are very good NIR active Raman reporters [22-24]. To date, our research group has developed combinatorial approach to generate a large set of Raman reporters and high throughput screening strategy to identify [25]. Encouraged by this strategy and using standard solid phase active ester method the most sensitive Raman reporter, we synthesized a new set of NIR active Raman reporters (CyRLA) by derivatizing CyR library [26] which was reported to be excellent photostable at NIR regions. Interestingly, structurally diverse 54 Raman reporters showed almost similar fingerprint SERS spectra (See supporting information (SI), Figure S1) in the range of 400 cm-1 to 2000 cm-1. However, the signal intensity was varied depending on the structural variation that helps to identify the most sensitive five NIR reporters. The exact reason behind the intensity variation of the SERS signals among different Reporters is obscure to us, however, we assume that the orientation of very few molecules and their corresponding dipole moments may properly aligned to the incident laser light resulting to give a maximum intensity [27,31]. To develop good SERS nanotags, stability of the SERS signal also considered a key factor along with the signal intensity. Therefore, a long term stability of SERS signal was analyzed in representative nanotags; CyRLA-572@AuNPs@PEG, CyRLA-442@AuNPs@PEG and CyRLA-364@AuNPs@PEG. Notably, there is no significant aggregation among all these nanotags and they exhibited stable SERS intensities over time. However, the stability of CyRLA-572 clearly suggested that it was the most suitable NIR Raman reporter for the development of novel multiplexed SERS nanotags.
To evaluate the multiplexing ability among three Raman reporters, CyRLA-572, Cy7LA and Cy7.5LA were immobilized on the citrate stabilized 60 nm gold colloids which were reported to be more effective among the different sizes of nanospheres [32-34] to obtain highly sensitive SERS signals. Three characteristic multiplexing peaks at 503 cm-1, 523 cm-1 and 586 cm-1 were observed from Cy7LA, CyRLA-572 and Cy7.5LA respectively. The cell viability was evaluated in mESC cells after 3 h incubation of either dye or pegylated AuNPs. Interestingly, we found the pegylated AuNPs and even the dye alone showed almost no ototoxicity in the cells.
Cell SERS mapping experiments clearly indicate that only targeted antibody having SERS nanotags recognized cell surface receptors whereas unlabeled nanotags or control antibody conjugated nanotags did not recognize the cell surface receptors in mESC cells. Therefore, we conclude from the above results that each nanotags was perfectly conjugated with their corresponding antibodies and these nanotags maintained their activity and consequently showed specific recognizing ability to the corresponding targeting receptors.
It is a great challenge to deliver the imaging probes to the targeting area in in vivo due to the nonspecific interaction of blood proteins and loss of probes via the reticuloendothelial system (RES) [35,36]. However, we have successfully demonstrated that single targeted nanotags were effectively delivered to the teratoma region due to target specific recognition of nanotags. However, a weak SERS spectrum was observed from liver site because gold nanoparticles were accumulated by the Kupffer cells in the liver as foreign materials. However, there was no signal from other anatomical position. Furthermore, unlabeled nanotags were found in the liver area but did not see any signal from the teratoma area. These results clearly suggest that these nanotags were survived in the animal body and were delivered properly to the targeting area. In addition, three nanotags with targeting antibodies were successfully delivered and three multiplexing peaks (503, 523 and 586 cm-1) from the teratoma area referred to their corresponding nanotags. These results indicate that individual nanotags were delivered to the targeting area and specifically recognized their corresponding receptors. Therefore, we confirmed that this monster like tumor is teratoma which was formed from the differentiated mESC cells.
In summary, we report a new set of NIR active Raman reporters (CyRLA) and screened them to identify a most senstive Raman reporter, CyRLA-572 which was found to be an excelent NIR multiplex partner with previously reported two reporters (Cy7LA and Cy7.5LA). These three reporters were adsorbed to AuNPs; encapsulating biocompatible PEG; conjugating three targeting antibodies to prepare multiplex targeted SERS nanotags. These nanotags were fully characterized and applied for the detection of differentiated mESC cells in vitro. A successful demonstration of in vivo teratoma detection by a single biocompatible NIR SERS nanotags (Cy7LA@AuNPs@PEG-anti-CD184) was clearly indicated the nanotags were survived in the animal body and targeting the specific location. Next, the detection of three different germ layers of differentiated mESc in teratoma xenograft model in in vivo was successfully demonstrated by applying a multiplexed SERS nanotags such as CyRLA-572@AuNPs@PEG-anti-CD34, Cy7LA@AuNPs@PEG-anti-CD184 and Cy7.5LA@AuNPs@PEG-anti-Notch1. Earlier detection of teratoma by biocompatible SERS nanotags may help for the development of novel diagnostic tools for monitoring the several disease models.
Acknowledgements
We gratefully acknowledge the A*STAR Joint Council Office (JCO), Singapore (Grant 1231AFG028) for the financial support.
Disclosure of conflict of interest
None.
Supporting Information
References
- 1.Okita K, Ichisaka T, Yamanaka S. Generation of germline-competent induced pluripotent stem cells. Nature. 2007;448:313–317. doi: 10.1038/nature05934. [DOI] [PubMed] [Google Scholar]
- 2.Yang D, Zhang ZJ, Oldenburg M, Ayala M, Zhang SC. Human embryonic stem cell-derived dopaminergic neurons reverse functional deficit in parkinsonian rats. Stem Cells. 2008;26:55–63. doi: 10.1634/stemcells.2007-0494. [DOI] [PMC free article] [PubMed] [Google Scholar]
- 3.D’Amour KA, Bang AG, Eliazer S, Kelly OG, Agulnick AD, Smart NG, Moorman MA, Kroon E, Carpenter MK, Baetge EE. Production of pancreatic hormone-expressing endocrine cells from human embryonic stem cells. Nat Biotechnol. 2006;24:1392–1401. doi: 10.1038/nbt1259. [DOI] [PubMed] [Google Scholar]
- 4.Cao F, Wagner RA, Wilson KD, Xie X, Fu JD, Drukker M, Lee A, Li RA, Gambhir SS, Weissman IL, Robbins RC, Wu JC. Transcriptional and functional profiling of human embryonic stem cell-derived cardiomyocytes. PLoS One. 2008;3:e3474. doi: 10.1371/journal.pone.0003474. [DOI] [PMC free article] [PubMed] [Google Scholar]
- 5.Cunningham JJ, Ulbright TM, Pera MF, Looijenga LH. Lessons from human teratomas to guide development of safe stem cell therapies. Nat Biotechnol. 2012;30:849–857. doi: 10.1038/nbt.2329. [DOI] [PubMed] [Google Scholar]
- 6.Kooreman NG, Wu JC. Tumorigenicity of pluripotent stem cells: biological insights from molecular imaging. J R Soc Interface. 2010;7(Suppl 6):S753–763. doi: 10.1098/rsif.2010.0353.focus. [DOI] [PMC free article] [PubMed] [Google Scholar]
- 7.McVeigh PZ, Mallia RJ, Veilleux I, Wilson BC. Widefield quantitative multiplex surface enhanced Raman scattering imaging in vivo. J Biomed Opt. 2013;18:046011. doi: 10.1117/1.JBO.18.4.046011. [DOI] [PubMed] [Google Scholar]
- 8.Qian X, Peng XH, Ansari DO, Yin-Goen Q, Chen GZ, Shin DM, Yang L, Young AN, Wang MD, Nie S. In vivo tumor targeting and spectroscopic detection with surface-enhanced Raman nanoparticle tags. Nat Biotechnol. 2008;26:83–90. doi: 10.1038/nbt1377. [DOI] [PubMed] [Google Scholar]
- 9.Zavaleta CL, Smith BR, Walton I, Doering W, Davis G, Shojaei B, Natan MJ, Gambhir SS. Multiplexed imaging of surface enhanced Raman scattering nanotags in living mice using noninvasive Raman spectroscopy. Proc Natl Acad Sci U S A. 2009;106:13511–13516. doi: 10.1073/pnas.0813327106. [DOI] [PMC free article] [PubMed] [Google Scholar]
- 10.Jokerst JV, Miao Z, Zavaleta C, Cheng Z, Gambhir SS. Affibody-Functionalized Gold-Silica Nanoparticles for Raman Molecular Imaging of the Epidermal Growth Factor Receptor. Small. 2011;7:625–633. doi: 10.1002/smll.201002291. [DOI] [PMC free article] [PubMed] [Google Scholar]
- 11.Wang YL, Schlucker S. Rational design and synthesis of SERS labels. Analyst. 2013;138:2224–2238. doi: 10.1039/c3an36866a. [DOI] [PubMed] [Google Scholar]
- 12.Maiti KK, Samanta A, Vendrell M, Soh KS, Olivo M, Chang YT. Multiplex cancer cell detection by SERS nanotags with cyanine and triphenylmethine Raman reporters. Chem Commun (Camb) 2011;47:3514–3516. doi: 10.1039/c0cc05265e. [DOI] [PubMed] [Google Scholar]
- 13.Dinish US, Balasundaram G, Chang YT, Olivo M. Sensitive multiplex detection of serological liver cancer biomarkers using SERS-active photonic crystal fiber probe. J Biophotonics. 2013 doi: 10.1002/jbio.201300084. [Epub ahead of print] [DOI] [PubMed] [Google Scholar]
- 14.Maiti KK, Dinish US, Samanta A, Vendrell M, Soh KS, Park SJ, Olivo M, Chang YT. Multiplex targeted in vivo cancer detection using sensitive near-infrared SERS nanotags. Nano Today. 2012;7:85–93. [Google Scholar]
- 15.Gadue P, Gouon-Evans V, Cheng X, Wandzioch E, Zaret KS, Grompe M, Streeter PR, Keller GM. Generation of Monoclonal Antibodies Specific for Cell Surface Molecules Expressed on Early Mouse Endoderm. Stem Cells. 2009;27:2103–2113. doi: 10.1002/stem.147. [DOI] [PMC free article] [PubMed] [Google Scholar]
- 16.Endo Y, Osumi N, Wakamatsu Y. Bimodal functions of Notch-mediated signaling are involved in neural crest formation during avian ectoderm development. Development. 2002;129:863–873. doi: 10.1242/dev.129.4.863. [DOI] [PubMed] [Google Scholar]
- 17.Wakamatsu Y, Maynard TM, Weston JA. Fate determination of neural crest cells by NOTCH-mediated lateral inhibition and asymmetrical cell division during gangliogenesis. Development. 2000;127:2811–2821. doi: 10.1242/dev.127.13.2811. [DOI] [PubMed] [Google Scholar]
- 18.Baker R, Schubiger G. Ectoderm Induces Muscle-Specific Gene-Expression in Drosophila Embryos. Development. 1995;121:1387–1398. doi: 10.1242/dev.121.5.1387. [DOI] [PubMed] [Google Scholar]
- 19.Ema M, Yokomizo T, Wakamatsu A, Terunuma T, Yamamoto M, Takahashi S. Primitive erythropoiesis from mesodermal precursors expressing VE-cadherin, PECAM-1, Tie2, endoglin, and CD34 in the mouse embryo. Blood. 2006;108:4018–4024. doi: 10.1182/blood-2006-03-012872. [DOI] [PubMed] [Google Scholar]
- 20.Stem Cell Reagents. eBioscience. 2009-2010 [Google Scholar]
- 21.Murry CE, Keller G. Differentiation of embryonic stem cells to clinically relevant populations: Lessons from embryonic development. Cell. 2008;132:661–680. doi: 10.1016/j.cell.2008.02.008. [DOI] [PubMed] [Google Scholar]
- 22.Leng WN, Kelley AM. Surface-enhanced hyper-Raman spectra and enhancement factors for three SERS chromophores. SEHRS spectra on Ag films at pulse energies below 2 pJ. J Am Chem Soc. 2006;128:3492–3493. doi: 10.1021/ja057946z. [DOI] [PubMed] [Google Scholar]
- 23.Maiti KK, Samanta A, Vendrell M, Soh KS, Olivo M, Chang YT. Multiplex cancer cell detection by SERS nanotags with cyanine and triphenylmethine Raman reporters. Chem Commun (Camb) 2011;47:3514–3516. doi: 10.1039/c0cc05265e. [DOI] [PubMed] [Google Scholar]
- 24.von Maltzahn G, Centrone A, Park JH, Ramanathan R, Sailor MJ, Hatton TA, Bhatia SN. SERS-Coded Gold Nanorods as a Multifunctional Platform for Densely Multiplexed Near-infrared Imaging and Photothermal Heating. Adv Mater. 2009;21:3175–3180. doi: 10.1002/adma.200803464. [DOI] [PMC free article] [PubMed] [Google Scholar]
- 25.Samanta A, Maiti KK, Soh KS, Liao XJ, Vendrell M, Dinish US, Yun SW, Bhuvaneswari R, Kim H, Rautela S, Chung JH, Olivo M, Chang YT. Ultrasensitive Near-Infrared Raman Reporters for SERS-Based In Vivo Cancer Detection. Angew Chem Int Ed Engl. 2011;50:6089–6092. doi: 10.1002/anie.201007841. [DOI] [PubMed] [Google Scholar]
- 26.Das RK, Samanta A, Ha HH, Chang YT. Solid phase synthesis of ultra-photostable cyanine NIR dye library. Rsc Adv. 2011;1:573–575. [Google Scholar]
- 27.Kudelski A. Characterization of thiolate-based mono- and bilayers by vibrational spectroscopy: A review. Vib Spectrosc. 2005;39:200–213. [Google Scholar]
- 28.Brolo AG, Irish DE. The adsorption and orientation of pyrazine on silver electrodes: A surface enhanced Raman scattering study. J Electroanal Chem. 1996;414:183–196. [Google Scholar]
- 29.Huo SJ, Li QX, Yan YG, Chen Y, Cai WB, Xu QJ, Osawa M. Tunable surface-enhanced infrared absorption on Au nanofilms on Si fabricated by self-assembly and growth of colloidal particles. J Phys Chem B. 2005;109:15985–15991. doi: 10.1021/jp052585v. [DOI] [PubMed] [Google Scholar]
- 30.Nakata K, Okubo A, Shimazu K, Yamakata A, Ye S, Osawa M. Surface-enhanced infrared absorption spectroscopic studies of adsorbed nitrate, nitric oxide, and related compounds 1: Reduction of adsorbed NO on a platinum electrode. Langmuir. 2008;24:4352–4357. doi: 10.1021/la703394z. [DOI] [PubMed] [Google Scholar]
- 31.Rima FR, Nakata K, Shimazu K, Osawa M. Surface-Enhanced Infrared Absorption Spectroscopic Studies of Adsorbed Nitrate, Nitric Oxide, and Related Compounds. 3. Formation and Reduction of Adsorbed Nitrite at a Platinum Electrode. J Phys Chem C. 2010;114:6011–6018. [Google Scholar]
- 32.Nusz GJ, Marinakos SM, Curry AC, Dahlin A, Hook F, Wax A, Chilkoti A. Label-free plasmonic detection of biomolecular binding by a single gold nanorod. Anal Chem. 2008;80:984–989. doi: 10.1021/ac7017348. [DOI] [PMC free article] [PubMed] [Google Scholar]
- 33.Joseph V, Matschulat A, Polte J, Rolf S, Emmerling F, Kneipp J. SERS enhancement of gold nanospheres of defined size. J Raman Spectrosc. 2011;42:1736–1742. [Google Scholar]
- 34.Hong SM, Li X. Optimal Size of Gold Nanoparticles for Surface-Enhanced Raman Spectroscopy under Different Conditions. J Nanomater. 2013 DOI:10.1155/2013/790323. [Google Scholar]
- 35.Gabizon A, Horowitz AT, Goren D, Tzemach D, Shmeeda H, Zalipsky S. In vivo fate of folate-targeted polyethylene-glycol liposomes in tumor-bearing mice. Clin Cancer Res. 2003;9:6551–6559. [PubMed] [Google Scholar]
- 36.Montet X, Funovics M, Montet-Abou K, Weissleder R, Josephson L. Multivalent Effects of RGD Peptides Obtained by Nanoparticle Display. J Med Chem. 2006;49:6087–6093. doi: 10.1021/jm060515m. [DOI] [PubMed] [Google Scholar]
Associated Data
This section collects any data citations, data availability statements, or supplementary materials included in this article.