Abstract
Purpose: To explore the applicability of contrast-enhanced ultrasound (CEUS) as a new method to detect impaired microcirculation in type 2 diabetes mellitus patients with microvascular complications (DM+MC). Methods: Ultrasound contrast agent was injected into peripheral vein of 28 patients with DM+MC, 30 uncomplicated type 2 diabetes mellitus (DM) patients, and 30 control subjects. Its appearance in the calf muscle was detected by contrast-enhanced ultrasound. Time-intensity curves were established based on mathematical modeling, particularly in small artery, muscular tissue and small vein. Times to peak intensity (TTPs), arrival times (ATs) and contrast transit times (CTTs) were analyzed. CTTs were calculated as the differences between arrival times. With patients under fasting conditions, plasma glucose and rheologic parameters of erythrocyte deformability and plasma viscosity were measured. Results: DM and DM+MC groups tended to have longer TTPs than the control group, but without significant differences between DM group and DM+MC group. The median artery-vein and muscle-vein CTTs were statistically significantly highest in the DM+MC group (P < 0.05). Blood viscosity in the DM+MC group was higher than two other groups (P < 0.05). Blood viscosity correlated positively with both blood glucose and C-reactive peptide (P < 0.01). Conclusion: CEUS is potentially reliable to detect changes in the microvascular bed. Abnormalities in capillary recruitment may be related to abnormal hemorheology.
Keywords: Contrast-enhanced ultrasound, type 2 diabetes mellitus, microvascular complications, microcirculation
Introduction
Being a common diabetic complication, diabetic microangiopathy does not only involve microvascular beds in the kidneys or retinas, but also the peripheral microvasculature in the other organs, such as extremities, skin, musculoskeletal tissues and etc., and thus exerting extensive damage to the human body. As musculoskeletal microangiopathy is a major component of diabetic microangiopathy [1,2], musculoskeletal problems have become a critical target in the prevention and treatment of diabetes mellitus; therefore, a better understanding of musculoskeletal microcirculatory disorders plays an essential role in the diabetes management. However, in current clinical practice, there is still lack of a convenient and feasible method able to achieve real-time dynamic assessment of musculoskeletal microcirculatory function. As a newly emergent perfusion imaging technology, contrast-enhanced ultrasonography (CEUS) has been widely accepted and used in the perfusion studies on liver, cardiac muscles and brain; and in recent years, it was also employed for the assessment of impaired musculoskeletal perfusion of lower extremities [3-5]. The present study aimed to investigate the feasibility of assessing microcirculation of lower extremities through contrast transit time (CTTs), and to conduct comparative analysis of various hemorheological parameters.
Clinical data and methods
Subjects
The subjects enrolled were assigned into three groups, namely, the type 2 diabetes mellitus with microvascular complications (DM+MC) group, the type 2 diabetes mellitus (DM) group and the normal control group.
28 in-patients (admitted in the Department of Endocrinology at our hospital between June 2011 and June 2012) with type 2 DM complicated by microangiopathy were included in the (DM+MC group). These patients (16 females and 12 males) aged between 55 and 78 years, with a mean age of 68 years and an average disease course of 8.0 years. The inclusion criteria were as follows: 1) the patients were definitely diagnosed with diabetes; 2) With at least one of the following diabetic microangiopathy, i.e., diabetic nephropathy, diabetic retinopathy and diabetic neuropathy [6]. All of the 28 patients had diabetic nephropathy, while 18 of them also had retinal complications and 8 of them had neural complications; 3) Absence of diabetic foot. Demographic data were as follows: 20 of the 28 patients had a history/present disease of hypertension, while 18 had hyperlipidemia and 12 claimed smoking.
30 in-patients (18 females and 12 males), who were admitted in the Department of Endocrinology at our hospital during the same period of time, were included in the DM group. These patients aged between 59 and 83 years, with a mean age of 72 years and an average disease course of 4.5 years. The inclusion criteria were as follows: 1) the patients who were definitely diagnosed with diabetes; and 2) Absence of any diabetic microangiopathy (diabetic nephropathy, diabetic retinopathy and diabetic neuropathy) and diabetic foot. Demographic data: 17 of the 30 patients had a history/present disease of hypertension, while 14 had hyperlipidemia and 9 claimed smoking.
30 voluntary staffs (17 females and 13 males) from our hospital were included in the normal control group. The patients aged between 41 and 67 years, with a mean age of 55 years. The inclusion criteria were as follows: 1) absence of muscular ischemia; 2) absence of diabetes, hypertension or hyperlipidemia; and 3) normal body mass index. Demographic data were as follows: 9 claimed smoking.
Exclusion criteria
1) Presence of peripheral angiopathy; 2) Presence of acute coronary syndrome; 3) Presence of severe pulmonary artery hypertension (PAH); 4) Presence of severe mitral/aortic regurgitation; 5) Ankle brachial index < 0.9; and 6) Uncontrolled hypertension (> 150/90 mmHg). Written consents were obtained from all of the subjects.
Laboratory tests
On the day when CEUS scan was performed, every individual subjects also underwent blood tests under fasting condition to obtain the measurements of the following parameters: blood glucose, glycosylated hemoglobin (HgbA1C), basal plasma insulin level, C-reactive protein (CRP), whole blood viscosity 30, red blood cell deformation index, triglycerides, Cholesterol including high density lipoprotein (HDL) and low density lipoprotein (LDL).
Apparatus and method
Apparatus and imaging settings
The CEUS scan was performed by using a My-lab90 scanner (Esaote) with a linear array transducer at 3-9 MHz. The following setting was adopted for the tests conducted on all the subjects: mechanical index (MI) of 0.08; acoustic output of 5%; depth 4 cm; single focus located at 2.75 cm; frequency at 6 MHz; gain of 36 and measured in mm.
The medical imaging procedures
Sonography was taken after the subject has lain down at supine position for 20 minutes (room temperature varied from 19°C to 21°C) [7]. The transducer was placed at the medial side of central calf muscle group (the posterior calf muscle group, which was the major flexor group in the leg able to achieve planter flexion movement, was selected as the studying target, since this relatively more superficial muscle group had easily-localizable anatomical position and extensive anastomosing microvasculature). SonoVue (Bracco) microbubble suspension, which was prepared via vibration with 5 ml of saline, was used as the contrast agent. Via a three-limb indwelling catheter that was inserted into the left forearm vein, 2.4 ml of suspension was injected (bolus injection) rapidly, before 5 ml of saline was injected subsequently at the same speed. Contrast-enhanced images during the first 4 minutes were obtained. The transducer remained unmoved to obtain overlayable 2-D images, which were all saved in the hard-disc.
Image analysis
Variations in the echo volumes of contrast microbubbles corresponding to the calf skeletal muscles (gastrocnemius muscles and partial soleus muscles) at various resolutions were analyzed by using SonoLiver software (Tomtac), to obtain the time intensity curves (TIC) (Figure 1). A 20 mm-diameter circle in the calf skeletal muscles was selected as the region of interest (ROI), while two smaller ROIs (diameter about 2 mm) were located at the arteriole and venule, respectively (using color Doppler positioning technique). The distance between the arteriolar and venular ROIs ranged from 20 to 30 mm, while that between the arteriole/venule and muscle group studied was 5-10 mm (Figure 2). The CEUS perfusion parameters including times to peak intensity (TTPs) and arrival times (ATs) of contrast agent were derived through the assessment of multiple hemodynamic features (e.g. dynamic blood flow etc.) of the target regions on the TIC. The deviation among the ATs was defined as the transit time of contrast agent. The CEUS perfusion imaging was performed by an experienced radiologist, and the images obtained were reviewed by two expertized physicians on a double-blind basis. The measurements were repeated thrice to obtain the average values, for reducing the human error. The curves with fitting less than 0.75 were excluded.
Figure 1.
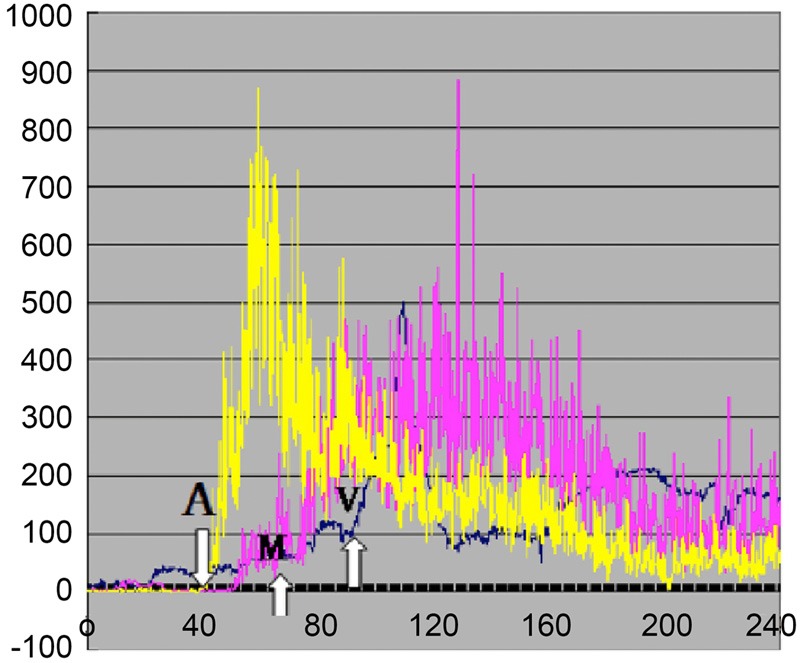
Time intensity curves of contrasted images on calf skeletal muscles. The white arrows represented the arrival times (ATs) of contrast agents on the arteriole (A), muscle (M) and venule (V).
Figure 2.
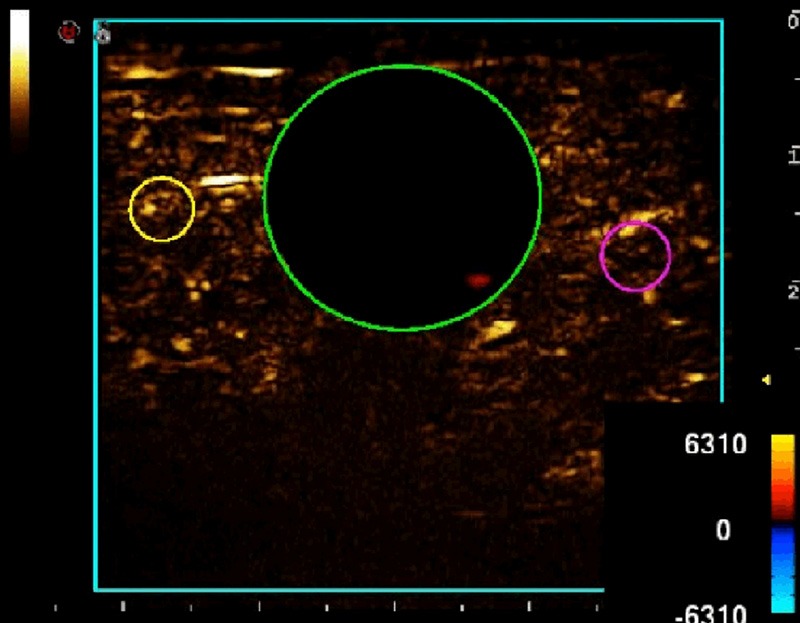
Ultrasonic images of calf skeletal muscles. The green ROI represented the muscle group; while the yellow ROI represented the arteriole and the red ROI represented the venule.
Statistical analysis
All the data were analyzed by using SPSS17.0 statistic software, while the measurements were expressed in form of x̅ ± s. The quantitative data were subjected to Fisher’s test; whereas, the inter-group comparisons of various parameters among the three groups (control group, DM group and DM+MC group) were subjected to Mann-Whitney U test; and the correlation between blood viscosity and fasting blood glucose/CRP were evaluated by using the partial correlation analysis; the differences in age was adjusted by analysis of covariance; any difference with P < 0.05 was considered statistically significant.
Results
General data
The baseline clinical characteristics for the three groups are presented in Table 1. The differences in age, gender and smoking history among the three groups were statistically insignificant (P > 0.05). The difference in diabetes disease course between the DM and the DM+MC group was statistically significant (P < 0.05). With respects to the hypertension, hyperlipidemia and medication received, the differences between the DM and the DM+MC group were all statistically insignificant, while the DM+MC patients tends to have higher serum triglycerides.
Table 1.
Clinical Characteristics and Laboratory Data
| Control | DM | DM+MC | |
|---|---|---|---|
| Age | 55 ± 9.1 | 72 ± 11 | 68 ± 7.3 |
| Gender, F/M | 17/13 | 18/12 | 16/12 |
| BMI | 22 ± 3.6 | 34 ± 5.6* | 35 ± 5.1* |
| DM course, year | - | 4.5 ± 5 | 8 ± 6.2*,# |
| Hypertension (%) | 0 | 57* | 71* |
| Smoking (%) | 30 | 30 | 43 |
| Medication (%) | |||
| Aspirin | 0 | 40* | 54* |
| Beta-blocker | 0 | 30* | 40* |
| ACEI | 0 | 43* | 57* |
| Triglycerides (mmol/L) | 1.23 ± 0.3 | 1.89 ± 0.41 | 2.51 ± 0.3 |
| Cholesterol (mmol/L) | |||
| LDL | 3.3 ± 0.6 | 3.4 ± 0.40 | 3.5 ± 0.40 |
| HDL | 1.6 ± 0.3 | 1.5 ± 0.40 | 0.9 ± 0.40* |
| Blood glucose (mmol/L) | 5.1 ± 0.61 | 7.9 ± 1.7* | 12.6 ± 3.6*,# |
| Whole blood viscosity 30 (mPas) | 4.5 ± 0.14 | 4.54 ± 0.14 | 5.16 ± 0.25*,# |
| RBC deformation index | 0.74 ± 0.15 | 0.76 ± 0.15 | 0.7 ± 0.17 |
| CRP (mg/L) | 1.0 ± 1.1 | 4.4 ± 1.2* | 5.5 ± 0.5*,# |
| Insulin level (μU/mL) | 6.6 ± 2.6 | 15.9 ± 3.7* | 15.4 ± 4.4* |
| Insulin resistance index | 1.5 ± 0.6 | 5.6 ± 2.3* | 8 ± 2.3*,# |
Insulin resistance index = fasting blood glucose (mmol/l) × fasting insulin (μU/ml)/22.5.
P < 0.05 when compared with the control group;
P < 0.05 when compared with the DM group.
Pair-wise comparison
Among the three groups, the results of pair-wise comparisons on blood glucose level, hemoglobin, whole blood viscosity 30 mPas, CRP and insulin resistance index all showed differences with statistical significance (P < 0.05); The insulin level in the control group showed statistically significant differences to both DM and DM+MC groups (P < 0.05); with respect to the red blood cell deformation index, none of the pairwise comparisons among the three groups showed difference with statistical significance (P > 0.05). Correlation analyses between whole blood viscosity and blood glucose/ CRP showed blood viscosity was highly positively correlated with both blood glucose and CRP (r = 0.64, P < 0.001 and r = 0.58, P < 0.001, respectively) (Figure 3).
Figure 3.
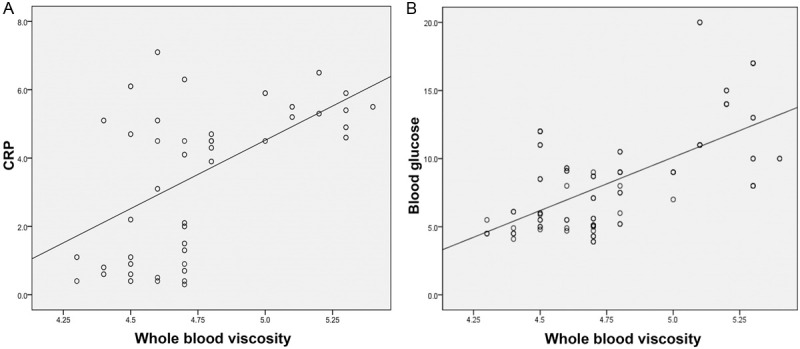
Correlation between whole blood viscosity and either plasma glucose (A) or C-reactive protein (hs-CRP) peptide (B).
Inter-group comparisons of TTPs
As to TTPs, DM and DM+MC group have significant higher TTPs than control group (P < 0.01), while there are no significant difference between DM group and DM+MC group (P > 0.05) (Figure 4).
Figure 4.
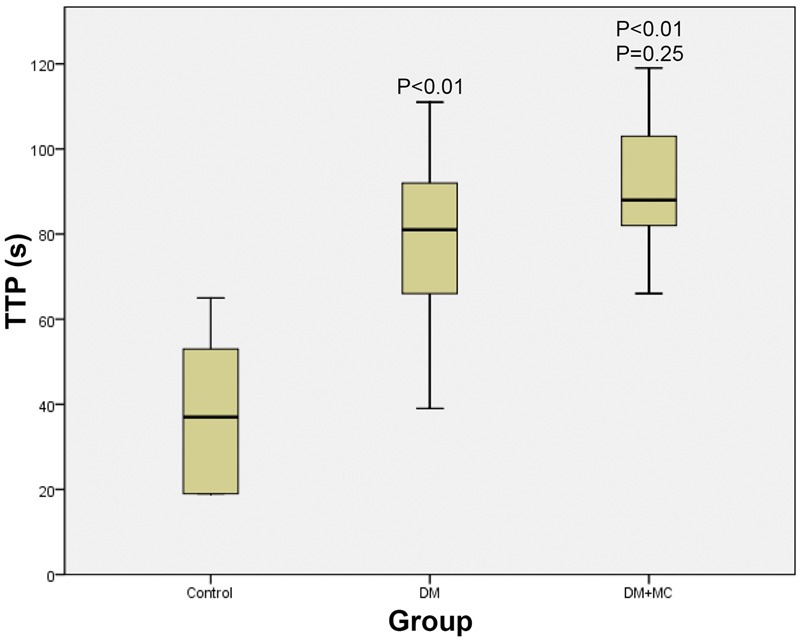
Comparison of the TTPs among the three groups.
Inter-group comparisons of ATs and relevant transit times
With respect to the arteriole-to-venule and muscle-to-venule transit times, the pairwise comparisons among the three groups all showed statistically significant differences (P < 0.05) (Figure 5); whereas, the inter-group differences in arteriole-to-muscle transit time among the three groups were all statistically insignificant (P > 0.05). After adjusting the differences in ages by analysis of covariance, the pairwise comparisons among the three groups showed statistically significant differences in both arteriole-to-venule and muscle-to-venule transit times (P < 0.05).
Figure 5.
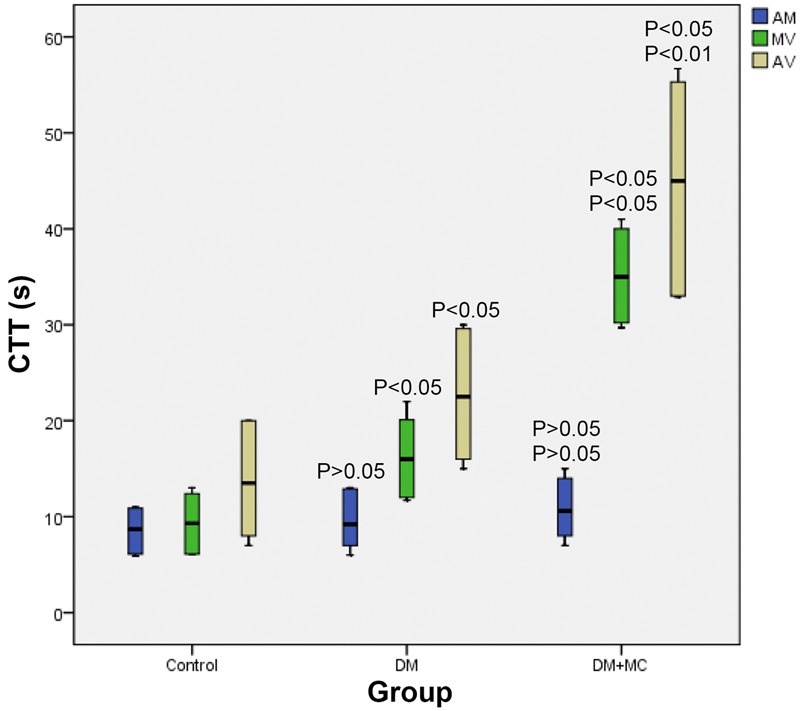
Comparison of the CTTs among the three groups. (AM represents the transit times from artery to muscle; MV represents the transit times from muscle to vein; AV represents the transit times from artery-to-vein).
Discussions
Skeletal muscle is one of the target tissues, on which insulin inside human body acts. For patients with obesity and type 2 DM, skeletal muscles become the main target position of peripheral insulin resistance. Studies indicated that, 75% perfused glucose would been taken up by skeletal muscles, and microcirculation disturbance might trigger or worsen insulin resistance, which deteriorated metabolic disorders in advance, making the condition uncontrollable [8]. Due to its impact on exercise capacity of DM patients and glucose metabolism, microcirculation perfusion of skeletal muscles has now become a research hotspot [9]. CEUS has been used in detecting skeletal muscles perfusion abnormity of lower extremity atherosclerotic occlusive disease, and TTPs has been accepted widely as a descriptive perfusion parameter [10]. However, TTPs was more likely to reflect perfusion of large vessels. So, TTPs was not suitable for early diagnosis of skeletal microcirculation diseases, because sclerosis and stenosis has already occurred in lower extremities of patients, when TTPs became abnormal [11]. Our study also showed that DM and DM+MC groups tend to have longer TTPs than the control group, but without significant difference between DM group and DM+MC group.
The previous studies suggested the pathological features of diabetic microangiopathy included functional change of microcirculation, endothelial injuries, thickened basement membrane, increased blood viscosity, erythrocyte aggregation, platelet adhesion and aggregation, which eventually resulting in micro-thrombosis and/or microvascular occlusion [12,13], constituting the theoretical basis for the contrast-enhanced ultrasonographic assessment of microcirculation. The contrast agent used in the present study was SonoVue, a microbubble-containing blood-pool tracer. With an average diameter of 2.5 μm, the microbubbles had the similar behavior as the erythrocyte within the blood vessel, and thus could be used to reflect the musculoskeletal blood perfusion. In CEUS exams, arrival times of contrast agent at different phases were used as alternative parameters describing the blood flow rate. The transit time of contrast agent has been used in the assessment of hepatic microcirculatory perfusion, so as to provide an indirect assessment on the severity of hepatic fibrosis [14]. In the present study, the feasibility of using the transit time of contrast agent to assess the musculoskeletal microcirculation in the lower extremities was discussed.
In the present study, separate ROIs were used to represent the various microvasculature in the region studied: a 2 mm-diameter ROI was used to represent the arterioles in the muscles, while a 20 mm-diameter ROI was used to represent the gastrocnemius muscle group (may contain certain small blood vessels) and another 2 mm-diameter ROI was used to represent the venules in the muscle. The three ROIs were defined as the “arteriolar” ROI (entry of microcirculation), the “muscular tissues” ROI (including arterioles, capillaries and venules) and the “venular” ROI (the exit of microcirculation). Since the actual micro vessel in the microcirculation could not be detected by the resolution achieved by the system, therefore, the micro-arterioles in the microvascular bed could not be localized. In the present study, the purpose of designating ROIs was to visualize the disease-associated delay in the transit time of contrast agent. By observing the delay on the contrast agent delivery from one interval to another, the pathological changes of microcirculation was spotted indirectly.
From the results of the present study, the transit time of contrast agent from muscle to vein (M-V) and from artery to muscle (A-M) in the DM+MC group was obviously delayed, when compared with both the DM group and the control group; and the differences observed from pair-wise comparison were statistically significant. However, the differences in the transit time from artery to muscle were statistically insignificant. The possible explanation for this may be that, in the microcirculation, the blood flow in the capillaries was the slowest, while the blood volume in the vein was the largest [15], suggesting that M-V and A-V transit times were a better reflection for the pathological changes in the musculoskeletal microangiopathy. After adjusting the differences in age by ANCOVA, the differences in both M-V and A-V transit times obtained from pairwise comparisons among the three groups were all statistically significant, suggesting that the transit time of contrast agent was independent of patient’s age. In addition, as the patients in the DM+MC group had a higher (statistically significant) glycosylated hemoglobin level (a risk factor of diabetic microangiopathy) than those in the other two groups, it was reasonable to propose that the disorders in musculoskeletal microcirculation was associated with abnormal carbohydrate metabolism. The possible mechanism may be that microangiopathy blocked the blood supply and insulin deliver in the musculoskeletal tissues, resulting in insufficient oxygen and substrate supplies for the metabolism taken place in musculoskeletal tissues, and thus reducing the compensatory regeneration of muscular fibers and eventually leading to denaturation and necrosis.
The results of the present study showed higher plasma insulin levels and higher insulin resistance indexes in both DM+MC and DM groups, when compared with the control group; and the differences were both statistically significant. In the DM+MC group, hyperinsulinemia and abnormal hemorheologic conditions associated with insulin resistance were co-existed with the vascular endothelial dysfunction; endothelial injury may further exacerbate the abnormal hemorheology, forming a vicious cycle which eventually led to intravascular pool [16]. Moreover, the results of the present study showed that blood viscosity was highly correlated with the blood glucose level and CRP level; the highest blood viscosity observed in the DM+MC group indicated that blood viscosity could be another important factor affecting microangiopathy. It was proposed that elevated blood viscosity and CRP may reduce the abnormal microcirculatory function caused by reduced activity of endothelial NOS; and such increment may be associated with the extent of insulin resistance and occurrence of diabetic complications [17,18]. The increased blood viscosity may be associated with inflammation-induced protein disorder. Hence, glucose metabolism disorders, hyperinsulinemia, insulin resistance and increased blood viscosity were all the risk factors of diabetic microangiopathy.
In conclusion, the transit times (muscle-to-vein and from artery-to-vein) of contrast agent observed at CEUS scan could be used to reflect, to a certain extent, the impaired musculoskeletal microcirculation in the diabetic patients. Although, in the present study, several influential factors of transit time of contrast agent have been considered, the transit time was still subjected to other unmentioned factors (e.g. cardiac function, general metabolic function and etc.). Also, since there is neither a comparable gold standard nor a generally accepted diagnostic means able to quantify the impairment of musculoskeletal microcirculation in the leg and the small sample size adopted by this study, further large-sampled studies should be conducted in the future to support the validity of this hypothesis.
Disclosure of conflict of interest
None.
References
- 1.Rhee SY, Guan H, Liu ZM, Cheng SW, Waspadji S, Palmes P, Tai TY, Suwanwalaikorn S, Kim YS PAD-SEARCH Study Group. Multi-country study on the prevalence and clinical features of peripheral arterial disease in Asian type 2 diabetes patients at high risk of atherosclerosis. Diabetes Res Clin Pract. 2007;76:82–92. doi: 10.1016/j.diabres.2006.07.029. [DOI] [PubMed] [Google Scholar]
- 2.Foster A. An evaluation of NICE guidelines on foot care for patients with diabetes. Nurs Times. 2003;100:52–53. [PubMed] [Google Scholar]
- 3.Duerschmied D, Zhou Q, Rink E, Harder D, Freund G, Olschewski M, Bode C, Hehrlein C. Simplified contrast ultrasound accurately reveals muscle perfusion deficits and reflects collateralization in PAD. Atherosclerosis. 2009;202:505–512. doi: 10.1016/j.atherosclerosis.2008.05.046. [DOI] [PubMed] [Google Scholar]
- 4.Krix M, Krakowski-Roosen H, Armarteifio E, Fürstenberger S, Delorme S, Kauczor HU, Weber MA. Comparison of transient arterial occlusion and muscle exercise provocation for assessment of perfusion reserve in skeletal muscle with real-time contrast-enhanced ultrasound. Eur J Radiol. 2011;78:419–424. doi: 10.1016/j.ejrad.2009.11.014. [DOI] [PubMed] [Google Scholar]
- 5.Amarteifio E, Weber MA, Wormsbecher S, Demirel S, Krakowski-Roosen H, Jöres A, Braun S, Delorme S, Böckler D, Kauczor HU. Dynamic contrast-enhanced ultrasound for assessment of skeletal muscle microcirculation in peripheral arterial disease. Invest Radiol. 2011;46:504–508. doi: 10.1097/RLI.0b013e3182183a77. [DOI] [PubMed] [Google Scholar]
- 6.Lu ZY, Zhong NS. Internal Medicine. Beijing: People’s Publishing House; 2008. [Google Scholar]
- 7.Keberle M, Tony HP, Jahns R, Hau M, Haerten R, Jenett M. Assessment of microvascular changes in Raynaud’s phenomenon and connective tissue disease using colour Doppler ultrasound. Rheumatology. 2000;39:1206–1213. doi: 10.1093/rheumatology/39.11.1206. [DOI] [PubMed] [Google Scholar]
- 8.Vestergaard H. Studies of gene expression and activity of hexokinase, phosphofructokinase and glycogen synthase in human skeletal muscle in states of altered insulin-stimulated glucose metabolism. Dan Med Bull. 1999;46:13. [PubMed] [Google Scholar]
- 9.Womack L, Peters D, Barrett EJ, Kaul S, Price W, Lindner JR. Abnormal skeletal muscle capillary recruitment during exercise in patients with type 2 diabetes mellitus and microvascular complications. J Am Coll Cardiol. 2009;53:2175–2183. doi: 10.1016/j.jacc.2009.02.042. [DOI] [PMC free article] [PubMed] [Google Scholar]
- 10.Duerschmied D, Olson L, Olschewski M, Rossknecht A, Freund G, Bode C, Hehrlein C. Contrast ultrasound perfusion imaging of lower extremities in peripheral arterial disease: a novel diagnostic method. Eur Heart J. 2006;27:310–315. doi: 10.1093/eurheartj/ehi636. [DOI] [PubMed] [Google Scholar]
- 11.Duerschmied D, Maletzki P, Freund G, Olschewski M, Seufert J, Bode C, Hehrlein C. Analysis of muscle microcirculation in advanced diabetes mellitus by contrast enhanced ultrasound. Diabetes Res Clin Pract. 2008;81:88–92. doi: 10.1016/j.diabres.2008.03.002. [DOI] [PubMed] [Google Scholar]
- 12.Stepp DW, Chantemele D, Belin EJ. Structural remodeling in the limb circulation: impact of obesity and diabetes. Microcirculation. 2007;14:311–316. doi: 10.1080/10739680701285609. [DOI] [PubMed] [Google Scholar]
- 13.Baum O, Djonov V, Ganster M, Widmer M, Baumgartner I. Arteriolization of Capillaries and FGF-2 Upregulation in Skeletal Muscles of Patients with Chronic Peripheral Arterial Disease. Microcirculation. 2005;12:527–537. doi: 10.1080/10739680591003413. [DOI] [PubMed] [Google Scholar]
- 14.Ding H, Li N, Lin XY, Fan PI, Wang WP, Wang JY. Feasibility of contrast-enhanced ultrasonography in the evaluation of liver fibrosis and screening of quantitative parameters. Fudan University Journal of Medical Sciences. 2010;3:5. [Google Scholar]
- 15.Levick JR, Rodney J. An introduction to cardiovascular physiology. Arnold London: 2003. [Google Scholar]
- 16.Clerk LH, Vincent MA, Barrett EJ, Lankford MF, Lindner JR. Skeletal muscle capillary responses to insulin are abnormal in late-stage diabetes and are restored by angiogensin-converting enzyme inhibition. Am J Physiol Endocrinol Metab. 2007;293:E1804–E1809. doi: 10.1152/ajpendo.00498.2007. [DOI] [PubMed] [Google Scholar]
- 17.Kalani M. The importance of endothelin-1 for microvascular dysfunction in diabetes. Vasc Health Risk Manag. 2008;4:1061. doi: 10.2147/vhrm.s3920. [DOI] [PMC free article] [PubMed] [Google Scholar]
- 18.Mineo C, Gormley AK, Yuhanna IS, Osborne-Lawrence S, Gibson LL, Hahner L, Shohet RV, Black S, Salmon JE, Samols D, Karp DR, Thomas GD, Shaul PW. FcgammaRIIB mediates C-reactive protein inhibition of endothelial NO synthase. Circ Res. 2005;97:1124–1131. doi: 10.1161/01.RES.0000194323.77203.fe. [DOI] [PubMed] [Google Scholar]


