

Abstract
Pancreatic cancer occurs in the setting of a profound fibrotic microenvironment that often dwarfs the actual tumor. While pancreatic fibrosis has been well-studied in chronic pancreatitis, its development in pancreatic cancer is much less well understood. This manuscript describes the dynamic remodeling that occurs from pancreatic precursors (PanINs) to pancreatic ductal adenocarcinoma, highlighting similarities and differences between benign and malignant disease. While collagen matrix is a commonality throughout this process, early stage PanINs are virtually free of periostin while late stage PanIN and pancreatic cancer are surrounded by an increasing abundance of this extracellular matrix protein. Myofibroblasts also become increasingly abundant during progression from PanIN to cancer. From the earliest stages of fibrogenesis, macrophages are associated with this ongoing process. In vitro co-culture indicates there is cross-regulation between macrophages and pancreatic stellate cells, precursors to at least some of the fibrotic cell populations. When quiescent pancreatic stellate cells were co-cultured with macrophage cell lines, the stellate cells became activated and the macrophages increased cytokine production. In summary, fibrosis in pancreatic cancer involves a complex interplay of cells and matrices that regulate not only the tumor epithelium but the composition of the microenvironment itself.
Pancreatic ductal adenocarcinoma (PDAC), the most common pancreatic cancer, varies from many epithelial malignancies in that it is surrounded by an extensive stromal microenvironment, often much more extensive than the tumor itself (1, 2). Multiple functions have been proposed for this expansive stromal microenvironment including paracrine signaling that regulates tumor growth and dissemination, restriction of blood flow, and selective restriction of inflammatory infiltration (3). This microenvironment has a large fibrotic component, in some respects similar to that seen in benign pancreatic disease such as chronic pancreatitis; however, the morphological appearance has also been reported to vary from that of chronic pancreatitis and the term “desmoplasia” has been used to distinguish tumor-associated fibrosis from benign fibrosis.
PDAC is thought to arise from benign precursors called pancreatic intraepithelial neoplasias or PanINs (4). Although patients are rarely diagnosed prior to full-blown pancreatic cancer, PanIN lesions occur in conjunction with PDAC and exhibit an array of increasing atypia and architectural changes suggesting that they are indeed precursors to cancer. PanIN1 is characterized by mucinous columnar cells that have little to no nuclear atypia. Although these lesions are seen in PDAC patients, similar lesions are also seen in normal pancreas and in chronic pancreatitis patients and so are sometimes called “PanIN1-like” lesions. In progression to cancer, PanIN2 lesions acquire nuclear atypia such as nuclear enlargement. In further progression to PanIN3, equivalent to carcinoma in situ, further nuclear atypia, cribriforming and luminal budding are also observed. Although an extensive fibrotic microenvironment surrounds PDAC lesions, little is known about its progression during tumorigenesis or how it might vary from benign fibrotic diseases such as chronic pancreatitis.
Most of our knowledge of fibrogenesis comes from studies of benign disease in which a significant portion of pancreatic fibrosis arises from activation of pancreatic stellate cells (PaSCs). PaSCs are mesenchymal cells that are found in a quiescent state scattered through the healthy pancreas. Normally, these cells function in maintenance of basement membrane integrity (5). However, upon activation by damage or by growth factor signaling, PaSCs become highly proliferative and differentiate into myofibroblasts expressing α smooth muscle actin (αSMA) and producing abundant fibrotic extracellular matrix (ECM) proteins such as collagen I (6). When activated by culturing ex vivo, PaSCs from normal pancreas tend to be homogenous cells producing both ECM proteins such as collagen I and expressing αSMA (1). In vivo, fibrosis tends to be more heterogeneous, suggesting that activated PaSCs are not uniform or that cells other than PaSCs also give rise to pancreatic fibrosis.
In this manuscript, we determine the patterns of activation of fibrotic cells in both benign and malignant disease and demonstrate differences not only with etiology but also with disease progression. Furthermore, we show that fibrogenesis occurs simultaneously with macrophage infiltration and that macrophages can regulate key features of fibrogenesis.
Materials and methods
Tissues, antibodies and reagents
Human tissues were obtained with approval from the Vanderbilt Institutional Review Board. Paraffin blocks from 11 PDAC patients and 46 chronic pancreatitis patients were analyzed. Additionally, we analyzed 4 tissue microarrays consisting of 64 PDACs, 27 PanIN1, 25 PanIN2, and 19 PanIN3 lesions.
Mice were maintained with approval from the Vanderbilt or St Jude Institutional Animal Care and Use Committee. Ptf1aCre (7), LSL-KrasG12D (8), and Cdkn2a+/- (9) mice have all been described. Tissues were fixed with 4% paraformaldehyde, paraffin-embedded and processed as described (10).
Antibodies and reagents
Human tissues were labeled with the following antibodies: mouse anti-αSMA (clone 1A4, Dako, Carpineria, CA), rabbit anti-periostin (Abcam, Cambridge, ENG), mouse anti-CK19 (Dako clone RCK-108), mouse anti-CD68 (Dako clone KP1), and mouse anti-CD163 (Novocastra/Leica, New Castle Upon Tyne, ENG). Mouse tissues were labeled with the same αSMA and periostin antibodies and with F4/80 (clone A3-1, AbD Serotec, Raleigh, NC). Fibrillar collagen I was detected by Gomori trichrome (Newcomer Supply, Middleton, WI). Double immunofluorescence was performed using TSA-Plus kits (Perkin Elmer LAS, Boston, MA) and counterstained with Toto3 (Molecular Probes, Eugene, OR). For double immunofluorescence with same species antibodies, slides were boiled after the first antibody’s TSA reaction, then labeling was repeated with the second primary antibody. Controls always included slides which lacked either the first or second primary antibody to validate that boiling removed all of the first antibody.
IPS-1 cells were labeled with CellTracker Green CMFDA (Molecular Probes, Eugene OR) and RAW264.7 and BMDM-WT cells were labeled with CellTracker Red CMTPX (Molecular Probes) as per manufacturer’s instructions.
Images
Brightfield microscopic tissue images were captured on an Axioskop 40 microscope (Carl Zeiss Microimaging, Thornwood, NY). Fluorescent images were captured on a Confocal LSM510 microscope (Carl Zeiss Microimaging).
Cell culture
IPS-1 (11), RAW264.7 (12) and immortalized BMDM-WT cells (13) were all previously described. IMPF-1 (immortalized mouse pericryptal fibroblast-1) cells were isolated similarly to the IPS-1 cells (11). Conditionally immortalized pericryptal fibroblasts were isolated from the colon of Immortomice (14) by the Novel Cell Line Core Facility of the Vanderbilt University DDRC. These mice harbor a temperature sensitive mutation in a transgene encoding the SV40 large T antigen so that this protein is in its active conformation only at the permissive temperature of 33°C. Colons were removed from young adult “Immortomice” and colonic crypts were removed by incubation in 0.3% EDTA, 0.05% DTT in PBS as previously described (15). The remaining colon tissues were then incubated in 0.3% Pancreatin and cells liberated from the empty crypt pockets were collected, centrifuged and cultured in RPMI 1640 plus 5%FCS, ITS and 5 U/ml IFNγ (Roche, Indianapolis, IN) at 33°C as described for other conditionally immortalized cells (15). All cells were maintained in RPMI-1640 (Gibco, Grand Island, NY), 10% fetal bovine serum (Atlantic Biological, Lawrenceville, GA) and 50 U/ml penicillin, 50 μg/ml streptomycin (Gibco). Additionally, IPS-1 and IMPF-1 cells were maintained in 5 U/ml IFNγ and kept at 33°C unless indicated.
For IPS-1 activation assays and for cytokine analysis, IPS-1 cells were first cultured for 3 days on a thick layer of matrigel (16). They were released from the matrigel with dispase, washed several times in PBS, mixed with RAW264.7 cells, BMDM cells or media, then mixed with an equal volume neutralized rat tail collagen (BD Biosciences) and plated in 24-well dishes. Media minus IFNγ with or without recombinant heparin-binding epidermal growth factor-like growth factor (rHB-EGF) (R&D Systems, Minneapolis, MN) was added and cells were cultured for 3 days at 37°C. Cells were fixed in 4% paraformaldehyde for fluorescent imaging of vital dyes or for immunofluorescence. Immunofluorescence was performed in the absence of vital dyes. Media was collected for cytokine analysis.
For macrophage polarity studies, RAW264.7 cells were incubated alone or with an equal numbers of IPS-1 or IMPF-1 cells on plastic tissue culture dishes at 37°C in the absence of IFNγ. Cells were harvested for RNA after 3 days. To test effects of IPS-1 conditioned media, RAW264.7 cells were plated alone in 3-dimensional collagen matrix as described above. One day after plating, media was removed and replaced with 50% fresh media + 50% media from activated IPS-1 cells. Two days later, cells were harvested for RNA analysis.
For oil red O staining, cells were removed from collagen matrix with collagenase P (Roche), washed in PBS and stained in freshly prepared 0.3% oil red O for 15 min. then washed extensively before photographing.
Cytokine analysis
Quiescent IPS-1 cells and RAW264.7 cells were cultured alone or together in a collagen matrix and the media was collected after 3 days. 4-6 samples were collected from each culture condition. Multiple cytokines were quantified in the cell culture supernatant using the MILLIPLEX MAP Mouse Cytokine/Chemokine Magnetic Bead Panel (Millipore) according to the manufacturer’s instructions, using a Luminex FLEXMAP 3D instrument.
qRT-PCR
mRNA was isolated using the RNeasy Mini Kit (Qiagen, Germantown, MD). Quantitative reverse transcription-polymerase chain reaction (qRT-PCR) was performed using the Roche Transcriptor Universal Kit and analyzed on the Lightcycler 480 II (Roche). Primers used were: 5’tggccaccaagctgaact3’ and 5’ttcatgataacgtttctggctct3’ (iNOS), 5’gaatctgcatgggcaacc3’ and 5’gaatcctggtacatctgggaac3’ (Arg1), 5’tgcccttgctgttcttctct3’ and 5’gtggaatcttccggctgtag3’ (CCL3), 5’gtgctgctggagcagttgt3’ and 5’tcgggatccccagagagt3’ (CSF3), and 5’gggtggctctgactactctaagat3’ and 5’acacgtagtcaaacttctcaatgact3’ (PMM1, normalization control). All primers were synthesized by Integrated DNA Technologies (Coralville, IA).
Results
Dynamic remodeling of the stromal microenvironment accompanies PanIN to PDAC progression
To understand key features of the tumor microenvironment that are specific to pancreatic cancer and not benign disease, we first compared fibrotic components associated with PDAC and with its benign precursor lesions, PanINs, and with normal pancreatic ducts. We examined both individual tissue blocks as well as tissue microarrays. Four tissue microarrays contained 64 PDACs, 27 PanIN1, 25 PanIN2, and 19 PanIN3 lesions. We focused on four major components of the tumor microenvironment: two matrix proteins, collagen I (17) and periostin (18), and two cellular components, macrophages (19, 20) and myofibroblasts (21, 22), contractile cells that may function in the tensile strength of the matrix.
Normal main duct or interlobular ducts (Figure 1A-C) are encased in a cuff of collagen-I-enriched matrix stained with aniline blue via Gomori’s trichrome. Within this matrix, most αSMA is specific to the smooth muscle surrounding blood vessels; similarly, the small amount of periostin observed surrounds blood vessels. Around PanIN1 lesions (Figure 1D-F), the earliest neoplastic precursor to PDAC, the collagen-I-enriched matrix becomes expanded in thick, well-organized parallel bundles of fibers. A thin, well-defined layer of αSMA+ myofibroblasts surrounds the epithelium with small numbers also scattered through the surrounding collagen matrix. There remains little or no periostin surrounding PanIN1 lesions unless they are in close proximity to invasive PDAC regions. As lesions progress to PanIN2 (Figure 1G-I), there is little apparent change in the collagen matrix compared to PanIN1, but myofibroblasts begin to expand in number. There is considerable variation in the extent of this expansion with some PanIN2 lesions showing matrix similar to that of PanIN1 lesions and others having discrete regions of abundant myofibroblasts clustered close to the epithelium. Regardless of the abundance of αSMA+ myofibroblasts, they appear to have parallel elongated orientations, reflecting the orientation of fibers in the collagen matrix. In PanIN2 lesions, there are also variable and discrete regions of periostin immediately adjacent to the epithelium. In PanIN3 lesions (Figure 1J-L), the parallel orientation of the collagen matrix becomes regionally disrupted, with some loss of the well-organized parallel arrangement of fiber bundles. αSMA+ myofibroblasts become uniformly abundant near the epithelium as does periostin production. Surrounding PDAC lesions (Figure 1M-O), the disorganization of the collagen matrix is more severe and staining with aniline blue is often weaker. Myofibroblasts and periostin production are abundant and overlapping throughout the entire matrix, not just juxtaposed to epithelium as in PanIN3 lesions. The seemingly random orientation of the myofibroblasts reflects the disorganization of the collagen matrix. When PanIN lesions are in close proximity to regions of tumor invasion, they too are sometimes engulfed in this dense αSMA+, periostin+ microenvironment (data not shown). While the structure of the collagen matrix appears disrupted immediately surrounding PDAC lesions, there are frequently bands of well organized collagen bundles that form dense myofibroblast- and periostin-rich structures that tend to encapsulate the tumor with little invasion occurring through this scar-like tissue (Supplemental Figure S1).
Figure 1. The microenvironment undergoes dynamic changes from pancreatic precursor lesions to cancer.
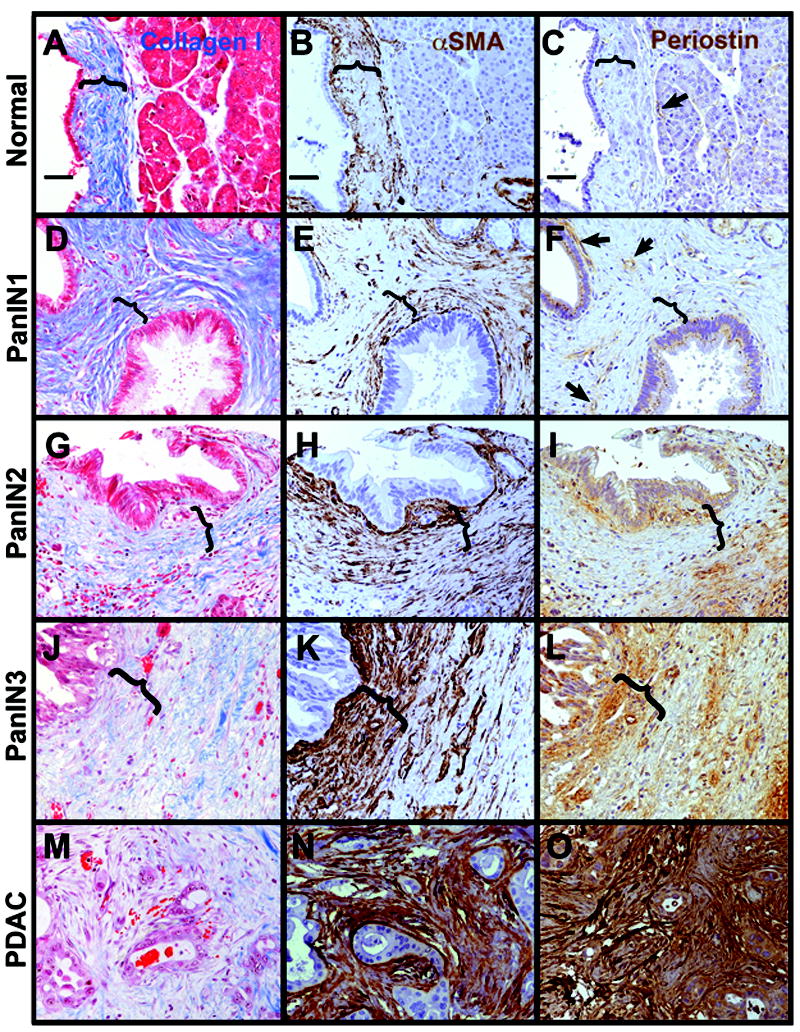
A-C, normal duct. D-F, PanIN1. G-I, PanIN2. J-L, PanIN3. M-O, PDAC. Tissues were labeled with trichrome for collagen I (blue in A,D,G,J,M with cells counterstained in red), αSMA (brown in B,E,H,K,N with nuclei dark blue and cell cytoplasm light blue) or periostin (brown in C,F,I,L,O). Note that in normal pancreas, most fibrillar collagen is found in stromal cuffs (marked by parenthesis) around larger ducts and blood vessels, becomes more extensive as organized parallel bundles around PanIN lesions, but becomes disrupted in structure around PanIN3 and most particularly around PDAC lesions. Myofibroblasts (αSMA+ cells not associated with blood vessels) form narrow cuffs around normal ducts and PanIN1s, but begin to expand focally around PanIN2, more extensively around PanIN3, and are dense and disorganized around PDAC. Periostin in the normal pancreas is restricted primarily to blood vessels (arrows in C and F), is occasionally detected in PanIN1 epithelium and more often in epithelium of advanced PanINs and PDAC. In the stroma, periostin becomes detectable focally adjacent to PanIN2, more widespread around PanIN3s, and extensively around PDAC. Parentheses mark areas of organized collagen surrounding normal ducts, PanIN1 and PanIN2 (A-I) and areas where this collagen organization is lost in PanIN3 (J-L). Size bars, 50 μm. All images presented at the same magnification.
We and others previously reported that macrophages were abundant around PDAC lesions (19, 20, 23). Here, we show that macrophages have non-uniform patterns of localization in PDAC tissues. CD68+ macrophage abundance was fairly uniform at all PanIN stages (Supplemental Figure S2A-C). However, within the broader tumor microenvironment, macrophages were not uniformly distributed. Regions of dense well-organized collagen bundles contained far fewer macrophages than immediately juxtaposed areas, suggesting that these structures excluded most macrophages (Supplemental Figure S2D-F). Regions of dense, parallel myofibroblasts also had lower numbers of macrophages even when close to sites of tumor invasion (Supplemental Figures S2G-I and S3). In regions of disrupted collagen where tumor invasion occurred principally as single cells, macrophages were highly concentrated around the leading edge of the invading cells (Supplemental Figure S2E,F). Where tumor cells were invading as small clusters of cells, macrophages were abundant but more randomly scattered than at sites of single cell invasion (Supplemental Figure S2H,I). Note that in areas immediately surrounding tumor epithelium, macrophages had a more flattened, elongated morphology and did not label as brightly with CD68 antibodies as compared to infiltrating macrophages (compare panels S2H,I to S2G). Because CD68 may label other myeloid cells in addition to macrophages, we co-labeled three PDAC and three chronic pancreatitis samples with CD68 and CD163, another macrophage marker (24) (Supplemental Figure S4 and data not shown). The majority of CD68+ cells in all pancreatic tissues were also CD163+, with only rare CD68+, CD163- cells present. However, the relative abundance of CD68 to CD163 varied considerably cell-to-cell. This may reflect different expression levels in different populations of macrophages within these tissues (25). This is in contrast to cells in other locations, such as in a large blood vessel in the duodenal muscularis that was present in one of the PDAC blocks (Supplemental Figure S4 inset). In this blood vessel, the majority of CD68+ cells were CD163-.
Fibrosis in chronic pancreatitis progresses differently than in PanINs
We next compared the dynamic modulation of the fibrotic microenvironment in PanIN/PDAC progression to the progression of fibrosis in chronic pancreatitis, a benign disease. We examined tissue from 46 patients, 22 with alcoholic, 7 with hereditary, 7 with autoimmune, 4 with pancreatic divisum, and 6 with tumor-associated chronic pancreatitis. We found little difference in the composition of the fibrosis, only a difference in the extent of fibrosis and the extent of inflammatory infiltrate which both varied patient to patient without apparent correlation with etiology.
Whereas PanIN progression showed first a large increase in collagen matrix without periostin and with small numbers of myofibroblasts, chronic pancreatitis did not show this sequence. In regions of pancreas that still maintained acinar parenchyma surrounded by more limited fibrosis, both myofibroblasts and periostin were observed within acinar lobules while well-organized collagen bundles were confined principally to the septa between lobules (Figure 2A-C). Within acinar lobules, periostin was more widespread than myofibroblast cells between individual acini, while myofibroblasts were more abundant in septal regions separating lobules. In regions where fibrosis was well-established with few if any acini remaining, collagen matrix, myofibroblasts and periostin were all uniformly present (Figure 2D-F). To better understand how the pattern of collagen matrix arises, we examined chronic pancreatic tissues at low magnification (Figure 2G,H). In areas peripheral to densely fibrotic regions where acinar architecture was largely or partially intact, thick collagen bundles could be seen surrounding acinar lobules as well as bridging them in somewhat linear structures. These bridging structures could often be seen to follow ducts or blood vessels through the lobule. In these regions peripheral to the bulk of fibrosis, myofibroblasts were sparse in the collagen bridges although they were frequently localized immediately adjacent to and within acinar lobules (Figure 2I).
Figure 2. Chronic pancreatitis comprises a microenvironment that is continuously rich in collagen, myofibroblasts, periostin and macrophages.
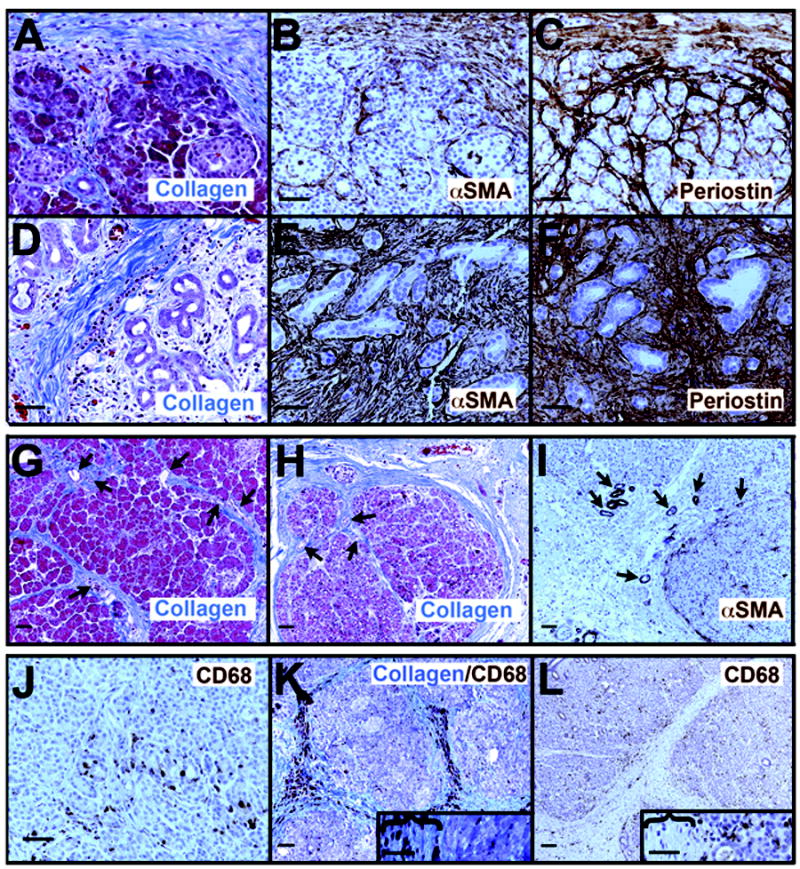
A-C, collagen (A, blue color) forms dense bundles surrounding the acinar lobules and sometimes bridging through them, while myofibroblasts (B, αSMA+ brown color) and periostin (C, brown) are found both within and surrounding the lobule. Within the lobule, periostin is consistently more abundant and deeper within the lobule than are the myofibroblasts. In areas of acinar-to-ductal metaplasia (D-F), collagen fibers, myofibroblasts and periostin are all abundant. At lower magnification (G-I), the pattern of collagen fibers (G,H) can be seen to surround remaining acinar lobules, bridging through them along tracts that frequently can be seen to contain small ducts or blood vessels (arrows). When acinar lobules are still relatively intact, myofibroblasts are found primarily at the edges of and within lobules rather than within the matrix separating lobules (I). J. Macrophages, labeled by CD68 antibodies (brown), are present at the earliest morphological stages of ADM where both acinar-like and duct-like cells line small irregular lumina. K, L. Where collagen bundles form bridge structures around and through acinar lobules, only rarely are macrophages concentrated in these structures (K) but are more commonly enriched at the edges and within lobules (L). Insets in K and L show magnified views with collagen bridges (marked by parentheses) and acinito the right of each. Size bars, 50 μm.
Macrophages were abundant in chronic pancreatitis tissues, regardless of the degree of fibrosis (Figure 2J-L). Macrophages were concentrated around early ADM lesions as they are in PDAC tissues (23) as well as throughout fibrotic tissue. To determine if macrophages were actively infiltrating along blood vessels, we co-labeled for collagen I and CD68 (Figure 2K). Only 2 of 10 tissues examined had enrichment along these structures while most had macrophages more concentrated outside of these areas (shown in Figure 2L without collagen staining for better visualization).
Acinar-to-ductal metaplasia (ADM) occurs concomitantly with fibrogenesis
ADM, the replacement of acinar mass with ductal structures, is a common feature of both chronic pancreatitis and PDAC tissue. In mouse, ADM has been shown to arise from transdifferentiation of acinar cells into ductal cells and to be a precursor of PanIN-like lesions (26-29). Therefore, we investigated whether ADM was associated with a common microenvironment in chronic pancreatitis and in PDAC. When ADM occurred in acinar-rich regions of either PDAC or chronic pancreatitis, it was associated with collagen I, periostin and myofibroblasts. Even from the earliest stages of transition from acinar cells to ductal cells (Figure 3A-C), thin collagen strands, many myofibroblasts, and periostin were present. In chronic pancreatitis, ADM lesions continued to be surrounded by all three markers of fibrosis (Figure 3D,E and data not shown). Notably, even mucinous ADM lesions with PanIN1-like morphology were surrounded by a periostin-rich microenvironment in chronic pancreatitis (Figure 3E) unlike PanIN1 lesions seen in PDAC tissues. In PDAC tissues, even most of the established ADM lesions (defined here as no longer bearing any acinar characteristics) were devoid of periostin in their immediate microenvironment although the epithelium was sometimes positive by immunolabeling (Figure 3F).
Figure 3. Fibrogenesis initiates in conjunction with acinar-to-ductal metaplasia.
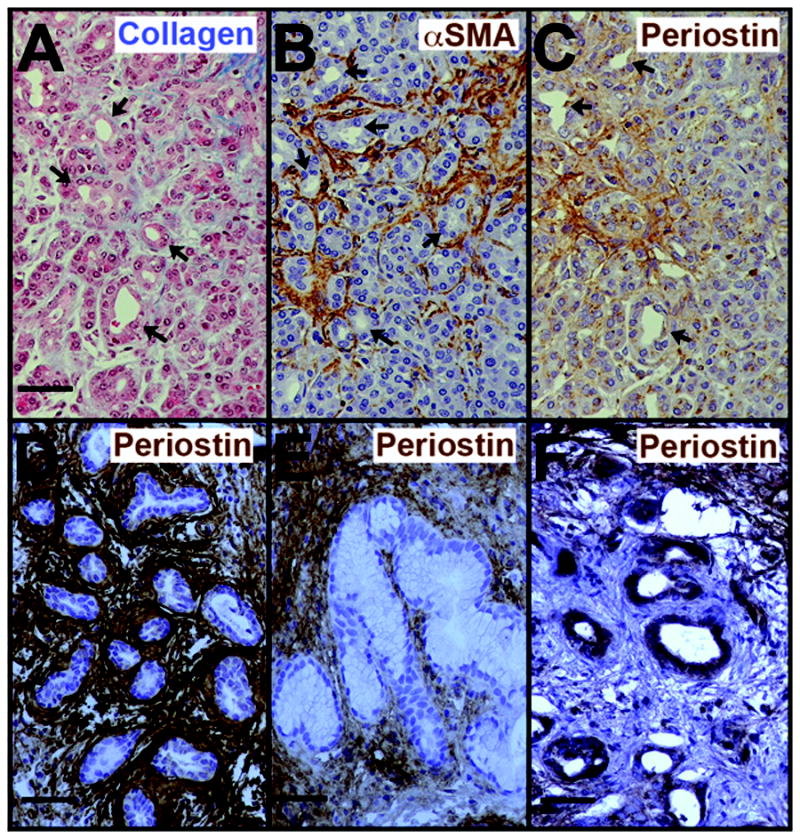
A-C. At the earliest stages of ADM, evidenced by small, irregular lumina lined by cells of both acinar and ductal morphologies (arrows), collagen fibers are found amongst the acini (A), myofibroblasts are uniformly abundant (B), and periostin is present in the surrounding matrix (C). D, E. In chronic pancreatitis, periostin continues to be present surrounding even established ADM lesions (defined as lacking any acinar characteristics), including ones with PanIN1-like morphology (E). F. In PDAC tissues, most ADM lesions found within the tumor microenvironment are lacking periostin in their surrounding stroma although the epithelium may be positive. Note the periostin-rich stroma near but not abutting the ADM lesions in the upper right and lower left corners of F. Labeling colors are as in Figure 1. Size bars, 50 μm.
Mouse models of PanIN and PDAC recapitulate key features of human disease
Mouse models that express a Kras oncogene in the pancreas recapitulate many of the epithelial phenotypes associated with human PDAC development (30). We found that key characteristics of the tumor microenvironment were also similar in comparisons of mouse and human pancreatic lesions. In young Ptf1aCre; LSL-KrasG12D (KC) mice, ADM lesions were surrounded by myofibroblasts and periostin as well as thin collagen fibers (Supplemental Figure S5A-C). In 6 older KC mice, most of the pancreas was replaced by fibrosis, ADM and PanIN1-like lesions (Supplemental Figure S5D-F). The microenvironment of ADM lesions were similar to that seen in younger mice. However, PanIN1 lesions could be divided into two categories based on their microenvironment. Many PanIN1-like lesions were devoid of surrounding periostin as in human PanIN1 while other PanIN1-like lesions were surrounded by a cuff of periostin-rich matrix more similar to ADM lesions seen in chronic pancreatitis. In PDAC occurring in Ptf1aCre; LSL-KrasG12D; Cdkn2a+/- mice lacking the tumor suppressor p16/p19Ink4A/Arf, myofibroblasts and periostin immunoreactivity patterns were similar to those seen in human PDAC (Supplemental Figure S5G,H). Macrophages, which we showed previously were abundant around ADM in mice (23) were also abundant at the PDAC invasive front as in human disease (Supplemental Figure S5I). The major difference between human and this model of mouse PDAC was a higher density of epithelium in the mouse model concomitant with less stroma, although the stroma present was similar in composition. The other key difference was the presence of a periostin-rich cuff surrounding some PanIN1-like lesions.
Crosstalk between macrophages and stellate cells regulates fibrogenesis
In both chronic pancreatitis and PDAC tissues, the most localized and therefore possibly the earliest induction of fibrosis was seen around forming ADM lesions where both macrophages and myofibroblasts were present. Therefore, we designed experiments to determine if interaction between these cells regulated fibrogenesis. We focused on conversion of quiescent pancreatic stellate cells (PaSCs) to αSMA+ myofibroblasts and on production of cytokines by macrophages. In a three-dimensional collagen matrix, we co-cultured quiescent IPS-1 cells, an immortalized PaSC cell line, with two different macrophage cell lines, RAW264.7 and BMDM-WT. To distinguish each cell type, we fluorescently labeled IPS-1 cells with a green vital dye and the macrophage lines with a red vital dye. When IPS-1 cells were maintained on plastic, these cells exist in an activated state as myofibroblasts (11) as do primary PaSCs (31, 32). However, when cultured on top of matrigel for three days, IPS-1 cells reverted to a quiescent state as has been reported for both hepatic stellate cells and PaSCs (16, 33). On matrigel, IPS-1 cells formed clusters of cells that downregulated αSMA expression and contain cytoplasmic lipid droplets that can be detected by oil red O (Supplemental Figure S6 and data not shown). When removed from matrigel and suspended in collagen matrix, the IPS-1 cells maintained this quiescence in the presence or absence of the growth factor HB-EGF (Figure 4A an Supplemental Figure S7A). Addition of TGFβ to these quiescent cells was similarly insufficient to induce any phenotypic change in these cells (data not shown). However, when these quiescent IPS-1 cells were co-cultured with the RAW264.7 macrophage-derived cell line, the cells underwent morphological changes consistent with PaSC activation (Figure 4B). IPS-1 cells formed lamellopodia and filopodia extending from clusters and some cells appeared to migrate from these clusters. Without macrophage cell co-culture, IPS-1 cell clusters had no or 1 filopodial protrusion each. When the growth factor HB-EGF was added to IPS-1/RAW264/7co-culture, few intact clusters remained, with most IPS-1 cells appearing as single cells with elongated, fibroblastoid morphology. In cultures that were not labeled with vital dye fluorophores, these single cells were positive for αSMA immunolabeling, indicative of PaSC activation (Figure 4C). Immortalized BMDM cells gave a similar extent of IPS-1 activation (Supplemental Figure S7).
Figure 4. Macrophage cells activate IPS-1 cells.
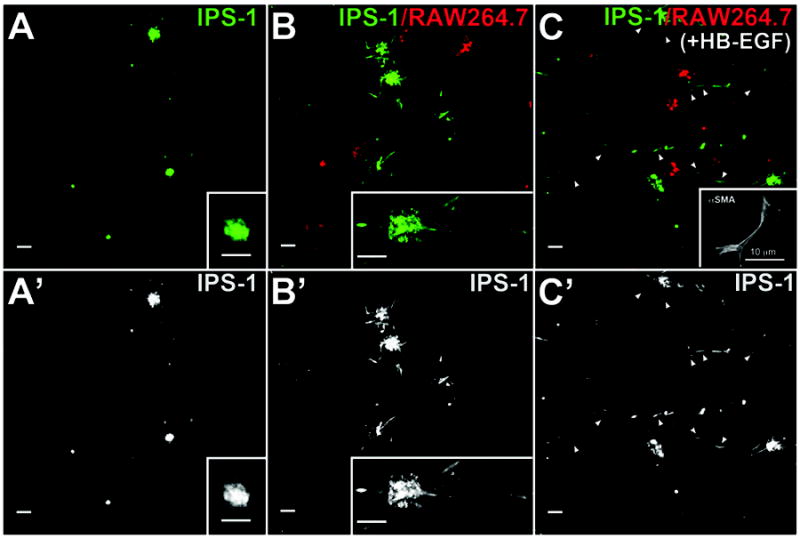
Quiescent IPS-1 cells, labeled with a green fluorophore, were placed in three-dimensional collagen matrix with or without RAW264.7 cells labeled with a red fluorophore, and with or without addition of growth factor HB-EGF. A. Without addition of either RAW264.7 or immortalized BMDM cells, IPS-1 cells maintained a quiescent morphology and rarely formed protrusions or migrated from cell clusters even when cultured with HB-EGF. B. When co-cultured with RAW264.7 cells, IPS-1 cells adopted an elongated morphology consistent with an activated phenotype with some cells extending away from cell clusters. C. When the IPS-1/Raw264.7 co-cultures were treated with HB-EGF, the majority of cells were present as single cells (arrowheads) rather than clusters. Many of these single cells were αSMA-positive (inset in C). Insets in A and B, higher magnification of fluorophore-labeled IPS-1 cells. Inset in C, immunofluorescence for αSMA in cells that were not fluorophore labeled during culture. A’-C’: IPS-1 fluorescence alone from panels A-C. Size bars, 50 μm, except as indicated in panel C inset.
To understand how macrophages could be triggering stellate cell activation, we analyzed cytokines produced by cells cultured alone or together. Surprisingly, quiescent IPS-1 cells produced high levels of two chemokines known to act on macrophages, IL-6 and MCP-1 (34), as well as KC/CXCL1. RAW264.7 cells alone produced a low level of a number of cytokines. However, co-culture with IPS-1 cells dramatically increased the amount of many of these cytokines, notably G-CSF/CSF3, MCP-1, MIP-1α/CCL3, MIP-1β/CCL4, MIP-2/CXCL2 and TNF. Because these cells were cultured together, we could not know which cell type was expressing which cytokine, but CCL3, CXCL2 and TNF are commonly associated with production by macrophages.
Macrophages can have a range of function including pro-inflammatory and immunosuppressive functions, sometimes characterized as M1 and M2 types, respectively, although increasing evidence points to a range of different macrophage subtypes (35). The cytokines produced by co-culture of IPS-1 with RAW264.7 cells did not give a clear indication of either an M1 or M2 polarity. For example, high production of TNF and MCP-1 would suggest an M1 polarity but the lack of IL-1β and IL-12 do not (36). There is some induction of IL-10 but it is low and lack of IL-13 suggest that M2 polarity was also not induced (36). Therefore, we also analyzed genetic markers of macrophage activation. iNOS, encoding inducible nitric oxide synthase, is a key marker of M1 type macrophages while Arg1, encoding the Arginase I enzyme, is a common marker of M2 type macrophages in mice. We compared expression of iNOS and Arg1 in RAW264.7 cells alone or co-cultured with either IPS-1 cells or IMPF-1 cells. IMPF-1 cells are immortalized pericryptal fibroblasts isolated from mouse colon which likely contains a different stromal microenvironment. Co-culture of RAW264.7 cells with IPS-1 cells induced a 7-fold elevation in iNOS mRNA while IMPF-1 cells induced a greater than 1000-fold increase in iNOS compared to that in RAW264.7 cells cultured alone (Figure 6A). Arg1 mRNA was induced similarly (17-fold) by both IPS-1 and IMPF-1 cells (Figure 6B) relative to Arg1 in RAW264.7 cells cultured alone. From these results, we conclude that IPS-1 cells alter cytokine production without inducing a clear M1 or M2 phenotype.
Figure 6. IPS-1 cells alter gene expression but do not polarize RAW264.7 cells to either M1 or M2 type.
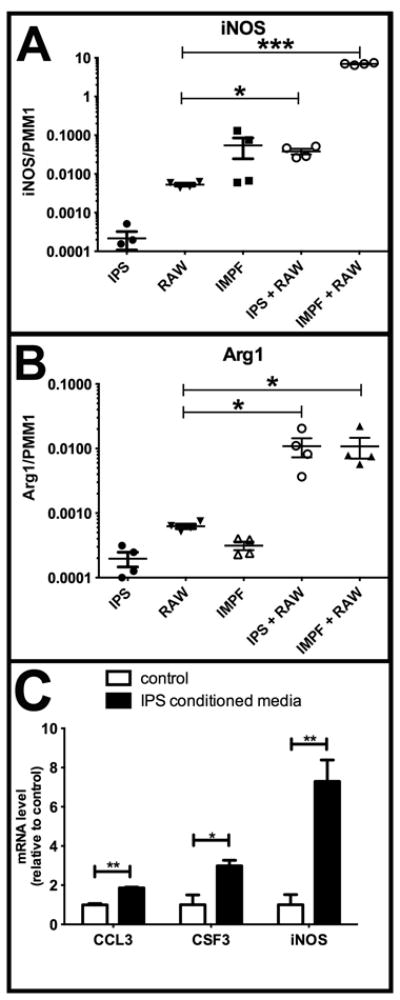
A, B. IPS-1 cells, IMPF-1, and RAW264.7 cells were cultured alone or together as indicated on plastic tissue culture dishes for three days. mRNA was then analyzed for iNOS and Arg1 relative to the PMM1 mRNA control. IPS-1/RAW264.7 co-culture increased iNOS 7-fold while IMPF-1/RAW264.7 co-culture increased iNOS more than 1000-fold over RAW264.7 alone. Co-culture of RAW264.7 with either IPS-1 or IMPF-1 increased Arg1 mRNA 17-fold over the level in RAW264.7 cultured alone. C. RAW264.7 cells were cultured alone in collagen matrix with conditioned media from IPS-1 cells (black bars) or control media (white bars) for two days prior to harvest. mRNA was then analyzed for the genes indicated, normalized to the PMM1 housekeeping gene and then normalized to level in control media. N = 4 for each group. *, P<0.05; **, P<0.01; ***,P<0.001.
To determine whether changes in gene expression and cytokine production were occurring in macrophages rather than IPS-1 cells in co-culture, we plate RAW264.7 cells alone in collagen matrix. Conditioned medium from activated IPS-1 cells was then added to the top of this collagen-cell matrix with an equal amount of fresh medium to avoid nutrient depletion effects. Following two days of IPS-1-conditioned medium but not control medium, expression of CCL3, CSF3/, and iNOS all increased in expression (Figure 6C). TNF mRNA level did not increase with IPS-1-conditioned media (data not shown). No increase in cytokine expression was observed when RAW264.7 cells were cultured on plastic. The increase in CCL3 and CSF3 mRNA when cultured in collagen was much less than the increase in protein detected in the media of co-cultured cells. This may be due to the dilution of paracrine factors, the need for juxtacrine activity, post-translational regulation, or to partial expression by IPS-1 cells in the co-culture experiments. However, these results do clearly indicate that secreted factors from IPS-1 cells can alter gene expression in a macrophage cell line.
Discussion
The patterns of fibrosis vary between PDAC and chronic pancreatitis
Our results demonstrate a dynamic rearrangement of the dense fibrotic microenvironment that occurs in progression from PanIN to PDAC. Fibrosis is observed at the earliest stages of acinar-to-ductal metaplasia, and remains a prominent feature surrounding all stages of PanIN and PDAC lesions. However, the composition of this fibrotic response changes as PanINs progress to PDAC. Early PanINs have a collagen-I-rich cuff similar to but more extensive than that seen around normal large ducts of the pancreas. As PanINs progress to late stage PanIN and to PDAC, there is a gradual increase in myofibroblasts and a more dramatic acquisition of periostin in the surrounding matrix. Periostin is a matricellular protein that can interact both with integrins and with collagen I (reviewed in (37)). Periostin is commonly expressed during development and then is downregulated in most adult tissues but is often upregulated by wounding or disease. We found that periostin is a ubiquitous component of chronic pancreatitis, but it is more dynamically regulated during cancer progression. While PDAC lesions are surrounded by dense periostin accumulation, early PanIN lesions are largely devoid of periostin in their surrounding matrix unless they occur in close proximity to an invasive PDAC front. Late stage PanINs gradually acquire periostin pools in close apposition to their epithelium, perhaps indicating a change in epithelial-matrix interaction as cells lose polarity and become less depending on basement membrane attachment.
The presence and arrangement of myofibroblasts also varies as PanINs progress to PDAC. Myofibroblasts are in low abundance around early PanINs and increase in density around late PanINs and even more so around PDAC. Within all these tissues, myofibroblasts reflect the orientation of collagen bundles. Surrounding PanINs, collagen is well-organized into parallel bundles and myofibroblasts are elongated in parallel to these bundles. As collagen becomes disrupted around PDAC lesions, myofibroblasts similarly lose their parallel orientations. The fibrotic tissue surrounding PDAC has been postulated to restrict blood flow and this has been convincingly demonstrated in a mouse model (38). Our results suggest that tumor-associated fibrosis may restrict blood flow via myofibroblasts contracting along collagen bundles and thus constricting the tissue. Even though thick collagen bundles are disrupted immediately around invasive PDAC lesions, there are always regions of these well-organized collagen/myofibroblast structures in the surrounding microenvironment.
Microenvironment distinguishes benign lesions in cancer from those in chronic pancreatitis
A quandary in the field of pancreatic disease is the distinction of early PanIN lesions from ductal lesions that are seen in benign disease. In chronic pancreatitis, mucinous ductal lesions are observed that are morphologically similar to PanIN1. We found that a collagen-rich matrix is common both to cancer-associated PanIN1 and to chronic pancreatitis-associated PanIN-like lesions. However PanIN1s in cancer patients are devoid of periostin and low in myofibroblasts while PanIN1-like lesions in chronic pancreatitis are surrounded by abundant periostin and myofibroblasts. Early ADMs, with mixed acinar and ductal characteristics, have a microenvironment that is similar in both PDAC and chronic pancreatitis tissues. However, established ADMs, which no longer bear any acinar characteristics, are often different in PDAC tissue as compared to chronic pancreatitis, with microenvironments that reflect the differences between PanIN1 in cancer and PanIN1-like in chronic pancreatitis. In mice that express the KrasG12D oncogene in the pancreas, many PanIN1-like lesions arise with two distinct microenvironments. Some are similar to human PanIN1s with no periostin and few myofibroblasts but others are similar to PanIN1-like lesions in chronic pancreatitis with abundant periostin and myofibroblasts surrounding them.
Both ducts and acinar cells have been proposed as precursors to pancreatic ductal adenocarcinoma (39). PanINs are ductal in structure and markers, suggesting they arise from ductal transformation. However, acinar cells have been demonstrated to transdifferentiate directly and rapidly to ductal cells in vivo (26, 29) and in vitro (28) and are now widely believed to be the precursors of ADM lesions. In mice, introduction of Kras mutation into either adult ducts (40) or acinar cells (27) leads to PanIN1-like lesions, but neither model showed progression to PDAC, leaving open the possibility that either cell type may give rise to pancreatic cancer. Other models have shown PDAC derived from acinar-driven KrasG12V expression but because expression was not completely specific to acinar cells and the number of cancers that arose was small, it is again not clear which cell gave rise to the cancer (41). Because the microenvironment around PanIN1 lesions is similar to that of larger normal pancreatic ducts, it is tempting to speculate that ducts are the cells of origin for PDAC. However, ADM in PDAC tissue can acquire a similar microenvironment with loss of periostin and reduction of myofibroblasts, a loss that is not observed in chronic pancreatitis. Thus, ADM may progress differently in the presence of oncogenes such mutant Kras as compared to benign disease. In summary, our data are consistent with normal ducts giving rise to PanIN1s and thence to PDAC or with acinar cells undergoing ADM and subsequently altering their microenvironment before giving rise to PanIN and then PDAC. This issue of cell of origin will likely not be resolved until mouse models that efficiently develop PDAC (not just PanINs) are compared, side by side, using acinar-specific and duct-specific targeting.
Multiple signals are required to activate PaSCs in a three-dimensional collagen matrix
Many growth factors have been implicated in activation of PaSCs (42) and thus may regulate pancreatic fibrogenesis in chronic pancreatitis and/or PDAC. However, most of the work done in vitro has cultured these cells on plastic, which alone is sufficient to induce the activation process. As reported for both hepatic stellate cells and for PaSCs (16, 33), IPS-1 cells revert to a quiescent state on matrigel. They maintained this quiescence when moved to collagen matrix for analyses. In this collagen matrix, quiescent IPS-1 cells were resistant to the effects of HB-EGF or TGFβ, both of which induce fibrosis in vivo (10, 43) and the latter of which enhances PaSC activation on plastic (31, 32). Co-culture with macrophage cell lines, however, activated quiescent IPS-1 cells, inducing morphological changes consistent with myofibroblast morphology, and in the presence of HB-EGF many of these cells were positive for αSMA expression. Macrophages produce an abundance of cytokines and growth factors including TGFβ (34) and HB-EGF (44). In the context of past work in the field, our studies suggest that a combination of signaling pathways is necessary for PaSC activation. Interestingly, we found that PaSCs have the potential to regulate macrophage function, inducing the production of multiple cytokines, perhaps partially through PaSC production of IL-6. Because our studies used cell lines rather than cells freshly isolated from animals, it is possible that the precise nature of these interactions could be different in vivo. The coordinated response of macrophage infiltration with the initiation of fibrogenesis in vivo in both mouse and human pancreatic tissue suggests that the cross-regulation observed in vitro may also occur in vivo. The co-culture model that we have established will allow the determination of the critical pathways regulating this interaction.
The function of macrophages in pancreatic cancer is as yet poorly understood. In a mouse model of PDAC, macrophages were found to produce IL6, IL10, and TNF with reduced expression of MHC class II molecules suggesting an immune tolerant microenvironment (45). However, the large macrophage infiltration in PDAC lacks a concomitant increase in any type of T cells within the tumor tissue (45) suggesting that macrophage function in this cancer may differ from that of many other epithelial cancers. Recently, macrophage-derived CCL5/RANTES and TNF were found to induce ADM of pancreatic acinar cells (46), consistent with our report of macrophage influx associated with ADM (23). Clearly, further analysis is necessary to understand how macrophages regulate both fibrogenesis and epithelial transformation.
Supplementary Material
Figure 5. IPS-1 co-culture with RAW264.7 cells alters cytokine production.
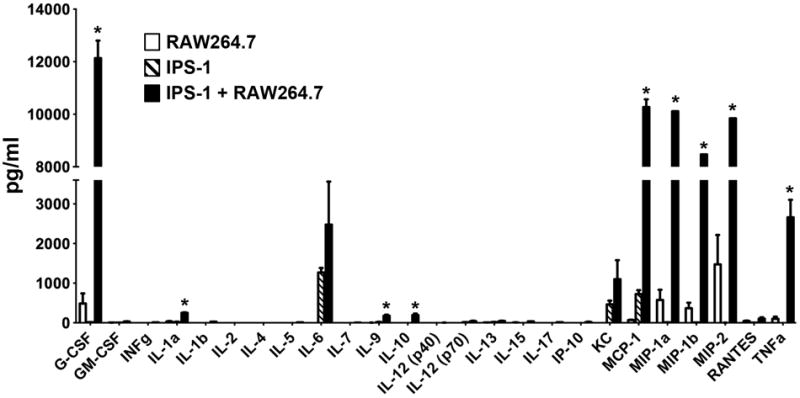
RAW264.7 cells (white bars) and quiescent IPS-1 cells (dashed bars) were cultured alone or together (black bars) as described in Figure 4. Media was collected after 3 days and analyzed for selected cytokines. *, P< 0.01.
Acknowledgments
We would like to thank members of the Vanderbilt Pancreatic Cancer Research Group for helpful discussions. This work was supported by Vanderbilt Clinical Translational Science Award, National Center for Advancing Translational Sciences, #UL1TR000445 (ALM); NIH P50 CA095103 (CS, MKW); NIH CA069457 (RDB); Vanderbilt Ingram Cancer Center Support Grant, NIH P30 CA068485 (RDB); NIH R01DK053620 and R01AT004821 (KTW); Veteran Affairs Merit Review Grant 1I01BX001453 (KTW); Core services from the Vanderbilt Digestive Disease Research Center, NIH DK058404 (ALM, RDB, RHW); American Lebanese Syrian Associated Charities (BSP); DOD W81XWH-11-1-0242 (FEY).
Footnotes
Supplementary information is available at Laboratory Investigation’s website.
Disclosure/Duality of Interest
The authors disclose that they have no conflicts of interest with this work.
References
- 1.Apte MV, Park S, Phillips PA, et al. Desmoplastic reaction in pancreatic cancer: role of pancreatic stellate cells. Pancreas. 2004;29(3):179–87. doi: 10.1097/00006676-200410000-00002. Epub 2004/09/16. [DOI] [PubMed] [Google Scholar]
- 2.Iacobuzio-Donahue CA, Ryu B, Hruban RH, et al. Exploring the host desmoplastic response to pancreatic carcinoma : gene expression of stromal and neoplastic cells at the site of primary invasion. Am J Pathol. 2002;160(1):91–9. doi: 10.1016/S0002-9440(10)64353-2. [DOI] [PMC free article] [PubMed] [Google Scholar]
- 3.Feig C, Gopinathan A, Neesse A, et al. The pancreas cancer microenvironment. Clin Cancer Res. 2012;18(16):4266–76. doi: 10.1158/1078-0432.CCR-11-3114. Epub 2012/08/17. [DOI] [PMC free article] [PubMed] [Google Scholar]
- 4.Hruban RH, Adsay NV, Albores-Saavedra J, et al. Pancreatic intraepithelial neoplasia: a new nomenclature and classification system for pancreatic duct lesions. Am J Surg Pathol. 2001;25(5):579–86. doi: 10.1097/00000478-200105000-00003. [DOI] [PubMed] [Google Scholar]
- 5.Riopel MM, Li J, Liu S, et al. beta1 integrin-extracellular matrix interactions are essential for maintaining exocrine pancreas architecture and function. Lab Invest. 2013;93(1):31–40. doi: 10.1038/labinvest.2012.147. Epub 2012/10/17. [DOI] [PubMed] [Google Scholar]
- 6.Apte MV, Haber PS, Applegate TL, et al. Periacinar stellate shaped cells in rat pancreas: identification, isolation, and culture. Gut. 1998;43(1):128–33. doi: 10.1136/gut.43.1.128. [DOI] [PMC free article] [PubMed] [Google Scholar]
- 7.Kawaguchi Y, Cooper B, Gannon M, et al. The role of the transcriptional regulator Ptf1a in converting intestinal to pancreatic progenitors. Nat Genet. 2002;32(1):128–34. doi: 10.1038/ng959. [DOI] [PubMed] [Google Scholar]
- 8.Jackson EL, Willis N, Mercer K, et al. Analysis of lung tumor initiation and progression using conditional expression of oncogenic K-ras. Genes Dev. 2001;15(24):3243–8. doi: 10.1101/gad.943001. [DOI] [PMC free article] [PubMed] [Google Scholar]
- 9.Serrano M, Lee H, Chin L, et al. Role of the INK4a locus in tumor suppression and cell mortality. Cell. 1996;85(1):27–37. doi: 10.1016/s0092-8674(00)81079-x. [DOI] [PubMed] [Google Scholar]
- 10.Ray KC, Blaine SA, Washington MK, et al. Transmembrane and Soluble Isoforms of Heparin-Binding Epidermal Growth Factor-Like Growth Factor Regulate Distinct Processes in the Pancreas. Gastroenterology. 2009 doi: 10.1053/j.gastro.2009.07.067. [DOI] [PMC free article] [PubMed] [Google Scholar]
- 11.Blaine SA, Ray KC, Branch KM, et al. Epidermal growth factor receptor regulates pancreatic fibrosis. Am J Physiol Gastrointest Liver Physiol. 2009;297(3):G434–41. doi: 10.1152/ajpgi.00152.2009. [DOI] [PMC free article] [PubMed] [Google Scholar]
- 12.Ralph P, Nakoinz I. Antibody-dependent killing of erythrocyte and tumor targets by macrophage-related cell lines: enhancement by PPD and LPS. J Immunol. 1977;119(3):950–54. Epub 1977/09/01. [PubMed] [Google Scholar]
- 13.Han W, Li H, Cai J, et al. NADPH oxidase limits lipopolysaccharide-induced lung inflammation and injury in mice through reduction-oxidation regulation of NF-kappaB activity. J Immunol. 2013;190(9):4786–94. doi: 10.4049/jimmunol.1201809. Epub 2013/03/27. [DOI] [PMC free article] [PubMed] [Google Scholar]
- 14.Jat PS, Noble MD, Ataliotis P, et al. Direct derivation of conditionally immortal cell lines from an H-2Kb-tsA58 transgenic mouse. Proc Natl Acad Sci U S A. 1991;88(12):5096–100. doi: 10.1073/pnas.88.12.5096. [DOI] [PMC free article] [PubMed] [Google Scholar]
- 15.Whitehead RH, VanEeden PE, Noble MD, et al. Establishment of conditionally immortalized epithelial cell lines from both colon and small intestine of adult H-2Kb-tsA58 transgenic mice. Proc Natl Acad Sci U S A. 1993;90(2):587–91. doi: 10.1073/pnas.90.2.587. [DOI] [PMC free article] [PubMed] [Google Scholar]
- 16.Sohara N, Znoyko I, Levy MT, et al. Reversal of activation of human myofibroblast-like cells by culture on a basement membrane-like substrate. J Hepatol. 2002;37(2):214–21. doi: 10.1016/s0168-8278(02)00103-4. Epub 2002/07/20. [DOI] [PubMed] [Google Scholar]
- 17.Mollenhauer J, Roether I, Kern HF. Distribution of extracellular matrix proteins in pancreatic ductal adenocarcinoma and its influence on tumor cell proliferation in vitro. Pancreas. 1987;2(1):14–24. doi: 10.1097/00006676-198701000-00003. Epub 1987/01/01. [DOI] [PubMed] [Google Scholar]
- 18.Fukushima N, Kikuchi Y, Nishiyama T, et al. Periostin deposition in the stroma of invasive and intraductal neoplasms of the pancreas. Modern pathology : an official journal of the United States and Canadian Academy of Pathology, Inc. 2008;21(8):1044–53. doi: 10.1038/modpathol.2008.77. Epub 2008/05/20. [DOI] [PubMed] [Google Scholar]
- 19.Clark CE, Hingorani SR, Mick R, et al. Dynamics of the immune reaction to pancreatic cancer from inception to invasion. Cancer Res. 2007;67(19):9518–27. doi: 10.1158/0008-5472.CAN-07-0175. Epub 2007/10/03. [DOI] [PubMed] [Google Scholar]
- 20.Emmrich J, Weber I, Nausch M, et al. Immunohistochemical characterization of the pancreatic cellular infiltrate in normal pancreas, chronic pancreatitis and pancreatic carcinoma. Digestion. 1998;59(3):192–8. doi: 10.1159/000007488. Epub 1998/06/27. [DOI] [PubMed] [Google Scholar]
- 21.Barth PJ, Ebrahimsade S, Hellinger A, et al. CD34+ fibrocytes in neoplastic and inflammatory pancreatic lesions. Virchows Arch. 2002;440(2):128–33. doi: 10.1007/s00428-001-0551-3. Epub 2002/04/20. [DOI] [PubMed] [Google Scholar]
- 22.Yen TW, Aardal NP, Bronner MP, et al. Myofibroblasts are responsible for the desmoplastic reaction surrounding human pancreatic carcinomas. Surgery. 2002;131(2):129–34. doi: 10.1067/msy.2002.119192. [DOI] [PubMed] [Google Scholar]
- 23.Ray KC, Moss ME, Franklin JL, et al. Heparin-binding epidermal growth factor-like growth factor eliminates constraints on activated Kras to promote rapid onset of pancreatic neoplasia. Oncogene. 2013 doi: 10.1038/onc.2013.3. Epub 2013/02/05. [DOI] [PMC free article] [PubMed] [Google Scholar]
- 24.Lau SK, Chu PG, Weiss LM. CD163: a specific marker of macrophages in paraffin-embedded tissue samples. American journal of clinical pathology. 2004;122(5):794–801. doi: 10.1309/QHD6-YFN8-1KQX-UUH6. Epub 2004/10/20. [DOI] [PubMed] [Google Scholar]
- 25.Fabriek BO, Dijkstra CD, van den Berg TK. The macrophage scavenger receptor CD163. Immunobiology. 2005;210(2-4):153–60. doi: 10.1016/j.imbio.2005.05.010. Epub 2005/09/17. [DOI] [PubMed] [Google Scholar]
- 26.Blaine SA, Ray KC, Anunobi R, et al. Adult pancreatic acinar cells give rise to ducts but not endocrine cells in response to growth factor signaling. Development. 2010;137(14):2289–96. doi: 10.1242/dev.048421. Epub 2010/06/11. [DOI] [PMC free article] [PubMed] [Google Scholar]
- 27.Kopp JL, von Figura G, Mayes E, et al. Identification of Sox9-dependent acinar-to-ductal reprogramming as the principal mechanism for initiation of pancreatic ductal adenocarcinoma. Cancer Cell. 2012;22(6):737–50. doi: 10.1016/j.ccr.2012.10.025. Epub 2012/12/04. [DOI] [PMC free article] [PubMed] [Google Scholar]
- 28.Means AL, Meszoely IM, Suzuki K, et al. Pancreatic epithelial plasticity mediated by acinar cell transdifferentiation and generation of nestin-positive intermediates. Development. 2005;132(16):3767–76. doi: 10.1242/dev.01925. [DOI] [PubMed] [Google Scholar]
- 29.Strobel O, Dor Y, Alsina J, et al. In vivo lineage tracing defines the role of acinar-to-ductal transdifferentiation in inflammatory ductal metaplasia. Gastroenterology. 2007;133(6):1999–2009. doi: 10.1053/j.gastro.2007.09.009. [DOI] [PMC free article] [PubMed] [Google Scholar]
- 30.Hingorani SR, Petricoin EF, Maitra A, et al. Preinvasive and invasive ductal pancreatic cancer and its early detection in the mouse. Cancer Cell. 2003;4(6):437–50. doi: 10.1016/s1535-6108(03)00309-x. [DOI] [PubMed] [Google Scholar]
- 31.Bachem MG, Schneider E, Gross H, et al. Identification, culture, and characterization of pancreatic stellate cells in rats and humans. Gastroenterology. 1998;115(2):421–32. doi: 10.1016/s0016-5085(98)70209-4. [DOI] [PubMed] [Google Scholar]
- 32.Haber PS, Keogh GW, Apte MV, et al. Activation of pancreatic stellate cells in human and experimental pancreatic fibrosis. Am J Pathol. 1999;155(4):1087–95. doi: 10.1016/S0002-9440(10)65211-X. Epub 1999/10/09. [DOI] [PMC free article] [PubMed] [Google Scholar]
- 33.Jesnowski R, Furst D, Ringel J, et al. Immortalization of pancreatic stellate cells as an in vitro model of pancreatic fibrosis: deactivation is induced by matrigel and N-acetylcysteine. Lab Invest. 2005;85(10):1276–91. doi: 10.1038/labinvest.3700329. Epub 2005/08/30. [DOI] [PubMed] [Google Scholar]
- 34.Murray PJ, Wynn TA. Protective and pathogenic functions of macrophage subsets. Nat Rev Immunol. 2011;11(11):723–37. doi: 10.1038/nri3073. Epub 2011/10/15. [DOI] [PMC free article] [PubMed] [Google Scholar]
- 35.Mantovani A, Biswas SK, Galdiero MR, et al. Macrophage plasticity and polarization in tissue repair and remodelling. J Pathol. 2013;229(2):176–85. doi: 10.1002/path.4133. Epub 2012/10/26. [DOI] [PubMed] [Google Scholar]
- 36.Mosser DM. The many faces of macrophage activation. J Leukoc Biol. 2003;73(2):209–12. doi: 10.1189/jlb.0602325. Epub 2003/01/30. [DOI] [PubMed] [Google Scholar]
- 37.Hamilton DW. Functional role of periostin in development and wound repair: implications for connective tissue disease. Journal of cell communication and signaling. 2008;2(1-2):9–17. doi: 10.1007/s12079-008-0023-5. Epub 2008/07/22. [DOI] [PMC free article] [PubMed] [Google Scholar]
- 38.Olive KP, Jacobetz MA, Davidson CJ, et al. Inhibition of Hedgehog signaling enhances delivery of chemotherapy in a mouse model of pancreatic cancer. Science. 2009;324(5933):1457–61. doi: 10.1126/science.1171362. Epub 2009/05/23. [DOI] [PMC free article] [PubMed] [Google Scholar]
- 39.Maitra A, Leach SD. Disputed paternity: the uncertain ancestry of pancreatic ductal neoplasia. Cancer Cell. 2012;22(6):701–3. doi: 10.1016/j.ccr.2012.11.015. Epub 2012/12/15. [DOI] [PMC free article] [PubMed] [Google Scholar]
- 40.Ray KC, Bell KM, Yan J, et al. Epithelial tissues have varying degrees of susceptibility to Kras(G12D)-initiated tumorigenesis in a mouse model. PLoS One. 2011;6(2):e16786. doi: 10.1371/journal.pone.0016786. Epub 2011/02/12. [DOI] [PMC free article] [PubMed] [Google Scholar]
- 41.Guerra C, Schuhmacher AJ, Canamero M, et al. Chronic pancreatitis is essential for induction of pancreatic ductal adenocarcinoma by K-Ras oncogenes in adult mice. Cancer Cell. 2007;11(3):291–302. doi: 10.1016/j.ccr.2007.01.012. [DOI] [PubMed] [Google Scholar]
- 42.Apte MV, Wilson JS. Mechanisms of pancreatic fibrosis. Dig Dis. 2004;22(3):273–9. doi: 10.1159/000082799. [DOI] [PubMed] [Google Scholar]
- 43.Vogelmann R, Ruf D, Wagner M, et al. Effects of fibrogenic mediators on the development of pancreatic fibrosis in a TGF-beta1 transgenic mouse model. Am J Physiol Gastrointest Liver Physiol. 2001;280(1):G164–72. doi: 10.1152/ajpgi.2001.280.1.G164. [DOI] [PubMed] [Google Scholar]
- 44.Edwards JP, Zhang X, Mosser DM. The expression of heparin-binding epidermal growth factor-like growth factor by regulatory macrophages. J Immunol. 2009;182(4):1929–39. doi: 10.4049/jimmunol.0802703. Epub 2009/02/10. [DOI] [PMC free article] [PubMed] [Google Scholar]
- 45.Beatty GL, Chiorean EG, Fishman MP, et al. CD40 agonists alter tumor stroma and show efficacy against pancreatic carcinoma in mice and humans. Science. 2011;331(6024):1612–6. doi: 10.1126/science.1198443. Epub 2011/03/26. [DOI] [PMC free article] [PubMed] [Google Scholar]
- 46.Liou GY, Doppler H, Necela B, et al. Macrophage-secreted cytokines drive pancreatic acinar-to-ductal metaplasia through NF-kappaB and MMPs. J Cell Biol. 2013;202(3):563–77. doi: 10.1083/jcb.201301001. Epub 2013/08/07. [DOI] [PMC free article] [PubMed] [Google Scholar]
Associated Data
This section collects any data citations, data availability statements, or supplementary materials included in this article.