

Significance
The 26S proteasome is a multisubunit molecular machine for the targeted degradation of intracellular proteins. It has an essential role in the maintenance of protein homeostasis. During its functional cycle the proteasome undergoes large-scale conformational changes. For a detailed mechanistic understanding, an analysis of its conformational landscape is indispensable. Capitalizing on a very large dataset of more than 3 million individual particles and using a novel image-classification strategy, we have been able to deconvolute coexisting conformational states. This led to the discovery of conformation intermediates that provide deeper insights into the sequence of events following the initial binding of ubiquitylated substrates.
Keywords: conformational switching, proteolysis, proteostasis, quality control
Abstract
The 26S proteasome is a 2.5 MDa molecular machine that executes the degradation of substrates of the ubiquitin–proteasome pathway. The molecular architecture of the 26S proteasome was recently established by cryo-EM approaches. For a detailed understanding of the sequence of events from the initial binding of polyubiquitylated substrates to the translocation into the proteolytic core complex, it is necessary to move beyond static structures and characterize the conformational landscape of the 26S proteasome. To this end we have subjected a large cryo-EM dataset acquired in the presence of ATP and ATP-γS to a deep classification procedure, which deconvolutes coexisting conformational states. Highly variable regions, such as the density assigned to the largest subunit, Rpn1, are now well resolved and rendered interpretable. Our analysis reveals the existence of three major conformations: in addition to the previously described ATP-hydrolyzing (ATPh) and ATP-γS conformations, an intermediate state has been found. Its AAA-ATPase module adopts essentially the same topology that is observed in the ATPh conformation, whereas the lid is more similar to the ATP-γS bound state. Based on the conformational ensemble of the 26S proteasome in solution, we propose a mechanistic model for substrate recognition, commitment, deubiquitylation, and translocation into the core particle.
In the ubiquitin–proteasome pathway (UPP) the 26S proteasome performs the degradation of intracellular proteins marked for destruction by the covalent attachment of polyubiquitin chains (1–5). The 2.5 MDa complex consists of the barrel-shaped 20S core particle (CP) as well as one or two copies of the 19S regulatory particle (RP) controlling the entry of substrates into the proteolytic chamber of the CP. The structure of the CP was solved by X-ray crystallography a long time ago (6, 7); whereas, the molecular architecture of the 26S holocomplex was determined only recently using cryo-EM single-particle analysis (SPA) approaches (8–10). The RP comprises a ring-shaped AAA-ATPase heterohexamer (Rpt1-6) responsible for substrate unfolding and translocation across the CP gate and 13 RP non-ATPases (Rpn1-3, 5–13, 15) surrounding the AAA-ATPase module. The role of the Rpns is the acceptance of substrates and their deubiquitylation. For a full mechanistic understanding of the early steps of substrate processing it is essential to reveal its dynamics.
The compositional and conformational heterogeneity of 26S proteasome preparations makes the structural characterization of this molecular machine challenging (11). Compositional heterogeneity results from multiple proteins that interact with the 26S proteasome substoichiometrically, such as deubiquitylating enzymes (DUBs) or shuttling ubiquitin (Ub) receptors. Conformational switching of the 26S proteasome is mostly driven by ATP binding and hydrolysis. Each of the six distinct Rpt subunits is able to bind and hydrolyze ATP (12–14), which may theoretically give rise to a large number of different conformational states. To what extent ATP hydrolysis of the different AAA-ATPase subunits is spatially coordinated, e.g., in a cyclic mechanism (15), or stochastic (16) is currently under debate.
Because of the structural heterogeneity of the 26S proteasome the highest resolution insights into its structure come from cryo-EM SPA studies rather than X-ray crystallography; SPA is more tolerant of structural heterogeneity. In SPA large numbers of projections of single particles are combined in a 3D model. If the particles in the dataset differ in conformation, the reconstruction is a blurred convolute of the coexisting structures. The relatively high resolution obtained with 26S proteasome particles in the presence of ATP suggests that the 26S proteasome adopts a preferred conformation (9). In fact, a 7.4-Å resolution reconstruction allowed the creation of an atomic model for the ATP-hydrolyzing (ATPh) state (10). Nevertheless, the variance map from the individual particles in the dataset revealed a considerable degree of structural heterogeneity that most likely limited the attainable spatial resolution.
A subnanometer-resolution reconstruction was also obtained from 26S proteasomes in the presence of the slowly hydrolyzable ATP analog ATP-γS; this fact indicates that the 26S proteasome adopts a predominant conformation also under these conditions (17). In the ATP-γS structure the AAA-ATPase module undergoes a topological change concomitant with an overall translation and rotation aligning the channel traversing the AAA-ATPase ring where substrate unfolding takes place and the CP gate controlling access to the CP. The rearrangement of the AAA-ATPase module induces a large-scale conformational change of the surrounding Rpn subunits. For the ATP-γS dataset, variance analysis indicated an even larger structural heterogeneity than for the ATPh dataset. It is conceivable that the ATPh and ATP-γS structures correspond to predominant states under the respective sample conditions, but other conformations are likely to coexist in both datasets.
Here we perform a deep classification of more than 3 million 26S proteasome particles in the presence of both, ATP and ATP-γS, to identify low-abundance conformational states of the holocomplex. To group single-particle projections with respect to different underlying conformers we developed a computational method that combines focused classification and rigid-body fitting of atomic models into EM maps. The resulting conformational ensemble of the 26S proteasome provides insights into the mechanisms of substrate recognition, commitment, deubiquitylation, and translocation into the CP.
Results
Combined Classification in Pixel and Coordinate Space.
To deconvolute coexisting conformations in SPA datasets, an assignment to different conformers is included into the protocol used for image alignment and 3D reconstruction. In our algorithm, the individual particles are provisionally aligned with respect to a single reference and then classified and refined by a multistep protocol (Fig. S1). The starting point is to group the particles into a large number of density classes using an implementation of the focused classification method first described in ref. 18. In essence, this algorithm groups single particles according to their best-matching reference and allows for refinement of particle alignment. This clustering method is a (quasi) expectation maximization approach (19, 20). This and other classification methods tend to divide the particles evenly among classes. Thus, when weakly populated conformers are present in an “unbalanced” dataset its members are often assigned to larger classes, leaving the conformer undetected. In our clustering strategy we sought to overcome this problem by vastly oversampling the number of classes used; the number of classes exceeds the anticipated number of conformations in the data by far. Thus, the sensitivity toward low-abundance conformers is increased at the expense of redundancy in the resulting class densities. We refer to the classes from this first round of density-based classification as oversampled classes (OCs).
For the analysis of the OCs, first poorly defined, typically “smeared,” OCs and the particles corresponding to them are removed from the dataset. These OCs typically represent particles with particularly low signal-to-noise ratio (SNR) or other defects that preclude accurate alignment. To remove redundancy among the remaining OCs we chose to rigid-body fit atomic models into the densities and clustered the OCs hierarchically according to the root-mean-squared deviations (RMSDs) of their corresponding coordinates in specific components of the holocomplex. The coordinate-based merging approach has four advantages over removing redundancy by directly clustering the corresponding densities in voxel space: (i) Clustering can be performed according to specific components of the macromolecule of interest; in voxel space, a fixed mask would roughly define the focus of interest, where the target components may move in and out. (ii) The classification can be rendered relatively insensitive to alignment differences of the particles; the atomic models or parts of it can be superposed, which avoids the classification according to differences in the coordinate systems. (iii) In contrast to the densities, the atomic models are by definition noise-free. The fitting error due to noise in the underlying densities can be assessed (SI Materials and Methods). (iv) The deviation of models according to the RMSD, which is a length measure, is easier to interpret than abstract measures for similarities of densities such as a correlation coefficient.
Particles grouped accordingly are then subjected to another round of iterative alignment. The resulting reconstructions typically yield substantially higher resolution than the OCs because more particles contribute to fewer classes. The reconstructions are used to build corresponding atomic models, again keeping subunit domains rigid unless the resolution is better than 10 Å.
Classification of 26S Proteasome Particles.
We analyzed two different 26S proteasome datasets acquired in the presence of hydrolysable ATP (ATPh dataset) (10) and in the presence of ATP-γS (ATP-γS dataset) (17). The ATP-γS data were tripled compared with a previous study (17). Image analysis focused on proteasome halves to allow for deviations from a C2 symmetry (10). From the focused classification of the merged data we retained 95 OCs out of an initial 140 OCs after filtering. Visual inspection of the individual images contributing to the discarded OCs suggests that they typically capture partially (dis)assembled proteasomes or that they suffer from a very low SNR preventing accurate alignment. The remaining 95 OCs represented 2.2 million 26S halves (1,442,139 in presence of ATP and 769,995 in presence of ATP-γS). The number of OCs, 95, is well beyond the anticipated number of conformers in the data. A strictly cyclic model for AAA-ATPase function, e.g., would imply a maximum of six distinct RP conformations. The resolutions of these OCs were on average 18 Å, and we low-pass filtered the densities accordingly to obtain corresponding pseudoatomic models by fitting rigid bodies derived from the ATPh model (10). Visual inspection of the fitted models suggests that the models explain the densities well (Fig. 1).
Fig. 1.

Hierarchical classification of particles. The OCs obtained by focused classification are hierarchically clustered into three major states s1–s3 according to atomic models of the lid. The dashed line represents the estimate of the significance level in the hierarchical tree. For each state a representative of an OC and its corresponding atomic model is shown. The particles of each state were merged and subjected to refinement and reconstruction yielding subnanometer-resolution maps. The maps are segmented according to the atomic models that were flexibly fitted (red: CP; blue: Rpt1/6/4; cyan: Rpt2/3/5; green tones: PCI subunits; magenta tones: Rpn8/11; purple tones: Rpn10/Rpn13; yellow: Rpn2; and brown: Rpn1).
We chose to first cluster the OCs based on the heterohexameric Proteasome-COP9-Initiation factor 3 (PCI) horseshoe formed by Rpn3/5/6/7/9/12 for three reasons (Fig. S2): (i) this feature is easily recognizable at the resolution of the OCs; (ii) visual inspection suggested that the atomic fits were accurate in this area; and (iii) the PCI horseshoe adopts different conformations in the ATPh- and ATP-γS bound states (17). We superposed the PCI heterohexamers from all models to that in the ATPh structure (PDB code: 4b4t) and determined their pairwise RMSD matrix, which was used for hierarchical clustering (Fig. 1).
The hierarchical tree of the 95 PCI horseshoe models reveals two distinctly different branches, which divide at an RMSD level of ∼10 Å (Fig. 1). Comparison of the models in the two branches suggests that they resemble the PCI module in the ATPh and ATP-γS structure, respectively. The ATPh-like branch (cluster s1) does not divide further above the significance level, whereas the ATP-γS–like branch is separated into two clusters, s2 and s3, at an RMSD value of ∼5 Å. Cluster s3 resembles the PCI conformer of the ATP-γS structure; whereas, the models in cluster s2 differ, in particular in the conformations of the N termini of Rpn5 and Rpn6.
We then extended the classification to the Rpns adjacent to the PCI heterohexamer. When including Rpn2 into the clustering the same classification was obtained (Fig. S3). Rpn10, Rpn13, and Sem1 were not included in the analysis due to their small size, which did not allow accurate fitting of these subunits into the low-resolution OCs. Thus, we conclude that the lid together with the adjacent base subunit Rpn2 adopts three distinctly different conformations in our datasets.
For the analysis of the structural variability in the AAA-ATPase hexamer the models in clusters s1–s3 were again superposed onto the PCI hexamers and clustered according to the AAA-ATPase module. This analysis reveals that s1 and s2 are essentially invariable within the error bar of our clustering method (Fig. S4). In contrast, the clustering of the models in s3 reveals significant structural differences.
Equilibrium of Different Conformations Under Different Buffer Conditions.
We next analyzed the relative distribution of the conformations in the two datasets acquired in the presence of 4 mM ATP and 1 mM ATP-γS, respectively. In the ATPh dataset only two of the three major conformations were present: 82% of the particles adopted s1 and 18% the conformation s2. Because s1 is highly similar to the previously determined ATPh structure, these findings are consistent with our assumption that the ATPh state is the predominant conformation in ATP containing buffer; the ratio of s1:s2 is 4:1 (Fig. S5).
In contrast, all three major conformations are present in the ATP-γS dataset: 21.2% of particles were assigned to s1, 5.4% to s2, and 73.4% to s3. Again, the prevalence of s3 is consistent with the unclassified reconstruction being very similar to the previously reported ATP-γS structure. The more divergent conformational distribution in the ATP-γS dataset compared with the ATP data are also in agreement with the higher variance observed in the single reference reconstruction compared with the unclassified reconstruction obtained from the ATP dataset (21). Interestingly, the ratio of the less abundant states s1 and s2 is also ∼4:1 in the ATP-γS dataset.
We also analyzed the correlations of states of the two RPs of each proteasome particle; the RP states are essentially statistically distributed under both buffer conditions (Fig. S5). Consistent with this finding alignment and reconstruction of particles with mixed RP states yields densities that clearly deviate from C2 symmetry.
Distinct 26S Proteasome Conformations at Subnanometer Resolution and Fitting of Atomic Models.
To obtain higher resolution structures of the different conformers we subjected the in silico purified particles from the different classes to independent alignment and reconstruction yielding resolutions of 7.7, 9.3, and 8.8 Å for s1, s2, and s3, respectively (Fig. 1, Figs. S2 and S6, and Movie S1 and S2). In the RP the resolutions of s1 and s3 are significantly higher than those of the unclassified densities, 8.3 (10) and 9.9 Å (21), respectively.
For the molecular interpretation we flexibly fitted atomic models into these subnanometer resolution maps. We also incorporated recent high-resolution structural data for several components: atomic structures of the dimer of the Rpn8/Rpn11 Mpr1-Pad1 N-terminal (MPN) domains (22), a major portion of Rpn12 (23) and Csn1 (24), a paralog of Rpn7, a computational model of the helical lid bundle (25), and the location of the C-terminal segment Sem1 in the 26S holocomplex (26).
Atomic Model of s1.
The AAA-ATPase heterohexamer comprises two stacked rings, the AAA ring formed by the AAA segments and the OB ring assembled from the oligosaccharide-binding fold (OB) domains (Fig. 2). The structures and positions of the AAA and OB domains of the ATPase heterohexamer were well resolved previously, but the improved resolution attained here also reveals the linkers between the OB ring and AAA ring for most subunits. As described previously the intersubunit modules (ISMs) formed by the large AAA domains of a subunit with the small AAA domain of its neighbor adopt two distinct topologies throughout the heterohexamer giving rise to a spiral shape of the AAA ring (9, 10, 17); the Rpt6/3 ISM is similar to the topology observed with the proteasome-activating nucleotidase (PAN)-ADP crystal structure (27) whereas the other five ISMs are arranged as observed for ClpX (28).
Fig. 2.
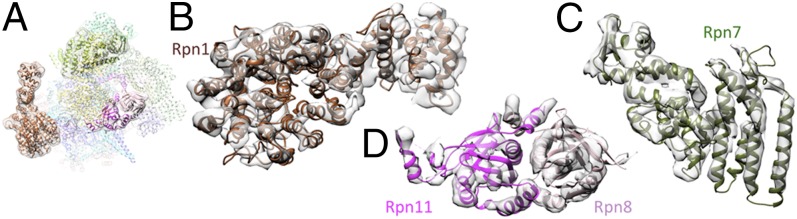
Atomic models of Rpn1, MPN dimer, and Rpn7 in corresponding segments of s1 density. (A) Overview of atomic model for s1 with magnified subunits highlighted. (B) Rpn1, (C) Rpn7, and (D) heterodimer formed by MPN domains of Rpn8 and Rpn11.
Due to high structural variability of Rpn1 (18, 29) the resolution of this subunit was insufficient to build a reliable model for this subunit in earlier reconstructions (10). After classification, secondary structure elements are resolved well enough in s1 to put forward an atomic model (Fig. 2B). Superposition of the atomic models of Rpn1 and Rpn2 reveals high similarity of both subunits with the notable exception of the N-terminal segment, which is rigidly rotated by ∼40° around a linker helix (residues 95–119 and 153–175 for Rpn2 and Rpn1, respectively) in the two subunits. The EM density connecting Rpn1 and the OB ring indicates that a coiled coil consisting of at least three helices tethers Rpn1 to the AAA-ATPase module (Fig. S7). Two of these helices must correspond to Rpt1 and Rpt2 whereas the third helix is likely contributed by a ∼100 residue stretch of Rpn1 that is not included in the atomic model; secondary structure prediction suggests that a significant part of this region is involved in a coiled coil (Fig. S7). However, the helices in the bundle cannot be traced completely in the EM map and assignment therefore remains ambiguous. Compared with all other RP subunits, the resolution of Rpn1 is nevertheless still modest, which is due to the residual structural variability of this subunit (Fig. S8).
In the lid region, the improved resolution reveals the connecting loops between the PCI domains and the C-terminal helices of the helical bundle for three subunits (Rpn5, Rpn7, and Rpn12), all consistent with the model in ref. 25. With the help of the Csn1 crystal structure (24) the N-terminal region of Rpn7 could be modeled almost completely (Fig. 2C). The crystal structure of the MPN-dimer Rpn8/Rpn11 (22) is also in excellent agreement with the cryo-EM density (Fig. 2D). The active site of Rpn11 is positioned near the coiled coils of Rpt4/5, ∼20 Å away from the pseudosixfold axis of the OB ring. Docking of Ub to Rpn11 based on the crystal structure of Ub2 bound to the associated molecule with the 3 domain of STAM-like protein (AMSH-LP) (30), a closely related DUB, suggests that the Ub-binding site is accessible, but there is little space to accommodate substrates (Fig. 3).
Fig. 3.

Local environment of Rpn11 in different states. (A) Atomic model of s1. Models of s2 and s3 were aligned onto the OB ring. (B) Rpn11 (magenta, active site indicated by *), Rpn10 (purple), and Ub (orange) seen from the side and top in s1, s2, and s3 (green, blue, and red frame, respectively). The blue ellipse indicates the composite active site of Rpn11. (C) The position of Rpn11 above the OB ring differs in s1 (green) compared with s2 (blue) and s3 (red).
For a comparison of the different 26S proteasome conformations we analyzed the interactions of the lid with the AAA-ATPase module and the CP in more detail. The PCI-subunits Rpn5, Rpn6, and Rpn7 contact these modules at several sites (Cα-Cα distance < 6 Å; Fig. S9): through their N-terminal tetratricopeptide repeat (TPRs) Rpn5 and Rpn6 interact with AAA-ATPase subunits Rpt6 and Rpt3 and CP subunits α1 and α2, respectively; whereas, Rpn7 only interacts with Rpt6 through well-resolved loops.
Atomic Model of s2.
In the atomic model corresponding to the s2 density the AAA-ATPase heterohexamer adopts essentially the same arrangement of ISMs and OB ring as seen in s1 with the notable exception of a differing bending of the coiled coil dimers of Rpt6/3 making extensive contact with the lid and Rpn2, and Rpt4/5, which in turn contacts Rpn10 (Fig. 3). However, the AAA module is positioned differently in s1 and s2: in s2 it is translated by ∼5 Å and laterally slightly rotated (∼1°) in addition to being less tilted (∼2°; Fig. 4A). This transformation positions Rpt2, Rpt6, and Rpt3 farther from the CP, and Rpt2 is in closer vicinity to the N terminus of Rpn1. Rpn1 itself is translated and rotated by about 35° positioning its N/C domain closer to the AAA-ATPase module and the CP (Fig. S10).
Fig. 4.

Structural changes of s2 compared with s1 and s3. (A and C) Overall motion of AAA ring and Rpns (Rpn2 shown as representative subunit) relative to CP (red simulated density) in s2 (blue frame) compared with s1 and s3 (subunits white, green, or red frame, respectively) shown as simulated densities. (B) AAA-ATPase module of s2 colored by RMSD after superposition to s1 and s3, respectively. (D) Lid in s2 state colored by RMSD with respect to s1 to s2, respectively.
The lid, together with Rpn2 and Rpn10, undergoes a dramatic motion with respect to the AAA module, which can be mostly described as a rigid-body rotation of 25° (Fig. 4C). Major rearrangements are only observed in the N-terminal domains of Rpn5 and Rpn6 (Fig. 4D). The interactions between lid, ATPase, and CP differ in s2 when compared with s1. Rpn5 does not interact with the ATPase module anymore whereas the interface with α1 is enlarged (Fig. S9). Rpn6 retains its contacts with the ATPases and CP, but the interactions sites differ. The contacts between Rpn7 and Rpt6 remain essentially identical. As a result of the en bloc motion of the Rpns, the Rpn8/11 MPN dimer is translated by ∼25 Å, positioning the Rpn11 active site along the pseudosixfold axis of the OB ring (Fig. 3). The OB ring and insertion 2 of Rpn11, a structurally variable mostly helical segment (22), form a narrow cage around Rpn11. Docking of Ub to Rpn11 reveals that the Ub-binding site is also accessible in state s2; at the same time the space for accommodation of the substrate is enlarged compared with s1 (Fig. 3). A further consequence of the lid motion is the repositioning of Rpn10 with respect to the coiled coils of Rpt4/5.
Atomic Model of s3.
In the AAA-ATPase module the PAN-ADP-like ISM is repositioned from Rpt6/3 to Rpt5/1 compared with s1 and s2, which results in an overall change of AAA-ring topology reported previously (17, 31). The AAA module is positioned essentially planar on top of the CP (tilt is reduced by ∼3 degrees compared with s2), laterally rotated by ∼8°, and translated by ∼6 Å (Fig. 4A). This transformation aligns the gate of the CP and the pores of the AAA module. The motion is even larger for the OB ring: compared with s2 this module is translated by ∼17.5 Å. The structures of the coiled coils remain essentially unchanged compared with s2. Upon transition from s2 to s3, Rpn1 undergoes a rigid-body motion in concert with the adjacent OB ring (Fig. S10).
The structural differences of the lid/Rpn2 module in s2 and s3 focus on the N-terminal TPR-like domains of Rpn5 and Rpn6, which bend slightly differently (Fig. 4D). The lid–ATPase and lid–CP contacts are essentially identical in s2 and s3, indicating that the structural changes of Rpn5 and Rpn6 retain the protein–protein contacts during the topology change of the ATPase module from s2 to s3 (Fig. S9). The position of the lid/Rpn2 module with respect to the OB ring is similar in s2 and s3, and hence the local environment of the Rpn11 active site is essentially identical (Fig. 3C). Also the arrangement of most other lid subunits appears unchanged in these two conformations, and Rpn10 is positioned similarly with respect to the Rpt4/5 coiled coils and the OB ring.
Heterogeneity of AAA-ATPase Module.
Further classification of the OCs within the three modes, s1, s2, and s3, according to the AAA-ATPase module only revealed significant structural variability for s3 (Fig. S4). We grouped the particles from s3 into four classes and subjected them to refinement and reconstruction. Three of those reconstructions were of subnanometer resolution and atomic models of the AAA-ATPase were fitted. These models indicate that the topology of AAA-ATPases remains invariant but the ISMs undergo substantial motions. We refrained from a more detailed interpretation of the atomic models, which would require higher-resolution reconstructions.
Discussion
Classification Method.
For the deconvolution of coexisting conformations in single-particle datasets of 26S proteasomes, a classification step has been included into the computational protocol for image alignment and 3D reconstruction. Thus, different particle projections are not only grouped according to their projection direction, but also with respect to different conformers. Major challenges in the simultaneous alignment and classification of single-particle data are the low SNR of the images and the detection of conformations with low occupancy (unbalanced data).
Previous approaches to classification of single-particle data into conformers exclusively rooted in pixel/voxel space (reviewed in ref. 32). In our method we combined such an image-based classification, a focused classification method (18) similar to that first introduced by Penczek et al. (33), with hierarchical clustering of atomic models fitted to the resulting class densities. Choosing a very large number of clusters for the initial focused classification allows detection of low-occupancy states and model-based classification is used to merge redundant classes. Major advantages of using atomic models for this second classification step are convenient focusing on specific parts of the assembly, robustness to alignment differences in the class densities, and an easily interpretable measure for class differences (RMSD between atomic models).
Using this approach we could identify a previously undetected conformer of the 26S proteasome (s2), which has an abundance of only 5% in one of the two datasets (ATP-γS containing buffer). Moreover, we could obtain reconstructions of the two previously known 26S proteasome conformers, s1 and s3, at significantly improved resolution allowing to put forward more complete atomic models of the 26S proteasome ensemble.
Coexistence of Three Major 26S Conformations.
The s1 map revealed the secondary structure elements of the previously poorly resolved subunit Rpn1 (9, 10, 17), which allowed putting forward an atomic model for this subunit. Moreover, the 7.7-Å density and the availability of suitable templates allowed us to model the complete lid. Using the s1 model as a starting point, we could then also build atomic models for s2 and s3 using the corresponding subnanometer-resolution reconstructions. The atomic models suggest that s2 is an intermediate state between s1 and s3. The ATPase module remains in essentially the same conformation as in s1, but is translated by ∼5 Å; whereas, the lid together with Rpn2 is in a position and conformation similar to s3.
The relative abundance of the three states in the different buffers provides some clues regarding their nucleotide states. The state s3 is only populated in the presence of the slowly hydrolysable ATP analog ATP-γS, suggesting that this is a high-energy prehydrolysis state with a maximum number of nucleotides bound. Like other AAA-ATPases (34, 35) the 26S proteasome appears to bind a maximum of four nucleotides (15). In the bacterial RP homolog ClpX the two unoccupied ATP-binding sites are suggested to be in opposite positions of the hexameric ring with one site being in an unloadable conformation and the other site is in a loadable state (36). This results in a symmetrical distribution of nucleotides as suggested previously for the 26S proteasome (15). Because of the absence of the Arg finger Rpt1 is likely unloadable implying that Rpt3 is empty; the remaining four sites may be occupied by nucleotides, presumably all ATP-γS.
The other two states, s1 and s2, are observed in the presence of both, ATP and ATP-γS. Remarkably, the relative abundance of s1:s2 is ∼4:1 for both conditions. It is reasonable to assume that s1 corresponds to the ground state because it is more abundant. At the current resolution the nucleotide-binding states of the different Rpt subunits cannot be determined in the two states. Thus, it is not clear whether transition from s1 to s2 requires ATP hydrolysis, but the magnitude of the conformational change makes it likely.
Detailed analysis of the conformations of the AAA-ATPase module revealed structural heterogeneity for s3. These structural changes appear nevertheless small compared with topology differences between s3 and s2/s1. In particular, the unloadable ISM modules are exclusively located at Rpt6/3 and Rpt5/1 in s3 and s1/s2, respectively, suggesting that the translocation mechanism of the proteasomal AAA-ATPase heterohexamer is not symmetrical across the ring subunits, consistent with conclusions from systematic mutagenesis studies (14).
Functional Model for Substrate Degradation.
The first step in proteasomal degradation of UPP substrates is the low-affinity binding of polyubiquitin to the proteasomal Ub receptors. There are no indications that substrate recruitment to the proteasome requires any type of activation suggesting that they bind primarily to the most abundant s1 conformer (Fig. 5A). We previously suggested that simultaneous binding of Ub moieties of a polyubiquitin tag to the Ub receptors Rpn10 and Rpn13 might be a means to increase affinity to polyubiquitin (37). Furthermore, the substantial structural variability of Rpn1 in s1 observed here may enable recruitment of shuttling Ub receptors. Further processing of polyubiquitylated substrates requires the presence of unstructured or loosely folded segments (38, 39); substrates with such secondary degrons are committed for degradation in an ATP-dependent process (40). We hypothesize that conformational switching between s1 and s2 enables commitment for two major reasons (Fig. 5B): (i) The repositioning of the Ub receptor Rpn10 is well suited to transfer a substrate to the DUB Rpn11. This process may require simultaneous binding of the polyubiquitin to the Ub receptor and Rpn11, which could be another reason for the preferred degradation of polyubiquitylated substrates (9). (ii) Crystallographic data (22) suggest that Rpn11 is activated by formation of a composite active site to which also the OB ring and the coiled coils of the AAA-ATPase module contribute, and which shows chaperone activity (41). The essentially identical architecture of this cavity in s2 and s3 suggests that deubiquitylation may occur in both states. It has been suggested that s3 represents a high-energy dwell state of the 26S proteasome and bursts of ATP hydrolysis enable pulling of the substrate through the ATPase pore into the CP (31) (Fig. 5C). Single-molecule studies revealed bursts due to simultaneous conformational changes of 2–4 ATPase subunits for ClpXP (42). Indeed the high structural variability of the s3 state revealed by our analysis is consistent with this hypothesis, albeit not a definite proof for this model.
Fig. 5.

Functional model for substrate degradation. (Left) Substrates (S, orange) with polyubiquitin tags mostly encounter the s1 state and bind to the Ub receptors Rpn10 and Rpn13 as well as to Rpn1, which binds shuttling Ub receptors (all highlighted). (Center) Conformational switching from s1 to s2, which comprises a 25° rotation of the Rpns and translation of the AAA-ATPase module, may transfer the substrate to the mouth of the ATPase and render Rpn11 (magenta) active. Deubiquitylation may occur at this stage or upon transition to s3. (Right) ATP loading of the AAA-ATPase leads to transition from s3 to s2, a conformational change of the AAA-ATPase module and translation of the Rpns, which enables substrate unfolding and translocation into the CP.
In summary we suggest that the three major conformations of the 26S proteasome represent a substrate-accepting state, a commitment state, and a translocating state. Further cryo-EM studies of the 26S proteasome that actively degrades polyubiquitylated substrates at even higher resolutions than reported here will be required to elucidate the mechanism of degradation in greater detail.
Materials and Methods
The 26S proteasomes were purified using a 3x-FLAG tag and imaged on an FEI Titan transmission electron microscope equipped with a Tietz 8k × 8k charge-couple device camera as described in ref. 10. Particle alignment and reconstruction was performed in XMIPP (43) and focused classification was carried out using the TOM toolbox (18). MDFF was used to obtain atomic models, superpose models, and compute RMSDs (44). Hierarchical clustering was performed in MATLAB (The Mathworks, Inc.). All images of densities and atomic models were rendered in UCSF Chimera (45). A detailed description of all protocols is found in the SI Materials and Methods.
Supplementary Material
Acknowledgments
We thank Julio Ortiz for preparing Fig. 5 and Markus Rampp for assistance on the computing center of the Max Planck Society. Our research is supported by funding from the Deutsche Forschungsgemeinschaft Excellence Cluster CIPSM, SFB-1035/Project A01 (to W.B.), and Graduiertenkolleg 1721 (to F.F.), as well as the European Molecular Biology Organization (to P.Ś.).
Footnotes
The authors declare no conflict of interest.
Database deposition: The single-particle reconstructions and the atomic coordinates have been deposited in the Electron Microscopy Data Bank, http://www.ebi.ac.uk/pdbe/emdb/ (accession nos. 2594, 2595, 2596), and the Protein Data Bank, www.pdb.org (PDB ID nos. 4cr2, 4cr3, 4cr4), respectively.
This article contains supporting information online at www.pnas.org/lookup/suppl/doi:10.1073/pnas.1403409111/-/DCSupplemental.
References
- 1.Finley D, Ulrich HD, Sommer T, Kaiser P. The ubiquitin-proteasome system of Saccharomyces cerevisiae. Genetics. 2012;192(2):319–360. doi: 10.1534/genetics.112.140467. [DOI] [PMC free article] [PubMed] [Google Scholar]
- 2.Kish-Trier E, Hill CP. Structural biology of the proteasome. Annu Rev Biophys. 2013;42:29–49. doi: 10.1146/annurev-biophys-083012-130417. [DOI] [PMC free article] [PubMed] [Google Scholar]
- 3.Tanaka K. The proteasome: Overview of structure and functions. Proc Jpn Acad, Ser B, Phys Biol Sci. 2009;85(1):12–36. doi: 10.2183/pjab.85.12. [DOI] [PMC free article] [PubMed] [Google Scholar]
- 4.Voges D, Zwickl P, Baumeister W. The 26S proteasome: A molecular machine designed for controlled proteolysis. Annu Rev Biochem. 1999;68:1015–1068. doi: 10.1146/annurev.biochem.68.1.1015. [DOI] [PubMed] [Google Scholar]
- 5.Varshavsky A. The ubiquitin system, an immense realm. Annu Rev Biochem. 2012;81:167–176. doi: 10.1146/annurev-biochem-051910-094049. [DOI] [PubMed] [Google Scholar]
- 6.Groll M, et al. Structure of 20S proteasome from yeast at 2.4 A resolution. Nature. 1997;386(6624):463–471. doi: 10.1038/386463a0. [DOI] [PubMed] [Google Scholar]
- 7.Löwe J, et al. Crystal structure of the 20S proteasome from the archaeon T. acidophilum at 3.4 A resolution. Science. 1995;268(5210):533–539. doi: 10.1126/science.7725097. [DOI] [PubMed] [Google Scholar]
- 8.Lasker K, et al. Molecular architecture of the 26S proteasome holocomplex determined by an integrative approach. Proc Natl Acad Sci USA. 2012;109(5):1380–1387. doi: 10.1073/pnas.1120559109. [DOI] [PMC free article] [PubMed] [Google Scholar]
- 9.Lander GC, et al. Complete subunit architecture of the proteasome regulatory particle. Nature. 2012;482(7384):186–191. doi: 10.1038/nature10774. [DOI] [PMC free article] [PubMed] [Google Scholar]
- 10.Beck F, et al. Near-atomic resolution structural model of the yeast 26S proteasome. Proc Natl Acad Sci USA. 2012;109(37):14870–14875. doi: 10.1073/pnas.1213333109. [DOI] [PMC free article] [PubMed] [Google Scholar]
- 11.Förster F, Unverdorben P, Sledź P, Baumeister W. Unveiling the long-held secrets of the 26S proteasome. Structure. 2013;21(9):1551–1562. doi: 10.1016/j.str.2013.08.010. [DOI] [PubMed] [Google Scholar]
- 12.Kim YC, Li X, Thompson D, DeMartino GN. ATP binding by proteasomal ATPases regulates cellular assembly and substrate-induced functions of the 26 S proteasome. J Biol Chem. 2013;288(5):3334–3345. doi: 10.1074/jbc.M112.424788. [DOI] [PMC free article] [PubMed] [Google Scholar]
- 13.Peth A, Nathan JA, Goldberg AL. The ATP costs and time required to degrade ubiquitinated proteins by the 26 S proteasome. J Biol Chem. 2013;288(40):29215–29222. doi: 10.1074/jbc.M113.482570. [DOI] [PMC free article] [PubMed] [Google Scholar]
- 14.Beckwith R, Estrin E, Worden EJ, Martin A. Reconstitution of the 26S proteasome reveals functional asymmetries in its AAA+ unfoldase. Nat Struct Mol Biol. 2013;20(10):1164–1172. doi: 10.1038/nsmb.2659. [DOI] [PMC free article] [PubMed] [Google Scholar]
- 15.Smith DM, Fraga H, Reis C, Kafri G, Goldberg AL. ATP binds to proteasomal ATPases in pairs with distinct functional effects, implying an ordered reaction cycle. Cell. 2011;144(4):526–538. doi: 10.1016/j.cell.2011.02.005. [DOI] [PMC free article] [PubMed] [Google Scholar]
- 16.Martin A, Baker TA, Sauer RT. Rebuilt AAA + motors reveal operating principles for ATP-fuelled machines. Nature. 2005;437(7062):1115–1120. doi: 10.1038/nature04031. [DOI] [PubMed] [Google Scholar]
- 17.Śledź P, et al. Structure of the 26S proteasome with ATP-γS bound provides insights into the mechanism of nucleotide-dependent substrate translocation. Proc Natl Acad Sci USA. 2013;110(18):7264–7269. doi: 10.1073/pnas.1305782110. [DOI] [PMC free article] [PubMed] [Google Scholar]
- 18.Bohn S, et al. Structure of the 26S proteasome from Schizosaccharomyces pombe at subnanometer resolution. Proc Natl Acad Sci USA. 2010;107(49):20992–20997. doi: 10.1073/pnas.1015530107. [DOI] [PMC free article] [PubMed] [Google Scholar]
- 19.Dempster AP, Laird NM, Rubin DB. Maximum likelihood from incomplete data via Em algorithm. J R Stat Soc, B. 1977;39(1):1–38. [Google Scholar]
- 20.MacQueen J. 1967. Some methods for classification and analysis of multivariate observations. Proceedings of 5th Berkeley Symposium on Mathematical Statistics and Probability (Univ of California Press, Berkeley, CA), pp 281–297.
- 21.Sledź P, Förster F, Baumeister W. Allosteric effects in the regulation of 26S proteasome activities. J Mol Biol. 2013;425(9):1415–1423. doi: 10.1016/j.jmb.2013.01.036. [DOI] [PubMed] [Google Scholar]
- 22.Pathare GR, et al. Crystal structure of the proteasomal deubiquitylation module Rpn8-Rpn11. Proc Natl Acad Sci USA. 2014;111(8):2984–2989. doi: 10.1073/pnas.1400546111. [DOI] [PMC free article] [PubMed] [Google Scholar]
- 23.Boehringer J, et al. Structural and functional characterization of Rpn12 identifies residues required for Rpn10 proteasome incorporation. Biochem J. 2012;448(1):55–65. doi: 10.1042/BJ20120542. [DOI] [PMC free article] [PubMed] [Google Scholar]
- 24.Lee JH, et al. Crystal structure and versatile functional roles of the COP9 signalosome subunit 1. Proc Natl Acad Sci USA. 2013;110(29):11845–11850. doi: 10.1073/pnas.1302418110. [DOI] [PMC free article] [PubMed] [Google Scholar]
- 25.Estrin E, Lopez-Blanco JR, Chacón P, Martin A. Formation of an intricate helical bundle dictates the assembly of the 26S proteasome lid. Structure. 2013;21(9):1624–1635. doi: 10.1016/j.str.2013.06.023. [DOI] [PubMed] [Google Scholar]
- 26.Bohn S, et al. Localization of the regulatory particle subunit Sem1 in the 26S proteasome. Biochem Biophys Res Commun. 2013;435(2):250–254. doi: 10.1016/j.bbrc.2013.04.069. [DOI] [PubMed] [Google Scholar]
- 27.Zhang F, et al. Structural insights into the regulatory particle of the proteasome from Methanocaldococcus jannaschii. Mol Cell. 2009;34(4):473–484. doi: 10.1016/j.molcel.2009.04.021. [DOI] [PMC free article] [PubMed] [Google Scholar]
- 28.Glynn SE, Martin A, Nager AR, Baker TA, Sauer RT. Structures of asymmetric ClpX hexamers reveal nucleotide-dependent motions in a AAA+ protein-unfolding machine. Cell. 2009;139(4):744–756. doi: 10.1016/j.cell.2009.09.034. [DOI] [PMC free article] [PubMed] [Google Scholar]
- 29.Nickell S, et al. Insights into the molecular architecture of the 26S proteasome. Proc Natl Acad Sci USA. 2009;106(29):11943–11947. doi: 10.1073/pnas.0905081106. [DOI] [PMC free article] [PubMed] [Google Scholar]
- 30.Sato Y, et al. Structural basis for specific cleavage of Lys 63-linked polyubiquitin chains. Nature. 2008;455(7211):358–362. doi: 10.1038/nature07254. [DOI] [PubMed] [Google Scholar]
- 31.Matyskiela ME, Lander GC, Martin A. Conformational switching of the 26S proteasome enables substrate degradation. Nat Struct Mol Biol. 2013;20(7):781–788. doi: 10.1038/nsmb.2616. [DOI] [PMC free article] [PubMed] [Google Scholar]
- 32.Spahn CM, Penczek PA. Exploring conformational modes of macromolecular assemblies by multiparticle cryo-EM. Curr Opin Struct Biol. 2009;19(5):623–631. doi: 10.1016/j.sbi.2009.08.001. [DOI] [PMC free article] [PubMed] [Google Scholar]
- 33.Penczek PA, Frank J, Spahn CM. A method of focused classification, based on the bootstrap 3D variance analysis, and its application to EF-G-dependent translocation. J Struct Biol. 2006;154(2):184–194. doi: 10.1016/j.jsb.2005.12.013. [DOI] [PubMed] [Google Scholar]
- 34.Nyquist K, Martin A. Marching to the beat of the ring: Polypeptide translocation by AAA+ proteases. Trends Biochem Sci. 2014;39(2):53–60. doi: 10.1016/j.tibs.2013.11.003. [DOI] [PMC free article] [PubMed] [Google Scholar]
- 35.Sauer RT, Baker TA. AAA+ proteases: ATP-fueled machines of protein destruction. Annu Rev Biochem. 2011;80:587–612. doi: 10.1146/annurev-biochem-060408-172623. [DOI] [PubMed] [Google Scholar]
- 36.Stinson BM, et al. Nucleotide binding and conformational switching in the hexameric ring of a AAA+ machine. Cell. 2013;153(3):628–639. doi: 10.1016/j.cell.2013.03.029. [DOI] [PMC free article] [PubMed] [Google Scholar]
- 37.Sakata E, et al. Localization of the proteasomal ubiquitin receptors Rpn10 and Rpn13 by electron cryomicroscopy. Proc Natl Acad Sci USA. 2012;109(5):1479–1484. doi: 10.1073/pnas.1119394109. [DOI] [PMC free article] [PubMed] [Google Scholar]
- 38.Prakash S, Inobe T, Hatch AJ, Matouschek A. Substrate selection by the proteasome during degradation of protein complexes. Nat Chem Biol. 2009;5(1):29–36. doi: 10.1038/nchembio.130. [DOI] [PMC free article] [PubMed] [Google Scholar]
- 39.Inobe T, Fishbain S, Prakash S, Matouschek A. Defining the geometry of the two-component proteasome degron. Nat Chem Biol. 2011;7(3):161–167. doi: 10.1038/nchembio.521. [DOI] [PMC free article] [PubMed] [Google Scholar]
- 40.Peth A, Uchiki T, Goldberg AL. ATP-dependent steps in the binding of ubiquitin conjugates to the 26S proteasome that commit to degradation. Mol Cell. 2010;40(4):671–681. doi: 10.1016/j.molcel.2010.11.002. [DOI] [PMC free article] [PubMed] [Google Scholar]
- 41.Djuranovic S, et al. Structure and activity of the N-terminal substrate recognition domains in proteasomal ATPases. Mol Cell. 2009;34(5):580–590. doi: 10.1016/j.molcel.2009.04.030. [DOI] [PubMed] [Google Scholar]
- 42.Sen M, et al. The ClpXP protease unfolds substrates using a constant rate of pulling but different gears. Cell. 2013;155(3):636–646. doi: 10.1016/j.cell.2013.09.022. [DOI] [PMC free article] [PubMed] [Google Scholar]
- 43.Scheres SH, Núñez-Ramírez R, Sorzano CO, Carazo JM, Marabini R. Image processing for electron microscopy single-particle analysis using XMIPP. Nat Protoc. 2008;3(6):977–990. doi: 10.1038/nprot.2008.62. [DOI] [PMC free article] [PubMed] [Google Scholar]
- 44.Trabuco LG, Villa E, Mitra K, Frank J, Schulten K. Flexible fitting of atomic structures into electron microscopy maps using molecular dynamics. Structure. 2008;16(5):673–683. doi: 10.1016/j.str.2008.03.005. [DOI] [PMC free article] [PubMed] [Google Scholar]
- 45.Goddard TD, Huang CC, Ferrin TE. Visualizing density maps with UCSF Chimera. J Struct Biol. 2007;157(1):281–287. doi: 10.1016/j.jsb.2006.06.010. [DOI] [PubMed] [Google Scholar]
Associated Data
This section collects any data citations, data availability statements, or supplementary materials included in this article.