

Abstract
The discovery that rapamycin extends the life span of diverse organisms has triggered many studies aimed at identifying the underlying molecular mechanisms. Mammalian target of rapamycin complex 1 (mTORC1) regulates cell growth and may regulate organismal aging by controlling mRNA translation. However, how inhibiting mTORC1 and decreasing protein synthesis can extend life span remains an unresolved issue. We showed that constitutively active mTORC1 signaling increased general protein synthesis but unexpectedly reduced the quality of newly synthesized polypeptides. We demonstrated that constitutively active mTORC1 decreased translation fidelity by increasing the speed of ribosomal elongation. Conversely, rapamycin treatment restored the quality of newly synthesized polypeptides mainly by slowing the rate of ribosomal elongation. We also found distinct roles for mTORC1 downstream targets in maintaining protein homeostasis. Loss of S6 kinases, but not 4E-BP family proteins, which are both involved in regulation of translation, attenuated the effects of rapamycin on the quality of newly translated proteins. Our results reveal a mechanistic connection between mTORC1 and protein quality, highlighting the central role of nutrient signaling in growth and aging.
INTRODUCTION
The mammalian target of rapamycin (mTOR) is a highly conserved serine/threonine kinase that is named for its inhibition by the drug rapamycin (1, 2). mTOR assembles into two functionally and structurally distinct complexes in the cytoplasm: mTORC1 (mTOR complex 1) and mTORC2. As a major hub that integrates multiple signaling pathways, mTORC1 is a master regulator of protein synthesis that couples nutrient signaling to cell growth and proliferation (3, 4). In mammalian cells, mTORC1 is positioned downstream of the tumor suppressors tuberous sclerosis complex 1 (TSC1) and TSC2. The TSC1/2 complex inhibits mTORC1 by acting as a guanosine triphosphatase (GTPase)–activating enzyme (GAP) for Ras homolog enriched in brain (Rheb), which binds to and activates mTORC1 (5, 6). Cells lacking functional TSC exhibit constitutive activation of mTORC1 signaling, resulting in increased protein synthesis and cell size (7). The phenotypes associated with Tsc deficiency can be rescued by rapamycin treatment (8). In further support of the critical role of mTORC1 in cell growth and proliferation, dysregulation of mTORC1 has been implicated in many disease states including cancer, metabolic disorders, and aging (9).
The role of mTORC1 in aging has received increasing attention owing to its mechanistic connection with other pathways in longevity studies. In many model organisms, longevity is regulated by the conserved insulin and insulin-like growth factor 1 (IGF-1) signaling pathway (10). Reducing the activity of phosphoinositide 3-kinase (PI3K), an upstream signaling of mTORC1, promotes longevity (11). In addition, caloric restriction increases life span in various organisms and is proposed to function by inhibiting mTORC1 (12). Direct inhibition of mTORC1 signaling also increases life span (13–15), and administration of rapamycin to adult mice substantially extends life span (16). A consequence of mTORC1 suppression is the general attenuation of protein synthesis. Indeed, partially inhibiting the translation machinery also increases life span in various organisms (17–19). Thus, reduced mRNA translation might be a common mechanism to extend life span in multiple species under different conditions.
How can reducing protein synthesis extend life span? Protein homeostasis refers to a delicate equilibrium between synthesizing proteins, maintaining protein conformations, and removing damaged proteins from cells (20) and has been postulated to play a critical role in growth and aging (21). This balance is maintained by molecular chaperones, the ubiquitin-proteasome system, and the autophagy pathway (22). A robust stress response is often associated with life span extension, which supports a critical role for protein homeostasis in growth and aging. We previously reported that constitutively active mTORC1 attenuates the expression of genes encoding chaperones at the translational level during stress conditions (23). However, how mTORC1-controlled mRNA translation influences the quality of translational products is not fully understood.
mTORC1 stimulates protein synthesis by phosphorylating several translational regulators. Two well-characterized downstream targets are the eukaryotic initiation factor 4E binding proteins (4E-BPs) and the p70 ribosomal S6 kinases (S6Ks) (3, 24). The nonphosphorylated 4E-BPs bind and sequester eIF4E, a key rate-limiting factor for cap-dependent mRNA translation initiation. mTORC1 phosphorylates 4E-BPs, thereby derepressing eIF4E and promoting formation of the translation initiation complex. mTORC1-mediated phosphorylation of S6K promotes protein synthesis through multiple substrates, including the translation initiation factor eIF4B and the elongation regulator eEF2K (25, 26). Ribosome profiling analysis indicates that 4E-BPs are the master effectors of mTORC1 in controlling translation of mRNAs containing 5′ terminal oligopyrimidine tract (TOP) and TOP-like sequences (27, 28). This finding raises the question regarding the role of S6Ks in mTORC1-mediated translational regulation. Notably, the phosphorylation of S6Ks is rapamycin-sensitive, whereas mTORC1-mediated phosphorylation of 4E-BPs is largely rapamycin-resistant (29). This finding suggests that the antiaging effects of rapamycin might be mediated by the target of S6Ks rather than 4E-BPs. Supporting this notion, deletion of S6K1 in mice leads to increased life span and resistance to age-related pathologies (30). However, the differential effects of mTORC1 downstream targets on mRNA translation remain poorly understood.
Here, we sought to dissect the role of mTORC1 in various aspects of protein homeostasis. We found that persistent activation of mTORC1 signaling led to less functional proteins. The defective ribosome products were mainly due to reduced translation fidelity as a result of increased elongation speed. Rapamycin treatment largely restored protein homeostasis in these cells. The differential effects of mTORC1 downstream targets on translation fidelity further support the critical role of elongation in the quality of translational products. Our results provide mechanistic insights into the molecular connection between nutrient signaling and protein homeostasis and may offer new opportunities for treating age-related diseases.
RESULTS
Constitutively active mTORC1 signaling reduces the stability of synthesized polypeptides
To monitor the quality of translational products, we used firefly luciferase (Fluc) as a reporter, whose activity can be measured by a luminescence-based assay with exquisite sensitivity. Fluc folds rapidly upon translation on eukaryotic ribosomes and does not require posttranslational modification for its activity (31). Its sensitivity to various stress conditions makes it an ideal molecule to evaluate intracellular protein homeostasis (32). To monitor the biosynthesis of synthesized Fluc in cells with altered mTORC1 signaling, we used a real-time luminometer that allows continuous measurement of Fluc activity in live cells (23). Shortly after transfection with plasmids encoding Fluc, luciferase activity progressively accumulated in a mouse embryonic fibroblast (MEF) cell line (Fig. 1A). Unexpectedly, MEFs lacking TSC2 showed less Fluc activity with about 50% reduction by 15 hours after transfection. This was not due to a difference in transfection and transcription efficiency because Fluc mRNA abundance was comparable between these two sets of MEFs (fig. S1). To further exclude the possibility of altered transcription, we synthesized Fluc mRNA and performed mRNA transfection. Consistent with the plasmid transfection, TSC2 null cells showed lower Fluc activity than wild-type cells (Fig. 1B). Thus, constitutively active mTORC1 signaling reduces the functionality of synthesized Fluc.
Fig. 1. Constitutively active mTORC1 reduces the stability of synthesized polypeptides.

(A) Wild-type (WT) and TSC2 knockout (KO) cells were transfected with Fluc plasmids, and the Fluc activity was monitored continuously (means ± SEM; n = 6 independent experiments). (B) Similar to (A) except that the cells were transfected with Fluc mRNA (means ± SEM; n = 3 independent experiments). (C) WT and TSC2 KO cells transfected with Fluc plasmids were treated with MG132. Whole-cell lysates were separated into soluble and insoluble fractions followed by immunoblotting using antibodies as indicated. Bottom panel shows quantification of Fluc amounts (means ± SEM; n = 3 independent experiments; *P < 0.05, **P < 0.01, ratio paired t test). (D) MG132-treated WT and TSC2 KO cells were immunoblotted with the indicated antibodies. Right panel shows quantification (means ± SEM; n = 3 independent experiments; *P = 0.014, ratio paired t test).
Because mTORC1 is believed to promote protein synthesis, it was surprising to find reduced Fluc activity in TSC2 knockout cells. Immunoblotting of whole-cell lysates revealed that the steady-state amounts of Fluc were significantly lower in TSC2 knockout cells than in wild-type MEFs (Fig. 1C), which is consistent with the reduced Fluc activity measured in live cells. We then treated the transfected cells with the proteasome inhibitor MG132 to examine whether the reduced Fluc quantity was due to increased degradation. Proteasome inhibition by MG132 had minimal effects on translation initiation factors such as eIF2α (fig. S2). In comparison to wild-type cells, TSC2 knockout cells showed increased Fluc abundance after MG132 treatment with the majority recovered in the insoluble fraction (Fig. 1C). This result suggests that a substantial proportion of synthesized Fluc is short-lived in cells with increased mTORC1 signaling.
To examine the feature of other proteins under constitutively active mTORC1 signaling, we expressed green fluorescent protein (GFP), which is relatively stable in cells. Similar to Fluc, GFP also showed decreased steady-state amounts in TSC2 knockout cells with an increased accumulation after MG132 treatment (fig. S3). Proteasome inhibition leads to an accumulation of endogenous substrates in the form of polyubiquitin conjugates (33). We measured the abundance of polyubiquitinated species after MG132 treatment in cells with unrestrained mTORC1 signaling. Compared to wild-type cells, TSC2 knockout cells demonstrated a substantial increase of polyubiquitin signals with MG132 treatment (Fig. 1D). Together, these results suggest that mTORC1 signaling disrupts the stability of synthesized polypeptides.
Rheb overexpression reduces the stability of synthesized polypeptides
To independently confirm that uncontrolled mTORC1 signaling contributes to the reduced stability of translational products, we transfected human embryonic kidney (HEK) 293 cells with plasmids encoding Rheb, a direct activator of mTORC1. Rheb overexpression enhanced mTORC1 signaling in a dose-dependent manner as evidenced by increased RpS6 phosphorylation (Fig. 2). Consistent with TSC2 null cells, Rheb overexpression also resulted in a decrease of Fluc steady-state amounts in transfected HEK293 cells. MG132 treatment largely rescued the loss of Fluc, indicating a higher turnover of synthesized Fluc under Rheb overexpression. These cells also showed a higher accumulation of polyubiquitinated species in the presence of MG132 (Fig. 2, bottom panel). Thus, an increase in mTORC1 activity by Rheb overexpression also reduces the stability of synthesized polypeptides.
Fig. 2. Rheb overexpression reduces the stability of synthesized polypeptides.

MG132-treated HEK293 cells cotransfected with plasmids encoding Fluc and Rheb, supplemented with GFP, were immunoblotted with the indicated antibodies (left panel). Fluc and polyubiquitinated species were quantified after normalizing to β-actin abundance (right panels). Phosphorylated RpS6 was normalized to total RpS6 protein abundance (means ± SEM; n = 3 independent experiments).
Suppressing mTORC1 restores the stability of synthesized polypeptides
Having found that an increase in mTORC1 signaling reduced the stability of translational products, we next asked whether suppressing mTORC1 signaling by rapamycin could restore the stability of synthesized polypeptides. Although treating wild-type cells with rapamycin slightly reduced Fluc expression, the presence of rapamycin increased the steady-state Fluc amounts in TSC2 knockout cells (Fig. 3A). This was not due to an increased translation rate in the presence of rapamycin because the abundance of synthesized Fluc under proteasome inhibition remained consistent after rapamycin treatment (Fig. 3A). The presence of rapamycin also substantially decreased the amount of polyubiquitinated species accumulated after proteasome inhibition by MG132 (Fig. 3B). Therefore, suppressing mTORC1 signaling decreases protein synthesis but increases the stability of synthesized polypeptides.
Fig. 3. Suppressing mTORC1 restores the stability of synthesized polypeptides.

(A) WT and TSC2 KO cells transfected with Fluc were treated with rapamycin in the absence or presence of MG132 followed by immunoblotting with indicated antibodies. Middle panels show quantification of Fluc protein normalized to β-actin before and after rapamycin treatment. Lower panel is the quantification of phosphorylated RpS6 normalized to total RpS6 protein abundance (means ± SEM; n = 3 independent experiments; *P < 0.05, ratio paired t test). (B) Cells in (A) were immunoblotted using antibody against polyubiquitinated species. Lower panel shows quantitation of ubiquitin before and after rapamycin treatment normalized to β-actin (means ± SEM; n = 4 independent experiments; *P < 0.05, mixed model with random blots and fixed treatment using normalized values; P values are adjusted with a Bonferroni correction).
mTORC1 does not primarily affect chaperone and proteasome activities
The reduced stability of translational products under constitutively active mTORC1 signaling suggests a lower quality of newly synthesized polypeptides, or saturation of the protein quality control system in cells. Molecular chaperones and the ubiquitin-proteasome system are two major mechanisms that maintain intracellular protein homeostasis (20, 34, 35). We previously demonstrated that mTORC1 inhibited the cap-independent Hsp70 translation induced by heat shock stress (23). However, it remains unknown whether the chaperone network is adversely affected by persistent mTORC1 signaling under a nonstressed condition. To directly measure the chaperone activity in wild-type and TSC2 knockout cells, we used whole-cell lysates to refold heat-denatured Fluc. This in vitro re-folding assay revealed that the chaperone activities in both cells were comparable (Fig. 4A). Furthermore, Rheb overexpression in HEK293 cells also had no appreciable effects on cellular chaperone activities (fig. S4A).
Fig. 4. mTORC1 primarily affects translation fidelity.

(A) Heat-denatured Fluc proteins were incubated with whole-cell lysates derived from TSC2 WT and KO cells at room temperature. Fluc refolding was monitored by measuring Fluc activities at the time points indicated. Relative Fluc activity is presented (means ± SEM; n = 3 independent experiments). (B) The intracellular chymotrypsin activities in TSC2 WT and KO cells were measured by luminescent reagent (Proteasome-Glo) (means ± SEM; n = 3 independent experiments). (C) Schematic diagram of Fluc mutants Fluc(Stop) and Fluc(R218S) (left panel). TSC2 WT and KO cells were transfected with plasmids encoding Fluc mutants followed by measurement of Fluc activity. Relative Fluc activities were normalized to WT Fluc (means ± SEM; n = 4 independent experiments; **P < 0.01, paired t test). (D) WT (left panel) and TSC2 KO cells (right panel) transfected with plasmids encoding Fluc mutants as in (C) were treated with rapamycin (Rapa) followed by measurement of Fluc activity. Relative Fluc activities were normalized to WT Fluc with dimethyl sulfoxide (DMSO) (means ± SEM; n = 4 independent experiments; *P < 0.05, paired t test).
The ubiquitin-proteasome system is the main pathway for elimination of damaged proteins in eukaryotes, and its increased activity might contribute to lower steady-state protein abundance in cells with constitutively active mTORC1 signaling. To compare the proteasome activity between wild-type and TSC2 knockout cells, we used a cell-based proteasome assay in which the chymotrypsin-like activity of the proteasome can be directly measured using a luminogenic substrate (Proteasome-Glo). We observed similar chymotrypsin-like activity in both cell types (Fig. 4B). Consistently, Rheb overexpression in HEK293 cells also did not affect the proteasome activity (fig. S4B). Thus, mTORC1 does not primarily affect the intracellular proteasome system.
mTORC1 decreases translation fidelity
With no apparent influence on either chaperone or proteasome function in cells, how does constitutively active mTORC1 signaling decrease the stability of synthesized proteins? Nascent chains are synthesized during elongation, and folding generally begins during translation on the ribosome (36, 37). Thus, the efficiency of cotranslational folding is influenced by translation fidelity during elongation (38). We reasoned that dysregulated mTORC1 signaling might decrease translation fidelity and increase the generation of defective ribosomal products. To test this hypothesis, we generated two Fluc reporters to assess translational fidelity. One reporter, Fluc(Stop), has leucine at position 210 replaced with a stop codon, which leads to the synthesis of a truncated and enzymatically inactive protein product. This reporter has previously been used to assess readthrough errors occurring during translation (39). To evaluate the potential of misincorporation during translation, we mutated the arginine at the active-site position 218 into serine, which renders the resultant Fluc(R218S) mutant devoid of enzymatic activity. As expected, both Fluc(Stop) and Fluc(R218S) mutants showed less than 1% of the enzymatic activity of the wild-type Fluc; however, TSC2 knockout cells showed a significant increase in Fluc activity for both Fluc(Stop) and Fluc(R218S) when compared to wild-type cells (2- and 1.5-fold increase, respectively) (Fig. 4C). Again, this relative increase was not due to a difference in transfection efficiency between these two cells, because quantitative polymerase chain reaction (qPCR) revealed comparable amounts of Fluc mRNA (fig. S5). Consistent with the findings in TSC2 knockout cells, overexpressing Rheb in HEK293 cells also led to a higher rate of readthrough and misincorporation errors during translation of Fluc mutants (fig. S6).
Because rapamycin treatment increases the stability of synthesized proteins, we examined whether repressing mTORC1 signaling would restore translation fidelity. Indeed, rapamycin treatment decreased the functionality of Fluc mutants in both wild-type and TSC2 knockout cells (Fig. 4D). The effect of rapamycin on promoting translation fidelity in TSC2 knockout cells is an underestimate because wild-type Fluc in these cells showed increased activity in the presence of rapamycin (Fig. 4D). This is consistent with the finding that rapamycin rescues the stability of Fluc under persistent mTORC1 signaling (Fig. 3A). Therefore, repressing mTORC1 signaling increases the stability of newly synthesized polypeptides by promoting accurate mRNA translation.
mTORC1 downstream targets exhibit distinct roles in translation fidelity
Two well-established mTORC1 downstream targets are 4E-BPs and S6Ks. Although 4E-BP family proteins are the master effectors of mTORC1 in controlling translation of TOP and TOP-like mRNAs (27, 28), the phosphorylation of 4E-BPs is resistant to rapamycin treatment. Because rapamycin effectively abolishes phosphorylation of S6Ks, we suspected that rapamycin might act through S6Ks to restore translation fidelity. Indeed, enzymatic activities of transfected Fluc(Stop) and Fluc(R218S) mutants were significantly reduced in S6K1 and S6K2 double-knockout MEFs when compared to wild-type cells (Fig. 5A). This result indicates increased translation fidelity in the absence of S6Ks. In contrast, MEFs lacking both 4E-BP1 and 4E-BP2 showed comparable activity for both Fluc mutants (Fig. 5B). Considering that 4E-BPs mainly act on translation initiation, the critical role of S6Ks in translation fidelity supports the notion that ribosomal elongation may be responsible for the quality of translational products.
Fig. 5. Distinct roles of mTORC1 downstream targets in translation fidelity.

(A) WT and S6K double-KO (DKO) cells were transfected with plasmids encoding Fluc mutants. Relative Fluc activities were normalized to WT Fluc (means ± SEM; n = 4 independent experiments;**P < 0.001, paired t test). (B) WT and 4E-BP DKO cells were transfected with plasmids encoding Fluc mutants. Relative Fluc activities were normalized to WT Fluc (means ± SEM; n = 4 independent experiments). (C) WT and S6K DKO cells transfected as in (A) were treated with rapamycin. Relative Fluc activities were normalized to WT Fluc (means ± SEM; n = 3 independent experiments; *P < 0.05, **P < 0.001, paired t test). (D) WT and 4E-BP DKO cells transfected as in (B) were treated with rapamycin. Relative Fluc activities were normalized to WT Fluc (means ± SEM; n = 4 independent experiments for WT and n = 3 independent experiments for DKO; *P < 0.05, **P < 0.001, paired t test).
To substantiate the finding that rapamycin acts through S6Ks in restoring translational fidelity, we examined how rapamycin influences the translation of Fluc mutants in MEFs lacking either S6Ks or 4E-BPs. Rapamycin treatment significantly reduced the activity of transfected Fluc mutants in wild-type cells but showed no effects in S6K double-knockout cells (Fig. 5C). In contrast, the presence of rapamycin equally restored the translation fidelity in both 4E-BP wild-type and double-knockout MEFs as evidenced by the suppressed activity of Fluc mutants, in particular Fluc(Stop) (Fig. 5D). These results confirm the distinct roles of mTORC1 downstream targets in controlling the quality of translational products.
mTORC1 increases ribosome speed during translation elongation
Translation fidelity is influenced by multiple factors. For instance, defective ribosome biogenesis reduces the accuracy of amino acid incorporation (40). However, both TSC2 wild-type and knockout cells showed a similar ratio of 28S to 18S ribosomal RNAs (rRNAs) (fig. S7). The accuracy of codon-anticodon recognition is also susceptible to ribosome dynamics during elongation. In addition to translation initiation, mTORC1 promotes elongation through S6K-mediated eEF2K phosphorylation (26). We hypothesize that constitutively active mTORC1 signaling might potentially compromise the fidelity of the decoding process by increasing the speed of elongation. To evaluate the ribosome dynamics in both TSC2 wild-type and knockout cells, we performed ribosome sedimentation analysis. Consistent with an increase in cap-dependent mRNA translation, TSC2 null cells exhibited higher polysome formation than wild-type cells, and the monosome peak was correspondingly reduced (Fig. 6A). Although this feature is consistent with more efficient translation initiation in cells with increased mTORC1 signaling, the snapshot of polysome profiles does not offer insight into ribosome dynamics during elongation.
Fig. 6. mTORC1 alters ribosome dynamics during translation elongation.
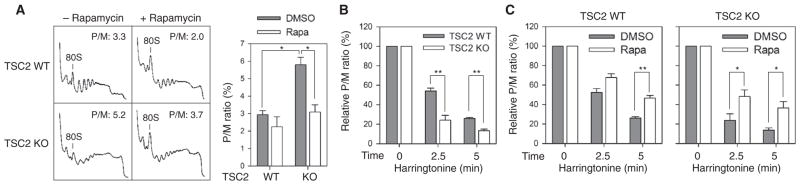
(A) Polysome profiles of WT and TSC2 KO cells in the presence of rapamycin were determined using sucrose gradient sedimentation. The P/M (polysome/monosome) ratio was calculated by measuring the areas under the polysome and 80S peak and further quantified in the left panel (means ± SEM; n = 3 independent experiments; *P < 0.05, ratio paired t test). (B) Polysome profiling of WT and TSC2 KO cells was conducted after treatment with harringtonine for indicated times. The P/M ratio was determined and normalized to no harringtonine treatment per cell type (means ± SEM; n = 4 independent experiments; **P < 0.01, paired t test). (C) WT and TSC2 KO cells were pretreated with rapamycin followed by harringtonine treatment for indicated times before polysome profiling. The P/M ratio was determined and normalized to no harringtonine treatment (means ± SEM; n = 3 independent experiments; *P < 0.05, **P < 0.01, unpaired t test).
The translation inhibitor harringtonine stalls initiating ribosomes at the start codon while allowing elongating ribosomes to run off the transcript (41). The time required for polysome depletion correlates with the global translation elongation speed. By treating cells with harringtonine for various times, we evaluated the average elongation speed (fig. S8). Compared to wild-type cells, TSC2 knockout cells showed an earlier polysome runoff, indicating faster ribosome movement during elongation (Fig. 6B).
Because rapamycin treatment essentially restored translation fidelity in TSC2 knockout cells, we examined the effect of rapamycin on ribosome dynamics. As a specific mTORC1 inhibitor, rapamycin suppresses translation initiation. Supporting this notion, the monosome peak was increased after rapamycin treatment (Fig. 6A). Intriguingly, we observed a slight increase rather than a decrease of polysome formation in TSC2 knockout cells in the presence of rapamycin. Under this condition, the retained polysome is a strong indication of ribosome slowing down during elongation. Indeed, application of harringtonine showed delayed depletion of polysomes in the presence of rapamycin (Fig. 6C). These results support the interpretation that mTORC1 decreases translation fidelity by increasing ribosome speed.
mTORC1 controls cellular susceptibility to proteotoxic stress
mTORC1 signaling adversely affected the quality of newly synthesized proteins; therefore, we reasoned that cells with persistent mTORC1 signaling might be sensitive to proteotoxic stress. To test this possibility, we treated cells with MG132 to induce proteotoxic stress and compared the cell viability between wild-type and TSC2 knockout cells. MG132 treatment significantly reduced cell growth and caused about 10% cell death in wild-type cells (Fig. 7A). In contrast, more than 20% of cell death occurred in TSC2 knockout cells after the same treatment. Because proteotoxic stress triggers apoptosis, we analyzed molecular markers of apoptosis in these cells and detected increased caspase-3 cleavage in TSC2 knockout cells (Fig. 7B).
Fig. 7. mTORC1 regulates cellular susceptibility to proteotoxic stress.

(A) WT and TSC2 KO cells were treated with MG132 in the absence or presence of rapamycin. Cell viability and morphology were assessed by phase-contrast microscope images (left panel). Images were assessed for cell viability and quantified (right panel) (means ± SEM; n = 4 independent experiments; *P < 0.05, ratio paired t test). (B) Cell samples from (A) were lysed and immunoblotted using the indicated antibodies. The amount of cleaved caspase-3 relative to the total caspase-3 was quantified (right panel) (means ± SEM; n = 3 independent experiments; **P < 0.01, ratio paired t test).
Adding rapamycin together with MG132 restored the cell viability of TSC2 null cells (Fig. 7, A B). Accordingly, there was a decrease in the proportion of cells undergoing apoptosis (Fig. 7B). These protective effects of rapamycin in response to proteotoxic stress might be attributed to the involvement of multiple pathways including macroautophagy (42). Nevertheless, our results extend the benefits of rapamycin by showing that it alleviates proteotoxic stress by increasing the quality of newly synthesized proteins.
DISCUSSION
Studies conducted in rodents over the past 70 years have shown that life span is extended by caloric restriction (43). Similar to caloric restriction, mTORC1 inhibition also extends life span in various model organisms (14, 15, 44), and administration of rapamycin to adult mice is sufficient to extend life span considerably (16). However, how mTORC1 inhibition increases longevity in mammals remains an unresolved issue. Protein synthesis–dependent and protein synthesis–independent mechanisms have been proposed, and several models have been suggested to explain the potential benefits of reducing protein synthesis. First, a decrease of overall translational products could lower the cellular burden of erroneously synthesized polypeptides. This situation results in “spare” proteolytic and chaperone function in cells, which may contribute to the observed increase in organism stress resistance and life span (45). Second, global suppression of protein synthesis may allow selective translation of a subset of mRNAs that exert a protective function (46). Here, we report that a global decrease in mRNA translation improves the fidelity of protein synthesis. Our observations not only extend the functional connection between mTORC1 and protein homeostasis (Fig. 8) but also suggest a molecular basis for how constitutively active mTORC1 signaling favors the development of age-related pathologies by disrupting protein homeostasis.
Fig. 8. Model for functional connection between mTORC1 and protein homeostasis.
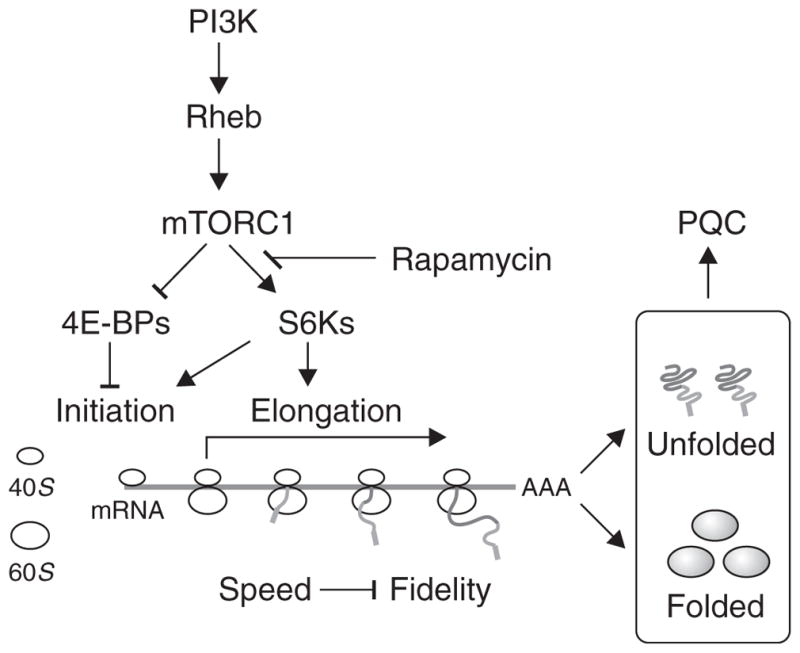
mTORC1 regulates protein synthesis at multiple stages through different downstream targets. Whereas 4E-BPs control the initiation step, S6Ks mainly promote the elongation stage. The altered ribosome dynamics when mTORC1 signaling is deregulated results in protein dyshomeostasis and disruption of the protein quality control (PQC) network. Rapamycin restores protein homeostasis by enhancing translation fidelity through the S6Ks.
mTORC1 regulates mRNA translation at multiple stages. The regulatory mechanisms impinging on the initiation stage have received considerable attention, but accumulating evidence points to the elongation phase as another target of translational control (47). We monitored ribosome dynamics in cells with altered mTORC1 signaling using the translation inhibitor harringtonine. Consistent with the positive role of mTORC1 in regulating eEF2 activity (26), TSC2 knockout cells exhibit faster ribosome runoff than the wild-type cells. Despite the wide belief that rapamycin suppresses general protein synthesis by acting primarily on translation initiation, we found that rapamycin does not disassemble the polysome, at least in the early stage. Thus, it is conceivable that rapamycin exerts additional impacts on elongation. Supporting this notion, rapamycin treatment reduces the elongation rate of ribosomes in both wild-type and TSC2 knockout cells.
One unanticipated finding in this study is the distinct roles of mTORC1 downstream targets in translation fidelity. It appears that S6Ks, but not 4E-BPs, influence the quality of translational products, presumably through the regulation of elongation. This is in agreement with the finding that mice lacking S6K1 showed increased life span and resistance to age-related pathologies (30). In contrast, deleting 4E-BPs mainly affected cell proliferation, but not cell growth (48). In addition, only the phosphorylation of S6Ks, but not 4E-BPs, is sensitive to rapamycin treatment (29). The differential effects of rapamycin on mTORC1 downstream targets support the notion that the antiaging benefits of rapamycin occur through the elongation stage by S6Ks (Fig. 8).
How does an increased elongation rate affect translation fidelity? mRNA translation is an error-prone step in gene expression with about 1 in every 103 to 104 codons mistranslated (49). Amino acid incorporation is a competitive process between the cognate and the near-cognate transfer RNAs (tRNAs) for a given codon. The increased elongation rate could potentially compromise the translational fidelity by promoting misincorporation of amino acids. Reduced elongation speed, on the other hand, allows for a relatively longer dwell time of the ribosome in its search for correct tRNA pairing. It is thus conceivable that an increased translation speed, such as that under constitutively active mTOR signaling, generates more aberrant translational products. In addition, variations of elongation speed may coordinate cotranslational folding of emerging polypeptides (37). The local discontinuous translation (ribosome pausing) temporally separates the translation of segments of the peptide chain and actively coordinates their cotranslational folding (50). Supporting this notion, a study in Escherichia coli has demonstrated that slowing translation speed enhances protein folding efficiency (51). The faster translation speed may eliminate the ribosome pausing necessary for cotranslational events. Supporting this notion, we observed an inverse correlation between elongation speed and the quality of nascent polypeptides in mammalian cells.
Ribosome biogenesis is largely controlled by mTORC1 at the level of translation because ribosomal subunits are encoded by TOP mRNAs (28, 52). The reduced translation fidelity under constitutively active mTORC1 signaling could create errors in synthesized ribosomal proteins, which may cause an error catastrophe due to dysfunctional translation machinery. This catastrophe would create additional errors of newly synthesized polypeptides. We cannot exclude the possibility that this may account for the reduced quality of synthesized proteins. It remains to be investigated whether cells with unrestrained mTORC1 signaling contain defective ribosome subunits.
The observations described in this study have several implications. First, the critical role of mTORC1 in ribosome dynamics and translation quality extends the molecular linkage between mTORC1 and protein homeostasis. Second, the finding that an increase in protein synthesis is accompanied by a decrease in protein quality provides a plausible mechanism for how persistent mTORC1 signaling favors the development of age-related pathologies. With the most common feature of aging being an accumulation of misfolded proteins derived from erroneous biosynthesis and postsynthetic modification, protein homeostasis is an important mediator of rapamycin in longevity.
MATERIALS AND METHODS
Cell lines and reagents
TSC2 wild-type and knockout MEFs were provided by D. J. Kwiatkowski (Harvard Medical School). 4E-BP wild-type and double-knockout MEFs were provided by N. Sonenberg (McGill University), and S6K wild-type and double-knockout MEFs by G. Thomas (University of Cincinnati). All cell lines were maintained in Dulbecco’s modified Eagle’s medium with 10% fetal bovine serum grown at 37°C with 5% CO2. Cycloheximide, rapamycin, and MG132 were purchased from Sigma, and harringtonine from LKT Laboratories. Dual-Luciferase Assay System, Luciferase Assay System, and Proteasome-Glo kit were purchased from Promega. D-Luciferin was purchased from Registech. Antibodies against phosphorylated and total S6 and caspase-3 were purchased from Cell Signaling Technology; β-actin from Sigma-Aldrich; myc from Santa Cruz; and polyubiquitin from Assay Designs. Anti-Fluc was purchased from Novus Biologicals.
Plasmids and transfection
The Fluc gene was directly removed from pGL3 vector (Promega) with Hind III and Xba I sites and then cloned into pcDNA3.1 (Invitrogen). Fluc mutants for fidelity assays were created from pGL3 vector with PCR Mutagenesis Kit (Agilent Technologies) with the following primers: Fluc(Stop), 5′-GGTCTGCCTAAAGGTGTCGCTTAGCCTCATAGAACTGCC-3′; Fluc(R218S), 5′-GCCTCATAGAACTGCCTGCGTGTCTTTCTCGC-ATGCCAGAGATCC-3′. Plasmids encoding Rheb-myc were provided by K.-L. Guan (University of California, San Diego). Transfection was performed with Lipofectamine 2000 (Invitrogen) according to the manufacturer’s instructions.
mRNA in vitro transcription
mRNA with a m7G-cap was synthesized with the mMessage mMachine T7 Ultra Kit (Ambion), followed by purification with the MEGAclear Kit (Ambion), according to the manufacturer’s instructions. mRNA transfections were performed with Lipofectamine 2000 (Invitrogen) according to the manufacturer’s instructions.
Luciferase assay
For real-time measurement of Fluc activity, cells were plated on 35-mm dishes and transfected with plasmid or mRNA containing the Fluc gene. Immediately after transfection, 1 mM luciferase substrate D-luciferin was added into the culture medium, and the Fluc activity was recorded at 37°C with 5% CO2 using Kronos Dio Luminometer (ATTO). For luciferase assay with cell lysates, Fluc activity was measured with a luciferase reporter assay (Promega) on a Synergy HT Multi-detection Microplate Reader (BioTek Instruments). For the fidelity assay, Fluc activity from Fluc mutants was normalized to Fluc activity derived from pGL3.
In vitro refolding assay
QuantiLum Recombinant Fluc (Promega) was diluted in lysis buffer at a concentration of 50 μg/ml and then split into two individual Eppendorf tubes. One tube was placed at 42°C for 15 min to denature Fluc, whereas the other was kept at room temperature. The denatured or nondenatured Fluc protein was then added to cell lysates for a final concentration of 16.5 μg/ml. Refolding was conducted at room temperature, and the Fluc activity was monitored every 15 min with the Promega Luciferase Assay System. Fluc activity in lysis buffer alone was measured in parallel to exclude spontaneous refolding of denatured Fluc. The nondenatured Fluc activity was used to normalize the denatured Fluc activity after cell lysate–mediated refolding.
Immunoblotting
Cells were lysed on ice in tris-buffered saline (TBS) buffer [50 mM tris-HCl (pH 7.5), 150 mM NaCl, 1 mM EDTA] containing protease inhibitor cocktail tablet (Roche) and 2% Triton X-100. After incubating on ice for 30 min with interval vortexing, the lysates were centrifuged for 5 min at 12,500 rpm, and an aliquot was removed for quantification by Bradford assay (Bio-Rad). Samples were adjusted to 1 μg/μl and heated for 5 min in SDS–polyacrylamide gel electrophoresis (SDS-PAGE) sample buffer [50 mM tris-HCl (pH 6.8), 100 mM dithiothreitol (DTT), 2% SDS, 0.1% bromophenol blue, 10% glycerol]. For fractionation analysis, the Triton X-100–soluble and Triton X-100–insoluble fractions were dissolved individually in SDS-PAGE sample buffer. Proteins were resolved on SDS-PAGE and transferred to Immobilon-P membranes (Millipore). Membranes were blocked for 30 min in TBS containing 5% blotting milk, followed by incubation with primary antibodies overnight. After several washes with TBS containing 0.1% Tween 20, the membrane was incubated with horseradish peroxidase–coupled secondary antibodies. Immunoblots were developed with enhanced chemiluminescence (ECL Plus, GE Healthcare). Individual Western experiments were quantified with ImageJ software and normalized to either β-actin or total protein of phosphorylated target as a loading control.
Reverse transcription PCR and qPCR
Total RNA was extracted from whole-cell lysates with TRIzol reagent (Invitrogen) according to the manufacturer’s instructions. RNA quality was validated by NanoVue Spectrophotometer (GE Healthcare) and run on an agarose gel for integrity examination. Reverse transcription was performed with SuperScript III kit (Invitrogen) followed by PCR. The primers for the Fluc gene are 5′-ATTTATCGGAGTTGCAGTTGCGCC-3′–(forward) and 5′-CCAGCAGCGCACTTTGAATCTTGT-3′–(reverse), and the primers for 18S are 5′-CTTGGATGTGGTAGCCGTTT-3′–(forward) and 5′-TATGGTTCCTTTGGCGCTC-3′–(reverse). For qPCR, reverse transcription was performed with High Capacity cDNA Reverse Transcription Kit (Applied Biosystems). qPCR was then conducted with Power SYBR Green PCR Master Mix (Applied Biosystems) according to the manufacturer’s protocols. PCR was performed on a LightCycler 480 Real-Time PCR System (Roche Applied Science) with three technical replicates per sample per run. The primers for the Fluc gene are 5′-ATCCGGAAGCGAC-CAACGCC-3′–(forward) and 5′-GTCGGGAAGACCTGCCACGC -3′–(reverse), and the primers for β-actin are 5′-TTGCTGACAGGATGCA-GAAG-3′–(forward) and 5′-ACTCCTGCTTGCTGATCCACAT-3′–(reverse).
Polysome profiling
A sucrose solution was prepared in polysome buffer [10 mM Hepes (pH 7.4), 100 mM KCl, 5 mM MgCl2, cycloheximide (100 μg/ml), 5 mM DTT]. A 15 to 45% sucrose density gradient was prepared in SW41 ultracentrifuge tubes (Fisher) with a Gradient Master (BioComp Instruments). Cells were treated with cycloheximide (100 μg/ml) for 3 min at 37°C in culture media followed by lysis in ice-cold polysome buffer containing 2% Triton X-100. Lysate was centrifuged for 10 min at 12,500 rpm, and 500 μl of supernatant was loaded onto sucrose gradient and centrifuged for 100 min at 38,000g at 4°C in a SW40 rotor. Gradients were fractioned at 0.75 ml/min with an automated fractionation system (ISCO), which continually monitors absorbance values at 254 nm. For rescue experiments, rapamycin was used at 20 nM for 3 hours before the addition of cycloheximide. For the ribosome runoff assay, cells were pretreated with harringtonine (1 μg/ml) with or without 20 nM rapamycin for up to 5 min before the addition of cycloheximide.
Proteotoxic stress and viability assay
TSC2 wild-type and knockout MEFs were treated with 10 μM MG132 overnight with or without 10 nM rapamycin. Multiple fields were selected for examination by a Nikon Eclipse Ti-S inverted microscope. Cells were then collected and counted with trypan blue staining. Four counts were made per sample and averaged for viability assay.
Statistics
For each analysis, raw values were used when possible or raw values were normalized to an internal control from at least three biologically independent experiments. The data are expressed as means ± SEM. For each comparison, the relevant comparisons were chosen on the basis of the assay. A Bonferroni correction was used to adjust the P values for multiple comparisons within Fig. 3B. Statistical significance is denoted by *P < 0.05 and **P < 0.01. Microsoft Excel, GraphPad Prism 6, and JMP software were used for statistical analyses.
Supplementary Material
Fig. S1. Quantification of Fluc mRNA abundance in wild-type and TSC2 knockout cells.
Fig. S2. Phosphorylation status of eIF2α in wild-type and TSC2 knockout cells.
Fig. S3. Features of GFP in wild-type and TSC2 knockout cells.
Fig. S4. Chaperone and proteasome activity in cells expressing Rheb.
Fig. S5. Quantification of mRNA abundance of Fluc mutants in wild-type and TSC2 knockout cells.
Fig. S6. Translation fidelity in cells expressing Rheb.
Fig. S7. Ratio of 28S to 18S rRNAs in wild-type and TSC2 knockout cells.
Fig. S8. Measurement of ribosome dynamics during translation elongation.
Acknowledgments
We thank Qian laboratory members for helpful discussion of the manuscript and E. Ferrie for technical assistance. We are grateful to D. Kwiatkowski (Harvard), G. Thomas (University of Cincinnati), and N. Sonenberg (McGill University) for providing MEF cell lines and K.-L. Guan (University of California, San Diego) for Rheb plasmids. We also thank the Stover and Qi laboratories at Cornell for equipment accessibility.
Funding: This work was supported by grants to S.-B.Q. from the NIH (1 DP2 OD006449-01), the Ellison Medical Foundation (AG-NS-0605-09), and the Department of Defense Exploration-Hypothesis Development Award (W81XWH-11-1-0236). C.S.C. was partially supported by an NIH training grant for Cornell University Genetics, Genomics and Development Graduate Program (T32GM00761).
Footnotes
Author contributions: C.S.C. and S.-B.Q. conceived and designed the project; C.S.C. performed the experiments; and C.S.C. and S.-B.Q. wrote the manuscript.
Competing interests: The authors declare that they have no competing interests.
REFERENCES AND NOTES
- 1.Wullschleger S, Loewith R, Hall MN. TOR signaling in growth and metabolism. Cell. 2006;124:471–484. doi: 10.1016/j.cell.2006.01.016. [DOI] [PubMed] [Google Scholar]
- 2.Laplante M, Sabatini DM. mTOR signaling in growth control and disease. Cell. 2012;149:274–293. doi: 10.1016/j.cell.2012.03.017. [DOI] [PMC free article] [PubMed] [Google Scholar]
- 3.Ma XM, Blenis J. Molecular mechanisms of mTOR-mediated translational control. Nat Rev Mol Cell Biol. 2009;10:307–318. doi: 10.1038/nrm2672. [DOI] [PubMed] [Google Scholar]
- 4.Sonenberg N, Hinnebusch AG. Regulation of translation initiation in eukaryotes: Mechanisms and biological targets. Cell. 2009;136:731–745. doi: 10.1016/j.cell.2009.01.042. [DOI] [PMC free article] [PubMed] [Google Scholar]
- 5.Inoki K, Guan KL. Complexity of the TOR signaling network. Trends Cell Biol. 2006;16:206–212. doi: 10.1016/j.tcb.2006.02.002. [DOI] [PubMed] [Google Scholar]
- 6.Huang J, Manning BD. The TSC1–TSC2 complex: A molecular switchboard controlling cell growth. Biochem J. 2008;412:179–190. doi: 10.1042/BJ20080281. [DOI] [PMC free article] [PubMed] [Google Scholar]
- 7.Kwiatkowski DJ, Manning BD. Tuberous sclerosis: A GAP at the crossroads of multiple signaling pathways. Hum Mol Genet. 2005;14:R251–R258. doi: 10.1093/hmg/ddi260. [DOI] [PubMed] [Google Scholar]
- 8.Goto J, Talos DM, Klein P, Qin W, Chekaluk YI, Anderl S, Malinowska IA, Di Nardo A, Bronson RT, Chan JA, Vinters HV, Kernie SG, Jensen FE, Sahin M, Kwiatkowski DJ. Regulable neural progenitor-specific Tsc1 loss yields giant cells with organellar dysfunction in a model of tuberous sclerosis complex. Proc Natl Acad Sci USA. 2011;108:E1070–E1079. doi: 10.1073/pnas.1106454108. [DOI] [PMC free article] [PubMed] [Google Scholar]
- 9.Zoncu R, Efeyan A, Sabatini DM. mTOR: From growth signal integration to cancer, diabetes and ageing. Nat Rev Mol Cell Biol. 2011;12:21–35. doi: 10.1038/nrm3025. [DOI] [PMC free article] [PubMed] [Google Scholar]
- 10.Kenyon C. The plasticity of aging: Insights from long-lived mutants. Cell. 2005;120:449–460. doi: 10.1016/j.cell.2005.02.002. [DOI] [PubMed] [Google Scholar]
- 11.Cohen E, Paulsson JF, Blinder P, Burstyn-Cohen T, Du D, Estepa G, Adame A, Pham HM, Holzenberger M, Kelly JW, Masliah E, Dillin A. Reduced IGF-1 signaling delays age-associated proteotoxicity in mice. Cell. 2009;139:1157–1169. doi: 10.1016/j.cell.2009.11.014. [DOI] [PMC free article] [PubMed] [Google Scholar]
- 12.Fontana L. The scientific basis of caloric restriction leading to longer life. Curr Opin Gastroenterol. 2009;25:144–150. doi: 10.1097/MOG.0b013e32831ef1ba. [DOI] [PubMed] [Google Scholar]
- 13.Kapahi P, Chen D, Rogers AN, Katewa SD, Li PW, Thomas EL, Kockel L. With TOR, less is more: A key role for the conserved nutrient-sensing TOR pathway in aging. Cell Metab. 2010;11:453–465. doi: 10.1016/j.cmet.2010.05.001. [DOI] [PMC free article] [PubMed] [Google Scholar]
- 14.Kapahi P, Zid BM, Harper T, Koslover D, Sapin V, Benzer S. Regulation of lifespan in Drosophila by modulation of genes in the TOR signaling pathway. Curr Biol. 2004;14:885–890. doi: 10.1016/j.cub.2004.03.059. [DOI] [PMC free article] [PubMed] [Google Scholar]
- 15.Kaeberlein M, Powers RW, III, Steffen KK, Westman EA, Hu D, Dang N, Kerr EO, Kirkland KT, Fields S, Kennedy BK. Regulation of yeast replicative life span by TOR and Sch9 in response to nutrients. Science. 2005;310:1193–1196. doi: 10.1126/science.1115535. [DOI] [PubMed] [Google Scholar]
- 16.Harrison DE, Strong R, Sharp ZD, Nelson JF, Astle CM, Flurkey K, Nadon NL, Wilkinson JE, Frenkel K, Carter CS, Pahor M, Javors MA, Fernandez E, Miller RA. Rapamycin fed late in life extends lifespan in genetically heterogeneous mice. Nature. 2009;460:392–395. doi: 10.1038/nature08221. [DOI] [PMC free article] [PubMed] [Google Scholar]
- 17.Pan KZ, Palter JE, Rogers AN, Olsen A, Chen D, Lithgow GJ, Kapahi P. Inhibition of mRNA translation extends lifespan in Caenorhabditis elegans. Aging Cell. 2007;6:111–119. doi: 10.1111/j.1474-9726.2006.00266.x. [DOI] [PMC free article] [PubMed] [Google Scholar]
- 18.Hansen M, Taubert S, Crawford D, Libina N, Lee SJ, Kenyon C. Lifespan extension by conditions that inhibit translation in Caenorhabditis elegans. Aging Cell. 2007;6:95–110. doi: 10.1111/j.1474-9726.2006.00267.x. [DOI] [PubMed] [Google Scholar]
- 19.Syntichaki P, Troulinaki K, Tavernarakis N. eIF4E function in somatic cells modulates ageing in Caenorhabditis elegans. Nature. 2007;445:922–926. doi: 10.1038/nature05603. [DOI] [PubMed] [Google Scholar]
- 20.Balch WE, Morimoto RI, Dillin A, Kelly JW. Adapting proteostasis for disease intervention. Science. 2008;319:916–919. doi: 10.1126/science.1141448. [DOI] [PubMed] [Google Scholar]
- 21.Morimoto RI. Proteotoxic stress and inducible chaperone networks in neuro-degenerative disease and aging. Genes Dev. 2008;22:1427–1438. doi: 10.1101/gad.1657108. [DOI] [PMC free article] [PubMed] [Google Scholar]
- 22.Bukau B, Weissman J, Horwich A. Molecular chaperones and protein quality control. Cell. 2006;125:443–451. doi: 10.1016/j.cell.2006.04.014. [DOI] [PubMed] [Google Scholar]
- 23.Sun J, Conn CS, Han Y, Yeung V, Qian SB. PI3K-mTORC1 attenuates stress response by inhibiting cap-independent Hsp70 translation. J Biol Chem. 2011;286:6791–6800. doi: 10.1074/jbc.M110.172882. [DOI] [PMC free article] [PubMed] [Google Scholar]
- 24.Jackson RJ, Hellen CU, Pestova TV. The mechanism of eukaryotic translation initiation and principles of its regulation. Nat Rev Mol Cell Biol. 2010;11:113–127. doi: 10.1038/nrm2838. [DOI] [PMC free article] [PubMed] [Google Scholar]
- 25.Dann SG, Selvaraj A, Thomas G. mTOR Complex1–S6K1 signaling: At the crossroads of obesity, diabetes and cancer. Trends Mol Med. 2007;13:252–259. doi: 10.1016/j.molmed.2007.04.002. [DOI] [PubMed] [Google Scholar]
- 26.Proud CG. mTOR signalling in health and disease. Biochem Soc Trans. 2011;39:431–436. doi: 10.1042/BST0390431. [DOI] [PubMed] [Google Scholar]
- 27.Hsieh AC, Liu Y, Edlind MP, Ingolia NT, Janes MR, Sher A, Shi EY, Stumpf CR, Christensen C, Bonham MJ, Wang S, Ren P, Martin M, Jessen K, Feldman ME, Weissman JS, Shokat KM, Rommel C, Ruggero D. The translational landscape of mTOR signalling steers cancer initiation and metastasis. Nature. 2012;485:55–61. doi: 10.1038/nature10912. [DOI] [PMC free article] [PubMed] [Google Scholar]
- 28.Thoreen CC, Chantranupong L, Keys HR, Wang T, Gray NS, Sabatini DM. A unifying model for mTORC1-mediated regulation of mRNA translation. Nature. 2012;485:109–113. doi: 10.1038/nature11083. [DOI] [PMC free article] [PubMed] [Google Scholar]
- 29.Choo AY, Yoon SO, Kim SG, Roux PP, Blenis J. Rapamycin differentially inhibits S6Ks and 4E-BP1 to mediate cell-type-specific repression of mRNA translation. Proc Natl Acad Sci USA. 2008;105:17414–17419. doi: 10.1073/pnas.0809136105. [DOI] [PMC free article] [PubMed] [Google Scholar]
- 30.Selman C, Tullet JM, Wieser D, Irvine E, Lingard SJ, Choudhury AI, Claret M, Al-Qassab H, Carmignac D, Ramadani F, Woods A, Robinson IC, Schuster E, Batterham RL, Kozma SC, Thomas G, Carling D, Okkenhaug K, Thornton JM, Partridge L, Gems D, Withers DJ. Ribosomal protein S6 kinase 1 signaling regulates mammalian life span. Science. 2009;326:140–144. doi: 10.1126/science.1177221. [DOI] [PMC free article] [PubMed] [Google Scholar]
- 31.Frydman J, Erdjument-Bromage H, Tempst P, Hartl FU. Co-translational domain folding as the structural basis for the rapid de novo folding of firefly luciferase. Nat Struct Biol. 1999;6:697–705. doi: 10.1038/10754. [DOI] [PubMed] [Google Scholar]
- 32.Gupta R, Kasturi P, Bracher A, Loew C, Zheng M, Villella A, Garza D, Hartl FU, Raychaudhuri S. Firefly luciferase mutants as sensors of proteome stress. Nat Methods. 2011;8:879–884. doi: 10.1038/nmeth.1697. [DOI] [PubMed] [Google Scholar]
- 33.Qian SB, Ott DE, Schubert U, Bennink JR, Yewdell JW. Fusion proteins with COOH-terminal ubiquitin are stable and maintain dual functionality in vivo. J Biol Chem. 2002;277:38818–38826. doi: 10.1074/jbc.M205547200. [DOI] [PubMed] [Google Scholar]
- 34.Hartl FU, Bracher A, Hayer-Hartl M. Molecular chaperones in protein folding and proteostasis. Nature. 2011;475:324–332. doi: 10.1038/nature10317. [DOI] [PubMed] [Google Scholar]
- 35.Sherman MY, Goldberg AL. Cellular defenses against unfolded proteins: A cell biologist thinks about neurodegenerative diseases. Neuron. 2001;29:15–32. doi: 10.1016/s0896-6273(01)00177-5. [DOI] [PubMed] [Google Scholar]
- 36.Fedorov AN, Baldwin TO. Cotranslational protein folding. J Biol Chem. 1997;272:32715–32718. doi: 10.1074/jbc.272.52.32715. [DOI] [PubMed] [Google Scholar]
- 37.Komar AA. A pause for thought along the co-translational folding pathway. Trends Biochem Sci. 2009;34:16–24. doi: 10.1016/j.tibs.2008.10.002. [DOI] [PubMed] [Google Scholar]
- 38.Buchan JR, Stansfield I. Halting a cellular production line: Responses to ribosomal pausing during translation. Biol Cell. 2007;99:475–487. doi: 10.1042/BC20070037. [DOI] [PubMed] [Google Scholar]
- 39.Rakwalska M, Rospert S. The ribosome-bound chaperones RAC and Ssb1/2p are required for accurate translation in Saccharomyces cerevisiae. Mol Cell Biol. 2004;24:9186–9197. doi: 10.1128/MCB.24.20.9186-9197.2004. [DOI] [PMC free article] [PubMed] [Google Scholar]
- 40.Belin S, Beghin A, Solano-Gonzàlez E, Bezin L, Brunet-Manquat S, Textoris J, Prats AC, Mertani HC, Dumontet C, Diaz JJ. Dysregulation of ribosome biogenesis and translational capacity is associated with tumor progression of human breast cancer cells. PLoS One. 2009;4:e7147. doi: 10.1371/journal.pone.0007147. [DOI] [PMC free article] [PubMed] [Google Scholar]
- 41.Ingolia NT, Lareau LF, Weissman JS. Ribosome profiling of mouse embryonic stem cells reveals the complexity and dynamics of mammalian proteomes. Cell. 2011;147:789–802. doi: 10.1016/j.cell.2011.10.002. [DOI] [PMC free article] [PubMed] [Google Scholar]
- 42.Zhou X, Ikenoue T, Chen X, Li L, Inoki K, Guan KL. Rheb controls misfolded protein metabolism by inhibiting aggresome formation and autophagy. Proc Natl Acad Sci USA. 2009;106:8923–8928. doi: 10.1073/pnas.0903621106. [DOI] [PMC free article] [PubMed] [Google Scholar]
- 43.McCay CM, Crowell MF, Maynard LA. The effect of retarded growth upon the length of life span and upon the ultimate body size. 1935. Nutrition. 1989;5:155–171. [PubMed] [Google Scholar]
- 44.Powers RW, III, Kaeberlein M, Caldwell SD, Kennedy BK, Fields S. Extension of chronological life span in yeast by decreased TOR pathway signaling. Genes Dev. 2006;20:174–184. doi: 10.1101/gad.1381406. [DOI] [PMC free article] [PubMed] [Google Scholar]
- 45.Hipkiss AR. On why decreasing protein synthesis can increase lifespan. Mech Ageing Dev. 2007;128:412–414. doi: 10.1016/j.mad.2007.03.002. [DOI] [PubMed] [Google Scholar]
- 46.Zid BM, Rogers AN, Katewa SD, Vargas MA, Kolipinski MC, Lu TA, Benzer S, Kapahi P. 4E-BP extends lifespan upon dietary restriction by enhancing mitochondrial activity in Drosophila. Cell. 2009;139:149–160. doi: 10.1016/j.cell.2009.07.034. [DOI] [PMC free article] [PubMed] [Google Scholar]
- 47.Proud CG. mTORC1 signalling and mRNA translation. Biochem Soc Trans. 2009;37:227–231. doi: 10.1042/BST0370227. [DOI] [PubMed] [Google Scholar]
- 48.Dowling RJ, Topisirovic I, Alain T, Bidinosti M, Fonseca BD, Petroulakis E, Wang X, Larsson O, Selvaraj A, Liu Y, Kozma SC, Thomas G, Sonenberg N. mTORC1-mediated cell proliferation, but not cell growth, controlled by the 4E-BPs. Science. 2010;328:1172–1176. doi: 10.1126/science.1187532. [DOI] [PMC free article] [PubMed] [Google Scholar]
- 49.Gingold H, Pilpel Y. Determinants of translation efficiency and accuracy. Mol Syst Biol. 2011;7:481. doi: 10.1038/msb.2011.14. [DOI] [PMC free article] [PubMed] [Google Scholar]
- 50.Zhang G, Hubalewska M, Ignatova Z. Transient ribosomal attenuation coordinates protein synthesis and co-translational folding. Nat Struct Mol Biol. 2009;16:274–280. doi: 10.1038/nsmb.1554. [DOI] [PubMed] [Google Scholar]
- 51.Siller E, DeZwaan DC, Anderson JF, Freeman BC, Barral JM. Slowing bacterial translation speed enhances eukaryotic protein folding efficiency. J Mol Biol. 2010;396:1310–1318. doi: 10.1016/j.jmb.2009.12.042. [DOI] [PubMed] [Google Scholar]
- 52.Hamilton TL, Stoneley M, Spriggs KA, Bushell M. TOPs and their regulation. Biochem Soc Trans. 2006;34:12–16. doi: 10.1042/BST20060012. [DOI] [PubMed] [Google Scholar]
Associated Data
This section collects any data citations, data availability statements, or supplementary materials included in this article.
Supplementary Materials
Fig. S1. Quantification of Fluc mRNA abundance in wild-type and TSC2 knockout cells.
Fig. S2. Phosphorylation status of eIF2α in wild-type and TSC2 knockout cells.
Fig. S3. Features of GFP in wild-type and TSC2 knockout cells.
Fig. S4. Chaperone and proteasome activity in cells expressing Rheb.
Fig. S5. Quantification of mRNA abundance of Fluc mutants in wild-type and TSC2 knockout cells.
Fig. S6. Translation fidelity in cells expressing Rheb.
Fig. S7. Ratio of 28S to 18S rRNAs in wild-type and TSC2 knockout cells.
Fig. S8. Measurement of ribosome dynamics during translation elongation.