

Abstract
Previous studies have found that Alzheimer’s disease (AD) impairs cerebral vascular function, even at early stages of the disease. This offers the prospect of a useful diagnostic method for AD, if cerebral vascular dysfunction can be quantified reliably within practical clinical constraints. We present a recently developed methodology that utilizes a data-based dynamic nonlinear closed-loop model of cerebral hemodynamics to compute “physiomarkers” quantifying the state of cerebral flow autoregulation to pressure-changes (CA) and cerebral CO2 vasomotor reactivity (CVMR) in each subject. This model is estimated from beat-to-beat measurements of mean arterial blood pressure, mean cerebral blood flow velocity and end-tidal CO2, which can be made reliably and non-invasively under resting conditions. This model may also take an open-loop form and comparisons are made with the closed-loop counterpart. The proposed model-based physiomarkers take the form of two indices that quantify the gain of the CA and CVMR processes in each subject. It was found in an initial set of clinical data that the CVMR index delineates AD patients from control subjects and, therefore, may prove useful in the improved diagnosis of early-stage AD.
Keywords: Alzheimer’s disease, Physiomarkers, Modeling cerebral hemodynamics, Closed-loop modeling, Cerebral flow autoregulation, Cerebral vasomotor reactivity
INTRODUCTION
It has been shown that the progression of cognitive impairment in patients with Alzheimer disease (AD) is likely to be associated with impairment of cerebral vascular function,2,4,10,14,17–19,34,35,43,44 even at the early stages of AD. The presence of the amyloid-beta peptide has been established as a hallmark of AD13,41,45,47 and its effects on cerebrovascular function have also been established, as well as the influence of cerebrovascular lesions on the clinical expression of AD.7,16,22,42,46 Some studies have even suggested that AD is a cerebrovascular disorder or at least contributes to the onset or progression of AD.10 Thus, if objective measures of cerebral hemodynamic function can be obtained safely and reliably in a clinical setting, then they may offer additional means for improved diagnosis of AD, even at early stages. Such quantitative measures may also be used to monitor the disease progress over time and assist in assessing the effects of therapeutic treatments.
Cerebral flow autoregulation in response to pressure-changes (CA) and cerebral CO2 vasomotor reactivity (CVMR) are two fundamental aspects of cerebral hemodynamic autoregulation (CHAR).1,3,5,6,8,9,11,12,20,23,30–33,36–40,48,49,51,52 This paper applies a recently developed methodology for open-loop 27 and closed-loop 28 modeling of cerebral hemodynamics to an initial set of eight early-stage AD patients and eight control subjects in order to explore the potential of using model-based “physiomarkers” for improved diagnosis of early-stage AD. This model yields quantitative measures of the two key functional aspects of CHAR, CA and CVMR, in the form of subject-specific indices of the nonlinear dynamics of this system. Since the CA and CVMR indices are derived from data-based models, they are objective and quantitative measures of the underlying physiological processes. Whether they can also be sensitive “physiomarkers” for improved clinical diagnosis will have to be ascertained through the analysis of adequate clinical data. The results presented in this paper from a small set of initial clinical data appear rather encouraging with regard to the potential utility of the CVMR index to delineate AD patients from control subjects on the basis of the quantified impairment in vasomotor reactivity in AD. However, this is only a pilot study and definite conclusions cannot be drawn regarding the potential clinical utility of this approach before extensive clinical data become properly analyzed in the future.
Our ability to quantify reliably the hemodynamic properties of each subject hinges on accurate estimation of an appropriate model for the CHAR process, using time-series hemodynamic measurements that are feasible in a clinical context. Because of its vital importance, CHAR has received considerable attention and many studies have sought to advance our understanding of the underlying physiological mechanisms using computational models that describe the quantitative relationship between beat-to-beat measurements of arterial blood pressure and cerebral blood flow for various levels of CO2 tension.1,3,5,6,8,9,11,12,20,23,27,28,30–33,36–40,48,49,51,52 The requisite data for the estimation of such models can be collected non-invasively, safely and comfortably in a clinical setting under resting conditions. However, this modeling task has been confounded by many intrinsic complexities of the system, including nonlinearities, nonstationarities and the presence of multiple physiological mechanisms that maintain cerebral blood flow within appropriate bounds for normal changes of perfusion pressure or CO2 tension.
Most of the CHAR modeling studies to date have been placed in a linear context (because of its relative simplicity) and have sought to estimate the Transfer Function of the frequency-dependent relationship between input and output variables. These linear modeling studies have shown reduced coherence below 0.1 Hz, indicating the presence of intrinsic CHAR nonlinearities—an observation that motivated nonlinear modeling studies using variants of the Volterra approach that exhibit predictive capability superior to linear methods.30–33 Recently, we have utilized the novel concept of Principal Dynamic Modes (PDMs), associated with Volterra-type nonlinear modeling, to achieve a more compact model of the CHAR process and offer the prospect of physiological interpretation of the obtained model.27,28 PDM-based modeling has been introduced by our group in this and other physiological domains to enable accurate dynamic nonlinear modeling of physiological systems from relatively short data-records.21,29 The initial studies were placed in the input–output context of an open-loop configuration. Recently, we introduced the closed-loop analysis of the CHAR system, because arterial blood pressure and flow variations are mutually dependent,28 with the expectation that it will allow new insights into the CHAR process and yield more reliable measures for CVMR and CA.
The purpose of this paper is to present initial results of open-loop and closed-loop analysis of CHAR in a small set of eight early-stage AD patients and eight control subjects under resting conditions in order to explore the potential utility of model-based “physiomarkers” of CVMR and CA for improved diagnosis of early AD via quantitative delineation of AD patients from control subjects. Our working hypothesis is that the AD patients will exhibit smaller values of the model-based CVMR index indicating impaired vasomotor reactivity.
METHODS
Experimental Methods
Eight control subjects and eight age-matched patients with early-stage Alzheimer’s disease (AD) participated voluntarily in this study and signed the Informed Consent Form that has been approved by the IRB of the University of Texas Southwestern Medical Center and Presbyterian Hospital of Dallas, where the data were collected at the Institute for Exercise and Environmental Medicine. Early-stage AD was defined in patients who have received a diagnosis of “probable” AD according to the NINDS/ADRD criteria. Demographic characteristics of the study participants and cognitive assessments have been reported previously.5 Arterial blood pressure was measured continuously and non-invasively with finger photoplethysmography (Finapres) and cerebral blood flow velocity was measured in the middle cerebral artery using a 2 MHz transcranial Doppler (TCD) probe (Multiflow, DWL) placed over the temporal window and fixed at constant angle with a custom-made holder. Heart rate was monitored by electrocardiogram (ECG) and end-tidal CO2 tension was obtained via a nasal cannula using capnography (Criticare Systems) All experiments were performed in the morning in a quiet, environmentally controlled laboratory under resting conditions. After 20 min of supine rest, 5–6 min of recordings were made in supine position for four pairs of control subjects (CS) and Alzheimer’s patients (AP), as well as in sitting position for another four pairs of CS and AP. These non-invasive measurements are reliable, safe and comfortable for older subjects. Data collected from 16 other control subjects in supine position under resting conditions (from another study of the Institute for Exercise and Environmental Medicine, Southwestern Medical Center) were used to obtain the “global” PDMs and the normative statistics of the model-based physiomarkers that are utilized as the reference set in this study for the purpose of evaluating the model-based indices obtained for the target group of 8 CS and 8 AP (4 pairs in sitting position and 4 pairs in supine position).
Data Preprocessing
The continuous recordings of arterial blood pressure, end-tidal CO2 and cerebral blood flow velocity were reduced to beat-to-beat time-series data by averaging the signals over each R–R interval to yield the three physiological time-series variables of interest: mean arterial blood pressure (MABP), end-tidal CO2 (ETCO2) and mean cerebral blood flow velocity (MCBFV). Occasional measurement artifacts were removed by applying a threshold criterion on the maximum change that is physiologically possible from beat to beat in these variables (threshold values of 6 mmHg maximum beat-to-beat change for MABP or ETCO2, and 5 cm/s maximum beat-to-beat change for MCBFV). These beat-to-beat values were re-sampled every 0.5 s via cubic-spline interpolation and were high-pass filtered to remove the constant baseline and very low frequency trends by subtracting the two-minute (241-sample) non-causal symmetric moving-average with Hanning weighting (equivalent to high-pass filtering at ~0.01 Hz). The resulting time-series data were finally clipped at ±2 standard deviations to mitigate the effects of occasional outliers. The ETCO2 data were shifted by 2 s to compensate for the latency of the measurement apparatus due to the length of the tubing, as determined experimentally. Figure 1 shows illustrative time-series data (both raw and pre-processed) for one of the AD patients over 6 min (Fig. 1a), as well as the respective spectra of the pre-processed data and the two-minute moving-averages that were subtracted during pre-processing (Fig. 1b). The broadband nature of these spontaneous physiological variations is evident, with most signal power found below ~0.1 Hz. It is also evident that strong very low frequency trends exist below 0.01 Hz, which are excluded from this study (because their power spectral density is much higher that the broadband signal of interest) and can be examined separately in future studies.
FIGURE 1.

(a) Illustrative time-series data over 6 min of AD patient #8, representing beat-to-beat spontaneous variations of MCBFV (top), MABP (middle) and ETCO2 (bottom). The raw data are on the left column and the pre-processed data are on the right column. The units of the ordinate axis are: cm/s for MCBFV and mmHg for MABP and ETCO2. (b) The spectra of the pre-processed data of AD patient #8 plotted up to 0.5 Hz (left panels) in the same order MCBFV (top), MABP (middle), ETCO2 (bottom) as in (a), and the subtracted two-minute moving averages during pre-processing (right panels).
Modeling Methods
In this study, we employ the concept of Principal Dynamic Modes (PDMs) to obtain compact dynamic nonlinear models of the causal relationship between two beat-to-beat input signals: mean arterial blood pressure (MABP) and end-tidal CO2 tension (ETCO2), and one output signal: mean cerebral blood flow velocity (MCBFV). The use of PDMs makes the obtained dynamic nonlinear models compact and allows their accurate and robust estimation from short data-records (5-6 min).27,28 The PDMs also facilitate the physiological interpretation of the obtained model.25,27–29 We briefly outline below the proposed PDM-based modeling approach, which is also summarized in Appendix I. For the many mathematical and technical details of Volterra-type modeling and related issues, the reader is referred to the monograph29 and to our recent publications presenting its application to the CHAR system in the input–output open-loop context27 and in the closed-loop context.28
In short, the output of the PDM-based input–output open-loop model is formed by additive signal components that are generated by cascaded operations on the input signals and multiplicative cross-terms (see Fig. 2). Specifically, each input signal is convolved with each of its own PDMs and transformed nonlinearly by the respective Associated Nonlinear Function (ANFs). The resulting signals are summed to form the model output with the addition of cross-terms that represent the multiplicative interactions between PDM outputs. The latter describe dynamic interactions between the PDM outputs that may influence the system output. The mathematical operations involved in this process are summarized in Appendix I, along with the procedure by which the PDMs and the ANFs are obtained from the data.
FIGURE 2.

The block-diagram of the input–output open-loop PDM-based model with three global PDMs for each input, x1: MABP and x2: ETCO2. The output uj,m(n) of the jth PDM, pj,m, for the mth input, xm, is the convolution of the PDM with the respective input: uj,m(n) = conv{pj,m,xm}. In this application, the ANFs are cubic polynomials: . The selected cross-terms, {ci,jui,1(n) uj,2(n)}, have significant correlation with the output y: MCBFV, which is the sum of all ANF output components {zj,m}, the selected significant cross-terms and a constant value c0 (taken from Ref. 28).
In the closed-loop analysis, we consider two input–output models, A and B, which represent respectively the causal effects of MABP and ETCO2, viewed as the two inputs, on MCBFV, viewed as the output (model component A) and the causal effects of MCBFV and ETCO2, viewed as the two inputs on MABP, viewed as the output (model component B). A block-diagram for the closed-loop model is shown in Fig. 3 and indicates how two open-loop PDM-based models of the subsystems A and B are connected, giving rise to two putative external (systemic) “disturbances” which are the residuals for each open-loop model prediction. The key mathematical operations and the concepts involved in the closed-loop modeling approach are summarized in Appendix II and expounded in a recent publication.28
FIGURE 3.
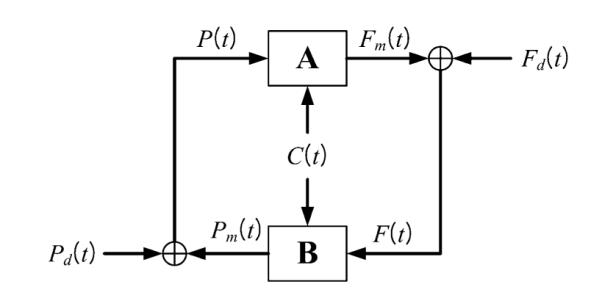
Block-diagram of the closed-loop PDM-based model, where F(t) denotes the MCBFV data, P(t) denotes the MABP data, C(t) denotes the ETCO2 data, Fm(t) denotes the MCBFV model prediction of CHAR system component A and Pm(t) denotes the MABP model prediction of CHAR system component B. The signals Fd(t) and Pd(t) are the residuals of the respective model predictions (Fm(t) for A and Pm(t) for B) and they are viewed as systemic cerebral blood flow and pressure “disturbances” driving this closed-loop physiological system (taken from Ref. 28).
The key modeling concept is that the selected PDMs represent an effcient set of “basis functions” (distinct and characteristic for each system) capable of describing adequately and compactly the system dynamics.29 Although each system/subject generally has its own characteristic set of PDMs, “global” PDMs can be sought via a proper “fusing” procedure (see Appendix I) that represent the common reference set of “basis functions” for the system kernels serving as a common “dynamic coordinate-system” for an ensemble of subjects/systems (e.g., the 16 control subjects in this study). As explained in Appendix I, the global PDMs are computed via Singular Value Decomposition (SVD) of a rectangular matrix containing all PDMs from each subject within the chosen ensemble of reference subjects, weighted by the respective singular values.28 The ability of the global PDMs to represent the dynamics of the entire ensemble is validated by the predictive accuracy of the global PDM-based model for each subject.
Three global PDMs have been found to be adequate for each input of the CHAR system.27,28 A cubic ANF for each global PDM is estimated from the data of each subject via linear regression on the output signal in accordance with the block-diagram of Fig. 2. This output regression also includes the significant cross-terms that are selected among all possible pair-products of the PDM outputs for the two inputs, using a statistical significance test (w-statistic) on the correlation coefficient between each possible cross-term and the output signal.28 We note that the coefficients of the cubic ANFs and the coefficients of the selected significant cross-terms enter linearly in the output equation (see Fig. 2). The use of global PDMs keeps the total number of free parameters for this two-input PDM-based model low (between 20 and 25 in this application, depending on the number of selected significant cross-terms which has varied between 1 and 6 in this application). Although the global PDMs are common for all subjects, the estimated ANFs associated with each global PDM are subject-specific and can be used to characterize uniquely the CHAR process for each subject. This is the basis for the potential utility of the PDM-based modeling approach for clinical diagnosis. The results of open-loop and closed-loop PDM-based modeling of the CHAR process in 8 control subjects and 8 Alzheimer’s patients are presented and compared in the following section.
RESULTS
We first computed the baseline (average) values of the MCBFV, MABP and ETCO2 time-series data for a reference set of 16 control subjects (CS), as well as the baseline resistance and reactivity estimates defined as the ratios of MABP/MCBFV and MCBFV/ETCO2 baseline values respectively. The mean (standard deviation) of these baseline values are found to be: MCBFV: 55.07 (19.03) cm/s; MABP: 95.20 (13.28) mmHg; ETCO2: 38.67 (3.33) mmHg; MABP/MCBFV: 1.88 (0.55) mmHg/cm/s; and MCBFV/ETCO2: 1.42 (0.47) cm/s/mmHg. The baseline values and the baseline-ratio estimates of resistance and reactivity for the study group of 8 CS and 8 Alzheimer’s patients (AP) are provided in Table 1 and offer modest differentiation between the CS and the AP subgroups. For comparative purposes, we have included in Table 1 the CA index values obtained from conventional linear transfer function analysis, which offer no differentiation between the CS and AP subgrourps.
TABLE 1.
Study group baseline values, baseline-ratio estimates of resistance and reactivity, and cerebral autoregulation (CA) index (in cm/s2/mmHg) computed from linear transfer function analysis
| Baseline values and baseline
resistance & reactivity estimates |
CA index Based on linear transfer function analysis |
|||||
|---|---|---|---|---|---|---|
| Baseline value of MCBFV |
Baseline value of MABP |
Baseline value of ETCO2 |
Baseline-ratio resistance |
Baseline-ratio reactivity |
||
| Control subjects | ||||||
| 1 | 80.35 | 103.11 | 38.86 | 1.28 | 2.07 | −1.05 |
| 2 | 38.33 | 92.21 | 39.96 | 2.41 | 0.96 | 0.42 |
| 3 | 34.60 | 76.33 | 35.34 | 2.21 | 0.98 | −0.10 |
| 4 | 56.74 | 79.88 | 42.84 | 1.41 | 1.32 | 0.19 |
| 5 | 50.50 | 97.29 | 32.02 | 1.93 | 1.58 | −0.62 |
| 6 | 34.42 | 102.00 | 30.85 | 2.96 | 1.12 | 0.17 |
| 7 | 83.20 | 103.04 | 40.80 | 1.24 | 2.04 | −0.32 |
| 8 | 19.64 | 86.47 | 31.47 | 4.40 | 0.62 | −0.20 |
| μ(σ) | 49.72 (22.70) | 92.54 (10.65) | 36.52 (4.70) | 2.23 (1.06) | 1.34 (0.52) | −0.19 (0.48) |
| AD Patients | ||||||
| 1 | 41.52 | 76.68 | 40.91 | 1.85 | 1.01 | −0.28 |
| 2 | 25.02 | 91.71 | 35.07 | 3.67 | 0.71 | 0.28 |
| 3 | 43.18 | 94.95 | 38.31 | 2.20 | 1.13 | −0.07 |
| 4 | 35.97 | 100.37 | 41.50 | 2.79 | 0.87 | −0.34 |
| 5 | 34.64 | 100.80 | 35.48 | 2.91 | 0.98 | −0.08 |
| 6 | 39.78 | 115.29 | 39.29 | 2.90 | 1.01 | −0.58 |
| 7 | 40.03 | 91.38 | 41.50 | 2.28 | 0.96 | 0.10 |
| 8 | 35.43 | 120.15 | 33.29 | 3.39 | 1.06 | 0.40 |
| μ(σ) | 36.95 (5.71) | 98.92 (13.85) | 38.17 (3.20) | 2.75 (0.61) | 0.97 (0.13) | −0.07 (0.33) |
We proceed with the analysis of the CHAR dynamics of these subjects using the proposed PDM-based modeling methodology. Following the procedure outlined in the previous section and Appendix I, we obtained the “global” PDMs from the reference set of 16 CS that are shown in Fig. 4 for the subsystem A and in Fig. 5 for the subsystem B (in the time and frequency domains). We observe that the global PDMs exhibit distinctive spectral characteristic in the form of resonant peaks and troughs that may attain importance for the interpretation of the PDM-based model and the functional properties of the CHAR system.27,28 The physiological origin of these resonant peaks ought to be explored in future studies, as they may be related to myogenic, endothelial and/or autonomic mechanisms (see “Discussion”). Our previous studies have shown that most of the nonlinear characteristics of the CHAR system are exhibited in the frequency range 0.02–0.08 Hz27,28,30–33 and, therefore, the nonlinearities are expected to be associated primarily with the PDMs which exhibit resonant peaks in that frequency range. The time-domain PDM waveforms indicate that the system “memory” is ~30 s (i.e., the effects of a change in the input variables upon the output variable lasts no more than 30 s).
FIGURE 4.

The three global PDMs for the MABP input (top) and for the ETCO2 input (bottom) of the dual-input subsystem A with output MCBFV. Left panels are time-domain representations. Right panels are frequency-domain representations. The units in the ordinate axis of the left panels (time-domain PDMs) are: cm/s2/mmHg.
FIGURE 5.

The three global PDMs for the MCBFV input (top) and for the ETCO2 input (bottom) of the dual-input subsystem B with output MABP. Left panels are time-domain representations. Right panels are frequency-domain representations. The units in the ordinate axis of the left panels (time-domain PDMs) are: mmHg/cm/s2 (top) and s−1 (bottom).
To obtain the PDM-based model for each subject, we must estimate the ANF of each global PDM for this subject, as well as the coeffcients of the significant cross-terms that describe the interactions of the PDM outputs as they impact the system output. Each ANF is a static nonlinear function (cubic in this case) that is applied to the output of the respective global PDM. The ANFs are distinct for each subject and can be used to quantify the CA and CVMR characteristics of the subject. To examine whether a linear PDM-based model (where the ANFs are replaced by simple scalars) would be adequate, we report in Table 2 the percent Normalized Mean-Square Error (NMSE) of the PDM-based model prediction for both the linear and the nonlinear model of each subject in the reference set of 16 CS. It is evident from these results that the nonlinear model offers significant prediction improvement, because the average NMSE reduction satisfies the Model Order Selection Criterion.29 For this reason, we proceed in our analysis with the PDM-based nonlinear models of the CHAR process. The prediction NMSE results for the subjects in the study group are also reported in Table 3.
TABLE 2.
Percent NMSEs of PDM-based linear and nonlinear model predictions for the 16 CS
| Prediction NMSE |
||||
|---|---|---|---|---|
| Linear PDM-based
model |
Nonlinear PDM-based
model |
|||
| CS # | Subsystem A | Subsystem B | Subsystem A | Subsystem B |
| 1 | 36.04 | 34.85 | 23.76 | 28.81 |
| 2 | 30.37 | 41.40 | 24.11 | 30.51 |
| 3 | 61.21 | 63.37 | 53.45 | 56.18 |
| 4 | 23.77 | 34.61 | 16.76 | 30.11 |
| 5 | 46.23 | 77.81 | 38.95 | 63.70 |
| 6 | 30.78 | 54.41 | 21.64 | 38.12 |
| 7 | 67.52 | 64.15 | 58.57 | 43.96 |
| 8 | 44.45 | 41.05 | 36.97 | 30.44 |
| 9 | 82.83 | 82.47 | 59.66 | 45.37 |
| 10 | 70.16 | 91.11 | 45.13 | 60.32 |
| 11 | 60.25 | 47.33 | 40.23 | 35.23 |
| 12 | 61.05 | 55.43 | 33.92 | 44.88 |
| 13 | 52.22 | 73.45 | 43.76 | 55.93 |
| 14 | 82.17 | 79.86 | 56.26 | 57.31 |
| 15 | 71.46 | 91.65 | 61.31 | 69.01 |
| 16 | 74.21 | 78.27 | 55.67 | 53.91 |
| μ(σ) | 55.92 (18.89) | 63.20 (19.60) | 41.88 (14.83) | 46.49 (13.29) |
TABLE 3.
Percent NMSEs of linear and nonlinear model predictions for the study group
| Prediction NMSE |
||||
|---|---|---|---|---|
| Linear PDM-based
model |
Nonlinear PDM-based
model |
|||
| Subsystem A | Subsystem B | Subsystem A | Subsystem B | |
| Control subjects | ||||
| 1 | 55.64 | 54.79 | 35.51 | 32.32 |
| 2 | 83.21 | 65.80 | 69.72 | 59.55 |
| 3 | 54.54 | 61.06 | 47.22 | 45.28 |
| 4 | 38.83 | 43.99 | 31.94 | 36.65 |
| 5 | 58.23 | 89.99 | 49.98 | 81.56 |
| 6 | 65.08 | 75.35 | 46.84 | 56.09 |
| 7 | 49.95 | 68.36 | 38.70 | 41.14 |
| 8 | 59.23 | 89.43 | 46.34 | 67.50 |
| μ(σ) | 58.09 (12.74) | 68.60 (16.03) | 45.78 (11.60) | 52.51 (16.78) |
| AD patients | ||||
| 1 | 47.70 | 63.86 | 35.19 | 52.89 |
| 2 | 73.09 | 81.18 | 64.93 | 65.84 |
| 3 | 71.87 | 77.04 | 38.16 | 59.44 |
| 4 | 41.17 | 37.48 | 25.44 | 21.00 |
| 5 | 63.83 | 47.33 | 42.24 | 35.72 |
| 6 | 67.50 | 85.54 | 41.58 | 58.73 |
| 7 | 57.48 | 52.67 | 46.61 | 41.62 |
| 8 | 63.49 | 53.73 | 51.08 | 43.12 |
| μ(σ) | 60.77 (11.36) | 62.35(17.41) | 43.16 (11.68) | 47.29 (14.78) |
The form of the obtained ANFs is illustrated for the mean coeffcient values over all 16 CS in Fig. 6 for the MABP input (left) and for the ETCO2 input (right). It should be emphasized that there is considerable inter-subject variability in the ANF coefficient estimates, especially for the 2nd and 3rd PDMs. It is evident in Fig. 6 that the ANF of the 1st PDM is almost rectilinear, especially for the MABP input and dominant over the other two ANFs (which are more curvilinear, especially for the ETCO2 input). This is consistent across subjects.
FIGURE 6.
The three average ANFs of the global PDMs for the set of 16 CS for the MABP input (left) and ETCO2 input (right). The ANFs correspond to the 1st (blue), 2nd (red) and 3rd (green) global PDM.
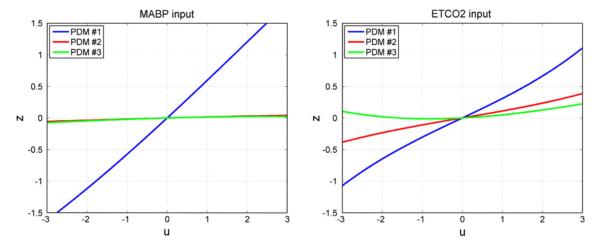
These observations are also evident in the average ANFs obtained in the study group and shown in Fig. 7. Most notable are the curvilinear form of the ANFs for the ETCO2 input and their relative variability across subjects. This is observed for both CS and AP in the study group. However, what is of greatest potential importance is the observed reduction in the slope of the 1st ANF of the ETCO2 input for the AP (relative to the CS) which suggests reduced average dynamic CO2 vasomotor reactivity. A reduction in the slope of the average 1st ANF of the AP (relative to the CS) is also observed for the MABP input, albeit not as drastic as for the ETCO2 input, suggesting some increase of the average cerebrovasular resistance (decrease of the “admittance” quantified by this slope). This issue and the observed changes in the other ANFs are further examined by the computed model-based indices for CA and CVMR below.
FIGURE 7.

The three “average” ANFs of the global PDMs for the 8 CS (top) and the 8 AP (bottom) in the study group corresponding to the MABP input (left) and ETCO2 input (right). The ANFs correspond to the 1st (blue), 2nd (red) and 3rd (green) global PDM.
The estimated coeffcients of the selected significant cross-terms varied between 1 and 6 in these subjects and had overall a minor contribution to the total output model prediction (on the order of 1–5%). We note that the number of free parameters in each of the open-loop PDM-based models with 3 PDMs for each input is 19 (including a constant). Thus, the total number of free parameters never exceeded 25 in this study. In relative terms, the greatest contribution to the total output prediction was made by the 1st ANFs of the PDM-based model.
In order to demonstrate the distinct functional characteristics captured by the PDM-based models of the AP and CS in the study group and delineate the contributions of the CA and CVMR processes, we select the most obvious choice of input: a pulse. Obviously, many other choices of index definition can be used, such as the peak response to an impulsive input or the peak-to-peak response amplitude to a sinusoidal input. Thus, we compute the model predictions of cerebral flow velocity (MCBFV) for pulse changes in arterial pressure (MABP) to quantify the CA characteristics of each subject or for pulse changes in CO2 tension (ETCO2) to quantify the CVMR characteristics of each subject, separately. It is critical to note that the model-predicted responses are computed for the other input being kept at its baseline level (simulated clamping). Each of those MCBFV simulated responses allows the computation of a CA or CVMR index. We elect to define such an index as the difference of the integrated MCBFV response over 30 s after the onset of a positive pulse and a negative pulse of the respective stimulus (MABP for CA or ETCO2 for CVMR) equal in magnitude to half SD of the respective experimental data. The latter is done in order to remain compatible with the (observed) natural operating range of each subject. The computed integrated MCBFV pulse-response over 30 s is normalized by the respective input-pulse magnitude. The computation of these indices was done for both open-loop models of subsystem A and for the closed-loop model of Fig. 3. These indices are the potential physiomarkers of CA and CVMR that are hoped to enable delineation of the AP from the CS.
The computed CA and CVMR indices for closed-loop and open-loop analysis of the reference set of 16 CS are presented in Table 4, along with the respective mean (SD) values. The respective histograms are shown in Fig. 8. When more data become available in the future, these histograms can be fitted with suitable parametric distributions that will enable statistical analysis of the obtained indices by providing the normative statistics (i.e., the Null Hypothesis that must be rejected in the disease state). An illustrative example of such a distribution fit is given in the lower right panel of Fig. 8, where the histogram of the CVMR indices for closed-loop analysis is fitted with a Gamma distribution, since the computed CVMR indices for the reference set are all positive (a fact consistent with normal physiology) and their histogram is skewed. The available data are not sufficient to allow firm conclusions on this matter at this time, but future studies may provide sufficient data and allow rigorous statistical analysis of the clinical utility of the CVMR index.
TABLE 4.
The computed model-based CA and CVMR index values for open-loop and closed-loop analysis of the reference group of 16 CS in supine position under resting conditions
| CA (cm/s/mmHg) |
CVMR (cm/s/mmHg) |
|||||
|---|---|---|---|---|---|---|
| CS | SD of MABP | Open-loop | Closed-loop | SD of ETCO2 | Open-loop | Closed-loop |
| 1 | 1.89 | 1.11 | 1.65 | 0.62 | 1.54 | 6.18 |
| 2 | 2.82 | 1.09 | 1.48 | 0.84 | 3.14 | 5.76 |
| 3 | 3.37 | 0.64 | 0.84 | 1.43 | 2.14 | 2.38 |
| 4 | 2.86 | 0.61 | 0.84 | 1.58 | 1.60 | 2.02 |
| 5 | 2.33 | 0.06 | 0.07 | 0.51 | 3.32 | 3.29 |
| 6 | 2.72 | −0.43 | −0.41 | 0.85 | 10.29 | 10.90 |
| 7 | 3.45 | 0.83 | 0.96 | 2.58 | 2.33 | 2.75 |
| 8 | 3.20 | 1.75 | 4.11 | 1.70 | 1.24 | 0.79 |
| 9 | 2.70 | 0.63 | 0.76 | 0.73 | 0.92 | 2.49 |
| 10 | 2.57 | 0.76 | 0.75 | 1.44 | 4.60 | 4.74 |
| 11 | 6.20 | 0.44 | 0.47 | 3.93 | 1.22 | 1.41 |
| 12 | 2.32 | 2.23 | 2.92 | 1.51 | 2.90 | 3.80 |
| 13 | 3.75 | −0.06 | −0.06 | 1.24 | 0.13 | 0.16 |
| 14 | 2.01 | 0.54 | 0.57 | 2.34 | 3.22 | 3.59 |
| 15 | 2.44 | 0.72 | 0.77 | 1.73 | 1.87 | 1.02 |
| 16 | 2.86 | 0.50 | 0.57 | 1.22 | 1.85 | 1.81 |
| μ (σ) | 0.71 (0.64) | 1.02 (1.12) | 2.64 (2.32) | 3.32 (2.65) | ||
FIGURE 8.

The obtained histograms of CA indices (left) and CVMR indices (right) for open-loop (top) and closed-loop (bottom) models for the reference set of 16 CS. A Gamma-distribution fit is also shown in the lower right panel (red line) for illustrative purposes (see text).
The computed CA and CVMR indices of the study group of 8 CS and 8 AP (4 pairs in supine position and 4 pairs in sitting position) are shown in Table 5 for closed-loop analysis and open-loop analysis. The SD of the respective data (MABP or ETCO2) is also reported in each case, because it defines the abscissa range of the respective ANF and the magnitude of the input-pulse (half SD) that is used in the nonlinear model simulation from which the indices are computed. Table 5 also includes the probability for the CVMR index of each subject to reject the Null Hypothesis based on the Gamma-distribution fit of Fig. 8 (rightmost column). The Gamma distribution was chosen because it is often used for variables defined only over the positive semi-axis, since the CVMR index is expected to be positive for normal subjects, but no claim of optimality is made for the Gamma distribution since other such distributions can also be used and may prove more suitable for this application following proper statistical analysis of more extensive data in the future.
TABLE 5.
The computed model-based CA and CVMR index values for closed-loop analysis (top two panels) and open-loop analysis (bottom two panels) of the study group of 8 CS and 8 AP. The “Prob” column is the probability of rejecting the Null Hypothesis based on the normative Gamma-distribution of the CVMR index for the reference set of 16 control subjects (i.e., the likelihood of CVMR impairment)
| Closed-loop analysis (controls) | |||||
|---|---|---|---|---|---|
|
| |||||
| CS # | SD of MABP | CA index | SD of ETCO2 | CVMR index | Prob |
| 1 | 3.32 | 1.09 | 2.03 | 3.37 | 0.39 |
| 2 | 2.47 | −0.03 | 0.96 | 1.49 | 0.73 |
| 3 | 2.46 | 0.54 | 0.81 | 2.12 | 0.60 |
| 4 | 3.36 | 0.35 | 0.78 | 5.42 | 0.18 |
| 5 | 2.47 | −0.01 | 0.47 | 4.41 | 0.26 |
| 6 | 5.70 | 0.10 | 1.42 | 1.96 | 0.63 |
| 7 | 3.52 | 1.98 | 1.03 | 8.48 | 0.05 |
| 8 | 3.70 | −0.28 | 1.48 | 1.92 | 0.64 |
| μ(σ) | 0.47 (0.74) | 3.65 (2.39) | 0.43 (0.25) | ||
|
| |||||
| Closed-loop analysis (patients) | |||||
|
| |||||
| AP # | SD of MABP | CFA index | SD of ETCO2 | CVMR index | Prob |
|
| |||||
| 1 | 9.24 | 0.44 | 4.21 | 0.23 | 0.98 |
| 2 | 2.72 | 0.04 | 1.30 | 1.28 | 0.78 |
| 3 | 3.30 | 0.12 | 1.35 | 1.87 | 0.65 |
| 4 | 4.69 | 0.63 | 1.06 | 1.57 | 0.71 |
| 5 | 3.38 | 0.30 | 4.02 | −0.39 | 1.00 |
| 6 | 3.71 | −0.47 | 1.75 | 0.27 | 0.98 |
| 7 | 2.86 | 0.87 | 0.96 | 0.50 | 0.94 |
| 8 | 4.73 | 0.41 | 1.60 | 1.71 | 0.68 |
| μ(σ) | 0.29 (0.40) | 0.88 (0.83) | 0.84 (0.15) | ||
|
| |||||
| Open-loop analysis (controls) | |||||
|
| |||||
| CS # | SD of MABP | CA index | SD of ETCO2 | CVMR index | Prob |
|
| |||||
| 1 | 3.32 | 0.88 | 2.03 | 3.01 | 0.44 |
| 2 | 2.47 | −0.03 | 0.96 | 1.48 | 0.73 |
| 3 | 2.46 | 0.41 | 0.81 | 1.42 | 0.75 |
| 4 | 3.36 | 0.30 | 0.78 | 4.63 | 0.24 |
| 5 | 2.47 | −0.02 | 0.47 | 4.42 | 0.26 |
| 6 | 5.70 | 0.10 | 1.42 | 1.86 | 0.65 |
| 7 | 3.52 | 1.29 | 1.03 | 4.54 | 0.25 |
| 8 | 3.70 | −0.29 | 1.48 | 2.04 | 0.62 |
| μ(σ) | 0.33 (0.52) | 2.93 (1.42) | 0.49 (0.22) | ||
|
| |||||
| Open-loop analysis (patients) | |||||
|
| |||||
| AP # | SD of MABP | CA index | SD of ETCO2 | CVMR index | Prob |
|
| |||||
| 1 | 9.24 | 0.34 | 4.21 | 0.12 | 0.99 |
| 2 | 2.72 | 0.03 | 1.30 | 1.28 | 0.78 |
| 3 | 3.30 | 0.09 | 1.35 | 1.69 | 0.69 |
| 4 | 4.69 | 0.45 | 1.06 | 2.77 | 0.48 |
| 5 | 3.38 | 0.20 | 4.02 | −0.35 | 1.00 |
| 6 | 3.71 | −0.52 | 1.75 | 0.55 | 0.93 |
| 7 | 2.86 | 0.59 | 0.96 | 0.22 | 0.98 |
| 8 | 4.73 | 0.25 | 1.60 | 0.93 | 0.85 |
| μ(σ) | 0.18 (0.34) | 0.90 (0.10) | 0.84 (0.18) | ||
The results indicate a significant reduction of the CVMR index in the AP subgroup (by a factor of about 4 on the average) and a smaller reduction of the CA index in the AP subgroup (by about 50% on the average) relative to the CS subgroup in the study group. These differences between the two subgroups are far more pronounced than the differences shown in Table 1 that were based on baseline values—suggesting the potential capability of these model-based “dynamic” indices to delineate the two groups better than “static” measures based on the ratio of baseline values (see Discussion). A significant reduction of the average CVMR index was observed for the AP in sitting position relative to supine position—but this was not observed for the CS group. We note that the average probability of rejecting the Null Hypothesis based on the normative Gamma-distribution of the reference set of 16 CS is about double for the AP group relative to the CS group (for closed-loop analysis). This probability is above 65% for all patients in the closed-loop analysis, but one patient is below 65% in the open-loop analysis. One member of the CS group has such probability above 65% for closed-loop analysis, but three members of the CS group have such probability above 65% for open-loop analysis (see “Discussion”).
An illustrative example of the simulated MCBFV responses to the MABP pulse stimulus is given in Fig. 9 for CS #1 (left panels) and AP#1 (right panels), where the MABP stimulus has a positive pulse change (equal to half SD of the actual MABP input data) over the first 30 s (the “memory” of the CHAR system) and a negative pulse change of the same magnitude over 80–110 s, while the ETCO2 input is kept at baseline (ETCO2 average over the data-record). The top panels are for the closed-loop analysis and the bottom panels for open-loop analysis (subsystem A). In the closed-loop model, the MABP stimulus is externally imposed (like the systemic disturbance Pd(t) in Fig. 3) and, therefore, an intra-loop MABP change is induced, which is also plotted in the top panels (in green). These model predictions indicate that both subjects exhibit normal autoregulation with respect to pressure changes, since the MCBFV response returns close to the baseline after an initial transient.
FIGURE 9.

The model-predicted MCBFV response (blue line), denoted as y in the open-loop model of Fig. 2 and Fm in the closed-loop model of Fig. 3, for CS#1 (left panels) and AP#1 (right panels) to positive and negative MABP 30-s pulse stimuli (red line) of magnitude equal to half SD of the MABP data, while the ETCO2 input is kept at baseline (isocapnic conditions). Top panels: closed-loop analysis; bottom panels: open-loop analysis. In the closed-loop model (top panels), an intra-loop MABP change P (green line) is induced by the externally imposed MABP pulse Pd (red line). In the open-loop model, the imposed MABP pulse is denoted as x1 in Fig. 2. The model predictions in both subjects demonstrate normal autoregulation (CA), since the MCBFV response returns close to baseline after an initial transient.
An illustrative example of the simulated MCBFV responses to an ETCO2 pulse stimulus is given in Fig. 10 for CS #1 (left panels) and AP#1 (right panels), where the ETCO2 stimulus is a positive pulse change (equal to half SD of the actual ETCO2 data) over the first 30 s and a negative pulse change of the same magnitude over the interval of 80–110 s, while the MABP input is kept at baseline (isobaric conditions). The top panels are for the closed-loop model and the bottom panels for the open-loop model of subsystem A in Fig. 3. In the closed-loop model, an intra-loop MABP change is induced by the ETCO2 stimulus (green liine in the top panels). These model predictions indicate that the control subject CS#1 exhibits normal vasomotor reactivity with respect to CO2 changes, because the resulting MCBFV response increases or decreases depending on whether the ETCO2 stimulus increases or decreases, respectively. However, this is not the case for the patient AP#1, indicating impairment of CO2 vasomotor reactivity. This is the key finding of our study (see “Discussion”).
FIGURE 10.

The model-predicted MCBFV response (blue line) for CS#1 (left panels) and AP#1 (right panels) to a positive ETCO2 pulse stimulus over the time-interval 0–30 s (red line), equal to half SD of the recorded ETCO2 data, or a negative ETCO2 pulse stimulus of the same magnitude over the time-interval 80–110 s, while the MABP input is kept at baseline (isobaric conditions). The top panels are for the closed-loop model and the bottom panels for the open-loop model. In the closed-loop model, the ETCO2 pulse stimulus also induces an intra-loop MABP change which is plotted in green. The model prediction in the control subject CS#1 demonstrates normal CO2 vasomotor reactivity, since the MCBFV response changes in the same direction as the ETCO2 input. However, this is not the case for Alzheimer’s patient AP#1, indicating impairment of CO2 vasomotor reactivity.
DISCUSSION AND CONCLUSIONS
It has been shown in previous studies that the progression of cognitive impairment in patients with Alzheimer disease (AD) is associated with impairment of cerebral vasomotor reactivity (CVMR) to hypercapnia.43,44 It is also increasingly recognized that in most conditions of dementia, neurodegenerative changes and vascular lesions interact to accelerate cognitive decline.2,4,10,14,17–19,34,35,47 In addition to epidemiological evidence that AD and vascular dementia have common risk factors,13 there have been indications that cerebral amyloid angiopathy may be both the cause and the effect of cerebrovascular impairment, suggesting that AD and cerebrovascular disease have synergistic effects.7,16,22,41,42,45,46 The identification of common biochemical and physiological mechanisms for the pathogenesis of AD and cerebrovascular disease could have significant clinical implications in terms of diagnosis, prevention and treatment. The prevention and mitigation of cerebrovascular dysfunction through proper intervention and treatment may also have important implications for improved management of AD.15,21,50 This attractive prospect relies on our practical ability to obtain reliable, sensitive, quantitative and objective measures of cerebral vascular dysfunction in a clinical setting. This paper proposes a method that yields such a measure under resting conditions using non-invasive measurements of cerebral flow, arterial pressure and end-tidal CO2.
The proposed method utilizes a nonlinear model of the dynamics of cerebral hemodynamic autoregulation (CHAR) that includes the processes of cerebral flow autoregulation to pressure-changes (CA) and CO2 vasomotor reactivity (CVMR). This model is estimated from beat-to-beat time-series data of Mean Arterial Blood Pressure (MABP), End-Tidal CO2 (ETCO2) and Mean Cerebral Blood Flow Velocity (MCBFV) that are collected in elderly patients non-invasively and reliably in a clinical setting under resting conditions (supine or sitting position).
The proposed dual-input dynamic nonlinear model utilizes the concept of Principal Dynamic Modes (PDMs) to facilitate the model estimation task. In addition to its potential for enabling diagnosis of early-stage AD, this model can also advance our quantitative understanding of the CA and CVMR processes. The primary intent of this work is to develop and test simple, yet reliable, model-based indices that can serve as “physiomarkers” with potential clinical utility in improving diagnosis of AD in early stages—and possibly other neurodegenerative diseases with a cerebrovascular component. We have shown that PDM-based models yield quantitative measures of CVMR and CA in the form of scalar indices that quantify these processes and exhibit marked differences between Alzheimer’s patients (AP) and control subjects (CS). Therefore, these model-based indices/physiomarkers hold the promise to be used in order to detect possible impairment of CVMR or CA in AD or other forms of cerebrovascular disease.
It was found through data analysis from an initial set of 8 AP and 8 CS that the CVMR index takes significantly higher values for CS than AP (by a factor of 4 on the average) and likewise, but to a smaller extent, the CA index (by a factor of 2 on the average). Our working hypothesis is that amyloid-beta deposition interferes with the normal function of the neurovascular autoregulatory mechanisms that serve CVMR and CA and, furthermore, these effects can be quantified reliably with the use of data-based dual-input dynamic nonlinear models employing the key modeling concept/tool of PDMs and their Associated Nonlinear Functions (ANFs). These models account for the combined and nonlinear effects of MABP and ETCO2 on MCBFV. Simulations of the extracted PDM-based models can generate the MCBFV response to positive or negative input-pulse change of ETCO2 or MABP separately (while the other input is kept at baseline—emulating isobaric or isocapnic conditions respectively). This capability of “simulated clamping” is a unique strength of model-based studies. The proposed “physiomarkers” for early AD take the form of indices that are computed as the difference of the integrated MCBFV responses to a positive and negative pulse stimulus of the respective input (ETCO2 for CVMR and MABP for CA) equal to half SD of the respective recorded data. These responses are time-averaged over 30 s (the putative “memory” of this system) and normalized by the respective input-pulse magnitude. The obtained indices seem to corroborate our working hypothesis that they may serve as “physiomarkers” to quantify possible deficits or impairment in the CA and CVMR processes. Specifically, a significant reduction of the CVMR index was observed in the AP of the study group (by a factor of 4 on the average), relative to the normative database and the CS of the study group (see Table 5). Analysis of more extensive clinical data should seek to confirm this intriguing finding in the future, because of its potential to quantify possible CVMR impairment in early AD.
We note that the obtained nonlinear dual-input PDM-based models were validated through their predictive capability and are deemed capable of predicting the MCBFV response for any given changes of MABP and ETCO2 within the dynamic range of the analyzed data, which are obtained under resting conditions. Therefore, the obtained model-based physiomarkers are valid for the dynamic range of spontaneous activity under resting conditions and do not necessarily correspond to physiological measures that are obtained under more severe challenges (e.g., hypercapnia induced by CO2 breathing). We also note that the employed system memory of 30 s may be a bit shorter for the MABP input, since this was found in the data of a previous modeling study.27 In the Laguerre expansion approach, the system memory for each input is influenced by the selected Laguerre parameter alpha, which is determined through a search procedure minimizing the NMSE of the model prediction for a given number L of Laguerre basis functions. For the data of this study, the search procedure yielded an optimum alpha of 0.7 with L = 5 for the MABP input and L = 3 for the ETCO2 input, which resulted in a memory extent for both inputs of about 30 s. However, the significant values of the 1st order kernel for the MABP input are within the first 10 s—with relatively small values for lags between 10 and 30 s. A previous study of our group 27 found an optimal alpha parameter of 0.5 for the MABP input and 0.6 for the ETCO2 input. This is probably due to differences in the respective subject data. Experimental verification of the precise system memory is desirable, but practically difficult because of the relatively small values of the MABP kernels beyond lags of 10 s and the relatively low signal-to-noise ratio in this type of data due to the multiple factors affecting them. This issue deserves to be explored further in the future.
Despite the considerable inter-subject variability in the CHAR process, three “global” PDMs for each of the monitored variables were found to constitute an adequate “functional basis” for representing the dynamics of the CHAR process for all subjects in the study (adequacy was judged by the predictive capability of the resulting PDM-based models). This common reference of global PDMs was obtained from the time-series data of 16 control subjects, distinct from the ones analyzed in this study. The existence of such a set of global PDMs facilitates this formidable modeling task in a practical context and assists the physiological interpretation of the modeling results. The form of the global PDMs contains functional information regarding the physiological mechanisms defining the dynamics of the CHAR process. However, the specific and reliable interpretation of these global PDMs and their ANFs (which describe quantitatively the nonlinearities of the CHAR process for each subject) will require intensive future studies on a vastly expanded database. The main findings of this study (based on the limited number of subjects to date) are summarized below.
Dual-Input Dynamic Nonlinear Modeling Seems Useful for Quantification of the CHAR Process
It is known that the CHAR process is dynamic and nonlinear. However, the practical extraction of a reliable CHAR model, accounting for the combined and nonlinear effects of blood pressure and CO2 tension on cerebral blood flow velocity, from clinical data has been viewed as nearly intractable and its potential clinical utility has remained a matter of speculation. The results of this study suggest that it is practically feasible and potentially useful to take into account the dynamic nonlinearities of this dual-input system in order to achieve quantification of possible impairment of CVMR and/or CA that may serve the purpose of improved clinical diagnosis. Specifically, it was shown that dual-input dynamic nonlinear models reduce significantly the output prediction error relative to linear models (see Tables 2 and 3). The significance of this reduction is ascertained to be beyond the bounds of statistical variance (or overfitting) by the Model Order Selection Criterion that has been developed for this purpose.29 Nonetheless, it should be noted that the estimation of more complex models (with more free parameters) is generally more prone to estimation errors than simpler (more compact) models. The model-based indices in Table 5 that quantify the CVMR process under isobaric and resting conditions, allow the delineation of AP from CS (one-sided p value of 0.004 for closed-loop analysis). Indications of CVMR impairment were found in the AP of this study in the form of reduced values of the respective index. Such delineation between the two groups (CS and AP) was not possible with baseline values (averages of the available data), as attested by the computed values shown in Table 1 that correspond to large p-values of the mean difference t test (reported explicitly in #5 below). Such delineation was not possible via the obtained CA indices (see Table 5) or single-input (MABP) models of the CHAR process that have been used in the linear context previously (e.g., transfer function analysis). We observe, however, a small reduction of the average CA index in the AD patients relative to the control subjects (see Table 5), which is not statistically significant (one-sided p value of 0.27 for closed-loop analysis). The observed nonlinearities were relatively mild for the pressure-dependent components of the model (serving pressure autoregulation), but they were stronger for the CO2-dependent components of the model (serving vasomotor reactivity).
The PDM-Based Model May be Generally Applicable to All Subjects and Pathologies
The “global” PDMs used in the presented methodology represent a “functional basis” for all subjects that is posited to be generally applicable across subjects and pathologies pertinent to cerebral hemodynamics. The validation of this assertion is based on the predictive capability of the resulting models. However, this has been shown only on a limited set of subjects so far (32 in this study) and its potential importance requires validation with a larger number of subjects in the future. When this assertion is demonstrated to the satisfaction of the peer community, it will be extremely useful for the dual purpose of physiological interpretation and clinical application. The physiological interpretation of the global PDMs and the specific physiological mechanisms that influence their waveforms require also careful examination in future studies. The subject-specific forms of the ANFs are useful for diagnostic purposes, but their origin remains an issue that also deserves more attention in future studies. The observed spectral characteristics of the obtained global PDMs suggest the presence of multiple mechanisms that must be delineated in future studies.
Model-Based Indices of CVMR and CA with Potential Clinical Utility
The PDM-based model of the CHAR process has the potential to yield clinically useful indices of CVMR and CA for improved diagnosis of early AD and other neurodegenerative diseases with a significant cerebrovascular component. Based on these initial results, the CVMR index appears to delineate the AP from the CS better than the CA index. Although this result appears very promising, the CVMR index must uphold its good performance with a broader set of subjects in future studies, before it can be accepted as quantitative and reliable means for early AD diagnosis. A CVMR index was previously proposed that was based on breath-holding data.23,39 However, this index exhibited high variability and yielded ambiguous results due to baseline variations among subjects. The PDM-based dual-input model allows computation of the CVMR index under isobaric conditions (simulated clamping) using spontaneous activity data in resting conditions, without requiring specialized maneuvers that may drive the CHAR system outside its physiological range. This renders it more stable and robust as a diagnostic physiomarker.
The key question of possible diagnostic value of the proposed CVMR and CA indices can be elucidated by the scatter-plot of Fig. 11, where the computed indices for the 8 CS and 8 AP of the study group are plotted with blue and red respectively, for both closed-loop and open-loop analysis. The closed-loop analysis appears to separate the two subgroups better (left panel). A dividing line emerges for the CVMR index values around 1.9, since all AP have CVMR index values below 1.9, and all CS but one are above that value. A second dividing line around 1.4 leaves all CS above it, along with three AP. Thus, a “gray zone” emerges from these initial results for CVMR indices between ~1.4 and ~1.9. These findings are consistent with the log-normal fit for the closed-loop CVMR indices shown in Fig. 8 (the probabilities of rejecting the Null Hypothesis of the normative data are included in Table 5). Evaluating these findings against the results of the reference group presented in Table 4 (closed-loop analysis), we see that two CS in the reference group have CVMR index in the “gray zone” between 1.4 and 1.9, but three more are below 1.4. It is critical to examine in future studies whether the latter cases are in actuality “false negatives” or they extend the “gray zone” to lower CVMR index values. The results in Fig. 11 are more ambiguous for open-loop analysis, although the CVMR indices for open-loop analysis reported in Table 5 also delineate the two groups. Rigorous statistical analysis of the diagnostic value of the CVMR and CA indices can be performed when more CS and AP data become available in future studies. Nonetheless, the initial results already indicate that the CVMR index has potential diagnostic utility in the closed-loop analysis context—something that cannot be ascertained for the CA index. A CVMR index less than ~2 (regardless of the CA index value) represents a warning sign for early AD, based on these initial data, while the range of CVMR index values between roughly 1 and 2 represents a “gray zone”.
FIGURE 11.
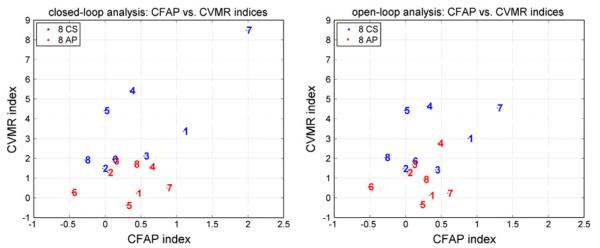
Scatter-plots of the computed CVMR and CA indices for the 8 CS (blue) and 8 AP (red) of the study group using closed-loop analysis (left) and open-loop analysis (right). The closed-loop analysis appears to delineate the subgroups better (see text).
Closed-Loop Analysis Appears to be Yield Better Initial Results than Open-Loop Analysis
The obtained initial results suggest that closed-loop analysis offers better delineation between the CS and AP groups than open-loop analysis (see Fig. 11). Of course, this initial finding must be examined with more extensive data in the future. The key notion being advanced by the closed-loop modeling approach is the “mutual interdependence” of blood pressure and flow velocity in an artery. Among the physiological mechanisms that mediate flow-dependent changes of vascular impedance, the best documented is the flow-dependent vasodilation process which is mediated by endothelial Nitric Oxide production from the shear-flow sensitive amino acid l-arginine and the subsequent relaxation of the perivascular smooth muscle via increased intracellular cGMP. Consistent with these biological processes, the analysis of the time-series data shows that the predictive ability of extracted models is comparable for pressure-to-flow and flow-to-pressure causal relations. We also note that the spatio-temporal arterial pressure and flow changes are fundamentally interconnected via the Navier–Stokes equation, constrained by the (complicated) boundary conditions imposed by the variable cerebrovascular characteristics of each subject, which include autoregulatory mechanisms. These collectively generate the postulated “systemic disturbances” in the closed-loop diagram of Fig. 3.
This point is further corroborated by the initial statistical analysis based on the normative Gamma-distribution fit of the CVMR histogram (for closed-loop analysis) shown in Fig. 8. The average probability of rejecting the Null Hypothesis based on the normative Gamma-distribution of the reference set of 16 CS is about double for the AP group relative to the CS group for closed-loop analysis (see Table 5). This probability is above 65% for all patients in the closed-loop analysis, but one patient is below 65% in the open-loop analysis. One member of the CS group has such probability above 65% for closed-loop analysis, but three members of the CS group have such probability above 65% for open-loop analysis. Thus, based on these initial results, it appears that closed-loop analysis has better sensitivity and specificity than open-loop analysis. Obviously, this finding must be tested in the future by an extended database.
Dynamic Analysis Appears to be Yield Better Initial Results than Baseline (Static) Analysis
The initial results suggest that dynamic analysis using input–output models of CHAR offers better delineation between the CS and AP groups than static analysis based on baseline values (compare the values in Table 1 with Table 5). In Table 1, the averages of baseline values of the three variables are different for the CS and AP groups; however these differences are small relative to the standard deviations of the two groups and, therefore, do not rise to a high level of statistical significance (one-sided p values of: 0.08 for MCBFV, 0.16 for MABP, 0.21 for ETCO2). This is also evidenced by the fact that the ranges of the individual baseline values for the CS and AP are largely overlapping. However, the static reactivity estimate in Table 1, obtained as the ratio of the average (baseline) MCBFV value to the average ETCO2 value, yields distributions for the CS and AP subgroups with mean values of 1.34 and 0.97 cm/s/mmHg respectively (i.e., 28% smaller for the AP) which corresponds to one-sided p value of 0.036, while the CVMR index (which is a dynamic reactivity estimate) yields distributions for the CS and AP subgroups with mean values of 3.69 and 0.87 cm/s/mmHg respectively for closed-loop analysis (i.e., 76% smaller for the AP) which corresponds to one-sided p value of 0.004 (similar p-value is obtained for open-loop analysis). Thus, the model-based dynamic reactivity estimate (i.e., the CVMR index) separates the two subgroups better. In order to examine whether the static and the dynamic reactivity estimates are correlated, we show in Fig. 12 the respective scatter-plots (with the regression lines) for closed-loop and open-loop analysis. The r2-value is higher for the closed-loop analysis (0.55 vs. 0.41) and so is the slope. We interpret this result as suggesting that closed-loop analysis is more appropriate than open-loop analysis (higher r2 value) and that the dynamic reactivity index delineates better than the static reactivity index the CS from AP.
FIGURE 12.
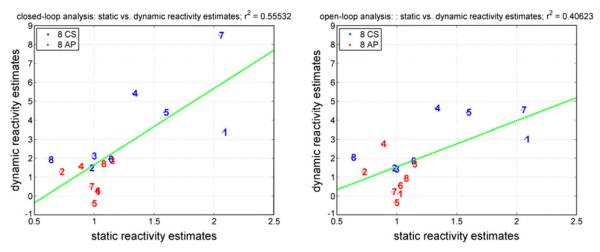
Scatter-plots of the static and dynamic reactivity estimates for the 8 CS (blue) and 8 AP (red) of the study group using closed-loop analysis (left) and open-loop analysis (right).
In closing, we emphasize that, although the presented initial results are rather promising, the proposed approach must be tested with a larger population of AD patients and control subjects before it can be accepted for potential clinical use. Of particular importance for clinical diagnosis of early AD is the question of specificity that allows delineation from other cerebrovascular or neurodegenerative diseases. This will require extending our future studies to volunteers with other pathologies that may benefit from a reliable CVMR and/or CA index. This will examine the specificity of the proposed indices for AD diagnosis. It is finally important to explore whether the numerical values of the CVMR and CA indices can offer quantitative measures of the stage of the disease in order to be useful in optimizing the therapeutic strategies and monitoring the effects of treatment over time.
ACKNOWLEDGMENTS
This work was supported in part by the Biomedical Simulations Resource at the University of Southern California under NIH/NIBIB grant P41-EB001978 and NIA R01AG033106-01 grant to the UT-Southwestern Medical Center.
APPENDIX I. BASICS OF VOLTERRA AND OPEN-LOOP PDM-BASED MODELING
The general nonparametric Volterra model is applicable to all finite-memory dynamic nonlinear systems, which covers almost all physiological systems (with the exception of chaotic systems or non-dissipating oscillators).26,29 In the proposed methodology, the modeling task commences with the estimation of a second order Volterra model of the two-input CHAR system using Laguerre expansions of the kernels24:
| (A1) |
where p(t) denotes the MABP input, x(t) denotes the ETCO2 input, y(t) denotes the mean cerebral blood flow velocity (MCBFV) output and ε(t) denotes possible measurement or modeling errors. The dynamic characteristics of this system/model are described by the kernels: kp, kx, kpp, kxx, kpx, which are estimated using given input–output data: p(t), x(t), and y(t), by means of Laguerre expansions and least-squares fitting as described below. Consider, for instance, the Laguerre expansion of the rth order kernels corresponding to two inputs:
| (A2) |
where {bj(s)} denotes the orthogonal Laguerre function basis. Then, we have the following input–output relation which involves linearly the Laguerre expansion coefficients {ar} and {cr}:
| (A3) |
where the signals vj(t) and zj(t) are the convolutions of the Laguerre basis function bj with the respective input. Note that in the model equation (A3) the cross-kernel contribution has been suppressed in the interest of simplifying the model expression. The cross-kernel effects are accounted by expansion terms involving products of the signals vj(t) and zj(t). The fact that the Laguerre expansion coefficients enter linearly in the nonlinear input–output model of Eq. (A3) allows their estimation via least-squares fitting (a simple and robust numerical procedure). Following estimation of the Laguerre expansion coefficients, we can construct the Volterra kernel estimates using Eq. (A2) and compute the model prediction for any given input using Eq. (A1) or (A3).
Although the Laguerre expansion technique brings considerable model estimation effciencies, it does not remove the “curse of dimensionality” associated with the multi-dimensional structure of high-order kernels. In order to overcome this practical limitation, we have introduced the concept of Principal Dynamic Modes (PDM), which aims at identifying an effcient “basis” of functions (distinct and characteristic for each system) that are capable of representing adequately the system dynamics (i.e., provide satisfactory expansions of the kernels). The computation of the PDMs for each input is based on Singular Value Decomposition (SVD) of a rectangular matrix composed of the first order kernel estimate (as a column vector) and the second order self-kernel estimate (as a block matrix) weighted by the standard deviation of the respective input.
The resulting PDMs form a filter-bank that receives the respective input signal and generates (via convolution) signals that are subsequently transformed by the “Associated Nonlinear Function” (ANFs), which represents the nonlinear characteristics of the system for the respective PDM dynamics, to form additively the system output, as depicted schematically in Fig. 2. Thus, the PDM-based model separates the dynamics (PDMs) from the nonlinearities (ANFs). Since the “separability” of the system nonlinearity cannot be generally assumed, we include “cross-terms” in the PDM-based model that are properly selected on the basis of a statistical significance test on the computed correlation coefficient between each cross-term (i.e., the pair product of PDM outputs) and the output signal, using the w-statistic.26 Three PDMs for each input and up to 6 cross-terms were found to be adequate in this application.
The structure of the PDM-based model of the two-input/one-output CA-CVMR system is shown in Fig. 2. The employed “global” PDMs represent a common “functional basis” for efficient representation of all kernels of the CHAR system for all subjects. These “global” PDMs are obtained via SVD of a rectangular matrix containing the PDMs of all subjects in a selected reference group (16 control subjects in this case). Although the global PDMs are common for all subjects, the estimated ANF for each global PDM and the coefficients of the cross-terms are subject-specific and can be used to characterize uniquely the CHAR process for each subject. The use of PDMs allows us to write the output Eq. (A3) as:
| (A4) |
where {uh} and {wm} are the PDM outputs (i.e., convolutions of the input with the respective PDM) for the MABP and ETCO2 inputs, respectively, and {fh} and {fm} are the ANFs associated with each PDM. The ANFs are typically polynomials (cubic in this application). The “Cross-Terms” in Eq. (A4) are pair products of {uh} and {wm} that have significant correlation with the output. The coefficients of the selected Cross-Terms are estimated, along with c0 and the coefficients of the (cubic) ANFs via least-squares regression of Eq. (A4).
APPENDIX II. CLOSED-LOOP PDM-BASED MODELING
The closed-loop analysis requires the estimation of two open-loop PDM-based models A and B, following the approach described in Appendix I, which are placed in the configuration of Fig. 3. The disturbance signals Fd (t) and Pd (t) are computed in each case as the model-prediction residuals and they are viewed as the physiological “disturbances” or “drives” of the closed-loop system. In accordance with Fig. 3, we have two equivalent closed-loop equations:
| (A5) |
| (A6) |
which are nonlinear stochastic integral equations, since we have for each open-loop model:
| (A7) |
| (A8) |
where the signals u(t) are convolution integrals of the input signals with the PDMs, the functions f [·] are polynomials (cubic in this case), and F0, P0 are the baseline values of MABP and MCBFV respectively (i.e., their values when there are no systemic disturbances). In the case of discretized data, Eqs. (A5) and (A6) are tantamount to nonlinear auto-regressive equations in F(t) or P(t) with stochastic coefficients and an exogenous variable C(t). Simulations with broadband (e.g., band-limited white-noise) systemic disturbances can reveal the spectral characteristics of the closed-loop model for various power levels under isocapnic (C(t) = 0), hypercapnic (C(t) > 0) or hypocapnic (C(t) < 0) conditions.
It is instructive to examine the particular case where the operators A and B are linear, i.e., described by Transfer Functions in the frequency domain. Then, Eq. (A5) yields the following relation in the Laplace domain (i.e., the variables are described by their Laplace Transforms):
| (A9) |
where HXY denotes the Transfer Function from input X to output Y. Thus, the dynamics and stability of the closed-loop model are determined by the poles (i.e., the roots) of the expression: (1 − HPFHFP), i.e., the product HPF HFP in the complex Laplace domain must remain away from 1 in order to maintain stability. The resonances of the closed-loop system are defined by the troughs of the function ∣1 − HPF HFP∣ expressed in the Fourier domain.
REFERENCES
- 1.Aaslid R, Lindegaard KF, Sorteberg W, Nornes H. Cerebral autoregulation dynamics in humans. Stroke. 1989;20:45–52. doi: 10.1161/01.str.20.1.45. [DOI] [PubMed] [Google Scholar]
- 2.Bell RD, Zlokovic BV. Neurovascular mechanisms and blood-brain barrier disorder in Alzheimer’s disease. Acta Neuropathol. 2009;118(1):103–113. doi: 10.1007/s00401-009-0522-3. [DOI] [PMC free article] [PubMed] [Google Scholar]
- 3.Bellapart J, Fraser JF. Transcranial Doppler assessment of cerebral autoregulation. Ultrasound Med. Biol. 2009 doi: 10.1016/j.ultrasmedbio.2009.01.005. doi:10.1016/j.ultrasmedbio. [DOI] [PubMed] [Google Scholar]
- 4.Bowler JV. Acetylcholinesterase inhibitors for vascular dementia and Alzheimer’s disease combined with cerebrovascular disease. Stroke. 2003;34:584–586. doi: 10.1161/01.str.0000052629.64999.cc. [DOI] [PubMed] [Google Scholar]
- 5.Claassen JA, Diaz-Arrastia R, Martin-Cook K, Levine BD, Zhang R. Altered cerebral hemodynamics in early Alzheimer disease: a pilot study using transcranial Doppler. J. Alzheimers Dis. 2009;17(3):621–629. doi: 10.3233/JAD-2009-1079. [DOI] [PMC free article] [PubMed] [Google Scholar]
- 6.Claassen JA, Zhang R. Cerebral autoregulation in Alzheimer’s disease. J. Cereb. Blood Flow Metab. 2011;31(7):1572–1577. doi: 10.1038/jcbfm.2011.69. [DOI] [PMC free article] [PubMed] [Google Scholar]
- 7.Cupini LM, Diomedi M, Placidi F, Silvestrini M, Giacomini P. Cerebrovascular reactivity and subcortical infarctions. Arch. Neurol. 2001;58:577–581. doi: 10.1001/archneur.58.4.577. [DOI] [PubMed] [Google Scholar]
- 8.Czosnyka M, Brady K, Reinhard M, Smielewski P, Steiner L. Monitoring of cerebrovascular autoregulation: facts, myths and missing links. Neurocrit. Care. 2009;10:373–386. doi: 10.1007/s12028-008-9175-7. [DOI] [PubMed] [Google Scholar]
- 9.Czosnyka M, Piechnik S, Richards H, Kirkpatrick P, Smielewski P, Pickard J. Contribution of mathematical modeling to the interpretation of bedside tests of cerebrovascular autoregulation. J. Neurol. Neurosurg. Psychiatry. 1997;63:721–731. doi: 10.1136/jnnp.63.6.721. [DOI] [PMC free article] [PubMed] [Google Scholar]
- 10.de la Torre JC. Alzheimer disease as a vascular disorder. Nosological evidence. Stroke. 2002;33:1152–1162. doi: 10.1161/01.str.0000014421.15948.67. [DOI] [PubMed] [Google Scholar]
- 11.Giller CA. The frequency-dependent behavior of cerebral autoregulation. Neurosurgery. 1990;27:362–368. doi: 10.1097/00006123-199009000-00004. [DOI] [PubMed] [Google Scholar]
- 12.Giller CA, Mueller M. Linearity and nonlinearity in cerebral hemodynamics. Med. Eng. Phys. 2003;25:633–646. doi: 10.1016/s1350-4533(03)00028-6. [DOI] [PubMed] [Google Scholar]
- 13.Gorelick PB. Risk factors for vascular dementia and Alzheimer disease. Stroke. 2004;35:2620–2622. doi: 10.1161/01.STR.0000143318.70292.47. [DOI] [PubMed] [Google Scholar]
- 14.Hachinski V, Iadecola C. Vascular cognitive impairment: introduction. Stroke. 2004;35:2615. doi: 10.1161/STROKEAHA.110.595488. [DOI] [PMC free article] [PubMed] [Google Scholar]
- 15.Hanon O, Seux ML, Lenoir H, Rigaud AS, Forette F. Prevention of dementia and cerebroprotection with antihypertensive drugs. Curr. Hypertens. Rep. 2004;6:201–207. doi: 10.1007/s11906-004-0070-0. [DOI] [PubMed] [Google Scholar]
- 16.Hardy J. The amyloid hypothesis for Alzheimer’s disease: a critical reappraisal. J. Neurochem. 2009;110:1129–1134. doi: 10.1111/j.1471-4159.2009.06181.x. [DOI] [PubMed] [Google Scholar]
- 17.Iadecola C. Cerebrovascular effects of amyloid-beta peptides: mechanisms and implications for Alzheimer’s dementia. Cell. Mol. Neurobiol. 2003;23:681–689. doi: 10.1023/A:1025092617651. [DOI] [PMC free article] [PubMed] [Google Scholar]
- 18.Iadecola C, Gorelick PB. Converging pathogenic mechanisms in vascular and neurodegenerative dementia. Stroke. 2003;34:335–337. doi: 10.1161/01.str.0000054050.51530.76. [DOI] [PubMed] [Google Scholar]
- 19.Kalaria RN. Small vessel disease and Alzheimer’s dementia: pathological considerations. Cerebrovasc. Dis. 2002;13:48–52. doi: 10.1159/000049150. [DOI] [PubMed] [Google Scholar]
- 20.Kiyoshi N, Kazama K, Younkin L, Younkin SG, Carlson GA, Iadecola C. Cerebrovascular autoregulation is profoundly impaired in mice overexpressing amyloid precursor protein. Am. J. Physiol. Heart Circ. Physiol. 2002;283:H315–H323. doi: 10.1152/ajpheart.00022.2002. [DOI] [PubMed] [Google Scholar]
- 21.Langa KM, Foster NL, Larson EB. Mixed dementia: emerging concepts and therapeutic implications. J. Am. Med. Assoc. 2004;292:2901–2908. doi: 10.1001/jama.292.23.2901. [DOI] [PubMed] [Google Scholar]
- 22.Maeda H, Matsumoto M, Handa N, Hougaku H, Ogawa S, Itoh T, Tsukamoto Y, Kamada T. Reactivity of cerebral blood flow to carbon dioxide in various types of ischemic cerebrovascular disease: evaluation by the transcranial Doppler method. Stroke. 1993;24:670–675. doi: 10.1161/01.str.24.5.670. [DOI] [PubMed] [Google Scholar]
- 23.Markus HS, Harrison MJ. Estimation of cerebrovascular reactivity using transcranial Doppler, including the use of breath-holding as the vasodilatory stimulus. Stroke. 1992;23:668–673. doi: 10.1161/01.str.23.5.668. [DOI] [PubMed] [Google Scholar]
- 24.Marmarelis VZ. Identification of nonlinear biological systems using Laguerre expansions of kernels. Ann. Biomed. Eng. 1993;21:573–589. doi: 10.1007/BF02368639. [DOI] [PubMed] [Google Scholar]
- 25.Marmarelis VZ. Modeling methodology for nonlinear physiological systems. Ann. Biomed. Eng. 1997;25:239–251. doi: 10.1007/BF02648038. [DOI] [PubMed] [Google Scholar]
- 26.Marmarelis PZ, Marmarelis VZ. Analysis of Physiological Systems: The White-Noise Approach. Plenum; New York: 1978. (Russian translation, Mir Press, Moscow, 1981; Chinese translation, Academy of Sciences Press, Beijing, 1990) [Google Scholar]
- 27.Marmarelis VZ, Shin DC, Zhang R. Linear and nonlinear modeling of cerebral flow autoregulation using Principal Dynamic Modes. Open Biomed. Eng. J. 2012;6:42–55. doi: 10.2174/1874230001206010042. [DOI] [PMC free article] [PubMed] [Google Scholar]
- 28.Marmarelis VZ, Shin DC, Orme ME, Zhang R. Closed-loop dynamic modeling of cerebral hemodynamics. Ann. Biomed. Eng. doi: 10.1007/s10439-012-0736-8. (in press). doi:10.1007/s10439-012-0736-8. [DOI] [PMC free article] [PubMed] [Google Scholar]
- 29.Marmarelis VZ. Nonlinear Dynamic Modeling of Physiological Systems. Wiley-Interscience; 2004. [Google Scholar]
- 30.Mitsis GD, Poulin MJ, Robbins PA, Marmarelis VZ. Nonlinear modeling of the dynamic effects of arterial pressure and CO2 variations on cerebral blood flow in healthy humans. IEEE Trans. Biomed. Eng. 2004;51:1932–1943. doi: 10.1109/TBME.2004.834272. [DOI] [PubMed] [Google Scholar]
- 31.Mitsis GD, Zhang R, Levine BD, Marmarelis VZ. Modeling of nonlinear physiological systems with fast and slow dynamics II: application to cerebral autoregulation. Ann. Biomed. Eng. 2002;30:555–565. doi: 10.1114/1.1477448. [DOI] [PubMed] [Google Scholar]
- 32.Mitsis GD, Zhang R, Levine BD, Marmarelis VZ. Cerebral hemodynamics during orthostatic stress assessed by nonlinear modeling. J. Appl. Physiol. 2006;101:354–366. doi: 10.1152/japplphysiol.00548.2005. [DOI] [PubMed] [Google Scholar]
- 33.Mitsis GD, Zhang R, Levine BD, Tzanalaridou E, Katritsis DG, Marmarelis VZ. Nonlinear analysis of autonomic control of cerebral hemodynamics. IEEE Eng. Med. Biol. 2009;28:54–62. doi: 10.1109/MEMB.2009.934908. [DOI] [PMC free article] [PubMed] [Google Scholar]
- 34.Murray IVJ, Proza JF, Sohrabji F, Lawler JM. Vascular and metabolic dysfunction in Alzheimer’s disease: a review. Exp. Biol. Med. 2011;236(7):772–782. doi: 10.1258/ebm.2011.010355. [DOI] [PubMed] [Google Scholar]
- 35.Nicolakakis N, Hamel E. Neurovascular function in Alzheimer’s disease patients and experimental models. J. Cereb. Blood Flow Metab. 2011;31(6):1354–1370. doi: 10.1038/jcbfm.2011.43. [DOI] [PMC free article] [PubMed] [Google Scholar]
- 36.Panerai RB. Cerebral autoregulation: from models to clinical applications. Cardiovasc. Eng. 2008;8:42–59. doi: 10.1007/s10558-007-9044-6. [DOI] [PubMed] [Google Scholar]
- 37.Panerai RB. Transcranial Doppler for evaluation of cerebral autoregulation. Clin. Auton. Res. 2009 doi: 10.1007/s10286-009-0011-8. doi:10.1007/s10286-009-0011-8. [DOI] [PubMed] [Google Scholar]
- 38.Panerai RB, Dawson SL, Potter JF. Linear and nonlinear analysis of human dynamic cerebral autoregulation. Am. J. Physiol. 1999;277:H1089–H1099. doi: 10.1152/ajpheart.1999.277.3.H1089. [DOI] [PubMed] [Google Scholar]
- 39.Panerai RB, Simpson DM, Deverson ST, Mahony P, Hayes P, Evans DH. Multivariate dynamic analysis of cerebral blood flow regulation in humans. IEEE Trans. Biomed. Eng. 2000;47:419–423. doi: 10.1109/10.827312. [DOI] [PubMed] [Google Scholar]
- 40.Paulson OB, Strandgaard S, Edvinsson L. Cerebral autoregulation. Cerebrovasc. Brain Metab. Rev. 1990;2:161–192. [PubMed] [Google Scholar]
- 41.Roher AE, Kuo YM, Esh C, Knebel C, Weiss N, Kalbach W, Luehrs DC, Childress JL, Beach TG, Weller RO, Kokjohn TA. Cortical and leptomeningeal cerebrovascular amyloid and white matter pathology in Alzheimer’s disease. Mol. Med. 2003;9:112–122. [PMC free article] [PubMed] [Google Scholar]
- 42.Schneider JA, Wilson RS, Bienias JL, Evans DA, Bennett DA. Cerebral infarctions and the likelihood of dementia from Alzheimer disease pathology. Neurology. 2004;62:1148–1155. doi: 10.1212/01.wnl.0000118211.78503.f5. [DOI] [PubMed] [Google Scholar]
- 43.Sellke FW, Seshadri S, Chui HC, Higashida RT, Lindquist R, Nilsson PM, Roman GC, Petersen RC, Schneider JA, Tzourio C, Arnett DK, Bennett D, Iadecola C, Launer LJ, Laurent S, Lopez OL, Nyenhuis D, Gorelick PB, Scuteri A, Black SE, DeCarli C, Greenberg SM. Vascular contributions to cognitive impairment and dementia: a statement for healthcare professionals from the AHA/ASA. Stroke. 2011;42(9):2672–2713. doi: 10.1161/STR.0b013e3182299496. [DOI] [PMC free article] [PubMed] [Google Scholar]
- 44.Silvestrini M, Pasqualetti P, Baruffaldi R, Bartolini M, Handouk Y, Matteis M, Moffa F, Provinciali L, Vernieri F. Cerebrovascular reactivity and cognitive decline in patients with Alzheimer’s disease. Stroke. 2006;37:1010–1015. doi: 10.1161/01.STR.0000206439.62025.97. [DOI] [PubMed] [Google Scholar]
- 45.Smith EE, Greenberg SM. Amyloid-beta, blood vessels and brain function. Stroke. 2009;40(7):2601–2606. doi: 10.1161/STROKEAHA.108.536839. [DOI] [PMC free article] [PubMed] [Google Scholar]
- 46.Tantucci C, Bottini P, Fiorani C, Dottorini ML, Santeusanio F, Provinciali L, Sorbini CA, Casucci G. Cerebrovascular reactivity and hypercapnic respiratory drive in diabetic autonomic neuropathy. J. Appl. Physiol. 2001;90:889–896. doi: 10.1152/jappl.2001.90.3.889. [DOI] [PubMed] [Google Scholar]
- 47.Tong XK, Nicolakakis N, Kocharyan A, Hamel E. Vascular remodeling versus amyloid beta-induced oxidative stress in the cerebrovascular dysfunctions associated with Alzheimer’s disease. J. Neurosci. 2005;25(48):11165–11174. doi: 10.1523/JNEUROSCI.4031-05.2005. [DOI] [PMC free article] [PubMed] [Google Scholar]
- 48.van Beek AH, Claassen JA, Rikkert MG, Jansen RW. Cerebral autoregulation: overview of current concepts and methodology with special focus on the elderly. J. Cereb. Blood Flow Metab. 2008;28:1071–1085. doi: 10.1038/jcbfm.2008.13. [DOI] [PubMed] [Google Scholar]
- 49.van Beek AH, Lagro J, Olde-Rikkert MG, Zhang R, Claassen JA. Oscillations in cerebral blood flow and cortical oxygenation in Alzheimer’s disease. Neurobiol. Aging. 2012;33(2):428.e21–428.e31. doi: 10.1016/j.neurobiolaging.2010.11.016. [DOI] [PubMed] [Google Scholar]
- 50.Yaffe K, Barrett-Connor E, Lin F, Grady D. Serum lipoprotein levels, statin use, and cognitive function in older women. Arch. Neurol. 2002;59:378–384. doi: 10.1001/archneur.59.3.378. [DOI] [PubMed] [Google Scholar]
- 51.Zhang R, Zuckerman JH, Giller CA, Levine BD. Transfer function analysis of dynamic cerebral autoregulation in humans. Am. J. Physiol. 1998;274:233–241. doi: 10.1152/ajpheart.1998.274.1.h233. [DOI] [PubMed] [Google Scholar]
- 52.Zhang R, Zuckerman JH, Iwasaki K, Wilson TE, Crandall CG, Levine BD. Autonomic neural control of dynamic cerebral autoregulation in humans. Circulation. 2002;106:1814–1820. doi: 10.1161/01.cir.0000031798.07790.fe. [DOI] [PubMed] [Google Scholar]