

Abstract
Metabolism has been identified as a defining factor in drug development success or failure because of its impact on many aspects of drug pharmacology, including bioavailability, half-life and toxicity. In this article, we provide an outline and descriptions of the resources for metabolism-related property predictions that are currently either freely or commercially available to the public. These resources include databases with data on, and software for prediction of, several end points: metabolite formation, sites of metabolic transformation, binding to metabolizing enzymes and metabolic stability. We attempt to place each tool in historical context and describe, wherever possible, the data it was based on. For predictions of interactions with metabolizing enzymes, we show a typical set of results for a small test set of compounds. Our aim is to give a clear overview of the areas and aspects of metabolism prediction in which the currently available resources are useful and accurate, and the areas in which they are inadequate or missing entirely.
There is immense pressure on all developers of new drugs today to efficiently and cost-effectively produce compounds with efficacies better than existing therapies and with very limited adverse effects. This requires the simultaneous optimization of both the desired bioactivity and the absorption, distribution, metabolism, excretion and toxicity (ADMET) properties of a drug candidate. Of the ADMET processes, metabolism, and specifically metabolic stability, has been identified as a defining characteristic in drug development success or failure due to its overall impact on compound pharmacokinetics. Therefore, metabolic information about compounds in the drug-discovery pipeline is crucial to their development as drugs. For example, extensive first-pass metabolism can contribute to low bioavailability, while metabolism that occurs too rapidly can cause a short therapeutic window requiring a frequent dosing schedule. Conversely, metabolism that proceeds too slowly can cause an accumulation of drug in the body and increases the risk of toxic effects. Inhibition or induction of the CYP450 enzymes, which catalyze the majority of metabolic reactions [1], can cause adverse drug interactions. In some cases, the metabolites of a compound can be toxic or reactive, or can themselves exhibit bioactivities that may differ from their parent molecule [2].
The importance of a full understanding of metabolite formation and interactions with CYPs became clear in the 1990s when the antihistamine terfenadine (marketed as Seldane in the USA) was implicated in life-threatening cardiotoxic drug–drug interactions with ketoconazole, an antifungal drug [3]. Terfenadine is a prodrug that ordinarily is rapidly metabolized by CYP 3A4 into its active carboxylated metabolite. However, in the presence of ketoconazole or other drugs, such as macrolide antibiotics, that inhibit CYP 3A4, the concentration of the parent compound can rise to toxic levels [4]. Unfortunately, for Hoechst Marion Roussel (now Sanofi-Aventis), the makers of terfenadine, the active carboxylated metabolite fexofenadine had meanwhile been patented by another company, and Hoechst Marion Roussel was forced to buy back the development rights in order to market it (as Allegra® in the USA) [5]. This incident led to a new appreciation of hERG inhibition as a mechanism for drug toxicity [6,7] and new requirements from the US FDA for a characterization of the metabolites of any new drug candidate along with in vitro measurements of CYP inhibition and induction [4].
The 1990s were also the heyday of hope and hype for the new drug-discovery technologies of combinatorial chemistry and high-throughput screening, and the development and testing of large screening libraries. It became clear that in order to realize the potential of the large numbers of hits coming out of high-throughput screens, the determination of ADMET properties would also have to be carried out more rapidly and efficiently than the in vivo screens that were standard for the time [8,9]. This led to the development of new, faster in vitro metabolism screening methods [10] as well as even more rapid and inexpensive in silico models [11].
Although in vitro screening methods can be fairly accurate for determining metabolic properties, they have several limitations, including the cycle time and the inefficiency when screening large numbers of compounds [12], not to mention the significant cost when applied to large screening libraries. In silico screening can help to alleviate the strain of large numbers of samples on the in vitro methods by characterizing, categorizing and, thus, potentially eliminating metabolically unstable compounds from the collection of candidates early on in the drug-discovery process [13].
Here, we describe databases (Table 1) and software (Table 2) that can be obtained and used by the general (scientific) public, namely, resources that are either marketed as commercial products, or that are freely or even openly available (Box 1). Dozens, if not hundreds, of metabolism prediction methods can be found in the literature, and reviews thereof are published quite frequently [13–15]. Many of the QSAR models described in the literature have been developed by pharmaceutical companies, on large proprietary datasets, using proprietary descriptors and/or ‘black-box’ machine learning methods. Such studies may be an illustration of what is possible given enough good and consistent data. However, for the drug developer at a different company or institution desiring a simple off-the-shelf method to use in an ongoing fast-paced research project, most of these studies are not immediately useful.
Table 1.
Publicly available databases and datasets with metabolism-related content.
| Name | Company/institution | Availability | Compound Source | Properties | Ref. |
|---|---|---|---|---|---|
| ADME DB | Fujitsu | Commercial | Literature | Metabolizing enzymes, reaction data | [217,218] |
| AurSCOPE ADME | Aureus Sciences | Commercial | Literature, patents, drugs | Metabolizing enzymes, reaction data, metabolic stability | [260] |
| BioPrint | Cerep | Commercial | Drugs | Measured bioactivities | [89,257] |
| ChEMBL | European Bioinformatics Institute | Free, open | Literature | Bioactivities | [93,264] |
| DrugBank | University of Alberta | Free, open | Drugs | Pharmacology, metabolizing enzymes | [91,259] |
| MetaBase | GeneGo | Commercial | Literature | CYP substrates | [29,203] |
| Metabolite | Accelrys | Commercial | Literature | Biotransformations | [201] |
| Microsomal Stability | Evolvus | Commercial | Literature | Clearance, half-life | [262] |
| PubChem | NCBI, NIH | Free | Various | Measured bioactivities | [66,233] |
| QSAR World | Strand Life Sciences | Free | Literature | Clearance, half-life | [263] |
| WOMBAT-PK | Sunset Molecular Discovery | Commercial | Literature, drugs | Pharmacokinetic data | [90,258] |
Table 2.
Publicly available software for metabolism-related predictions.
| Name | Company/Institution | Availability | Prediction | Method | Ref. |
|---|---|---|---|---|---|
| ACD/Percepta | ACD/Labs | Commercial | Metabolic reaction sites, CYP substrates and inhibitors | QSAR models | [50,51,224] |
| ADMET Descriptors/Collection | Accelrys | Commercial | CYP 2D6 inhibition | QSAR model | [71,251,252] |
| ADMET Predictor | Simulations Plus | Commercial | Metabolic reaction sites, CYP substrates, inhibitors, kinetics, UGT substrates, clearance | QSAR models | [211] |
| ADMEworks Predictor | Fujitsu | Commercial | CYP-binding affinities | QSAR models | [253] |
| CypScore | CAChe Research | Free | Metabolic reaction sites | QSAR models | [43,219] |
| isoCYP | Molecular Networks | Commercial | CYP substrates | QSAR models | [75,254] |
| MetabolExpert | CompuDrug | Commercial | Biotransformations | Logical rules | [30,205] |
| Metabolizer | ChemAxon | Beta ‘preview’ | Biotransformations | Reaction enumeration | [216] |
| MetaDrug | GeneGo | Commercial | Biotransformations, CYP substrates and inhibitors | QSAR models | [29,204] |
| META-PC | MultiCASE | Commercial | Biotransformations | Fragmentation, dictionary rule application | [32,34,207] |
| MetaPrint2D | University of Cambridge (UK) | Open source | Metabolic reaction sites, biotransformations | Fingerprint counting | [53,54,228] |
| MetaSite | Molecular Discovery | Commercial | Metabolic reaction sites, metabolites | Structural alignment plus semi-empirical calculations | [39,214] |
| METEOR | Lhasa | Membership | Biotransformations | Rule application plus logical reasoning | [35,36,208] |
| MEXAlert | CompuDrug | Commercial | First-pass conjugation | Rule application | [267] |
| P450 SOM | Schrödinger | Commercial | Metabolic reaction sites | Docking plus rules | [56,231] |
| PASS | GeneXplain | Commercial | CYP substrates, inhibitors, inducers, phase II substrates | QSAR models | [69,247] |
| QikProp | Schrödinger | Commercial | Number of biotransformations | SMARTS matching | [268] |
| RS-Predictor | Rensselaer | Free | Metabolic reaction sites | QSAR models | [46,48,223] |
| SMARTCyp | University of Copenhagen (Denmark) | Free | Metabolic reaction sites | Ab initio calculations (fragment look-up) plus structural measurements | [44,45,222] |
| StarDrop | Optibrium | Commercial | Regiolability, CYP binding affinity | Semi-empirical calculations, QSAR models | [209] |
| TIMES | Burgas ‘Prof. Assen Zlatarov’ University (Bulgaria) | Unknown | Biotransformations | Rule application, QSAR models | [40,41,215] |
| VirtualToxLab | Biograf 3R/University of Basel (Switzerland) | Commercial | CYP and nuclear receptor binding affinities | Docking plus QSAR models | [78,255] |
Box 1. Definitions of the various levels of accessibility that can be provided for software and databases.
-
▪
We provide definitions, as used in this paper, of the various levels of accessibility that can be provided for software and databases. Note that these are not necessarily the same as the definitions used by the Open Source Initiative or the GNU Project.
-
▪
Academic: resource developed by an academic or nonprofit group that is available for free to other nonprofit researchers, and in exchange for money to anyone else.
-
▪
Commercial products: resource that is available to anyone in exchange for money.
-
▪
Freely available: resource that is available to anyone and costs no money.
-
▪
Openly available: database or software program for which the underlying data or source code is available to anyone for examination, modification, or incorporation into other resources as desired.
-
▪
Proprietary: private resource that is only available to certain people (i.e., its developers or the employees of a company).
-
▪
Publicly available: resource that can be accessed or used by anyone, regardless of affiliation, either for free or in exchange for money.
This article focuses on a bottom-up, individual compound-driven approach to metabolism predictions, as opposed to the top-down systems biology approach, which is currently called ‘metabolomics.’ We are, therefore, not generally including here tools that are used in metabolomics research, such as those for metabolite/biomarker identification and metabolic profiling studies. We are also not including tools for what could be called environmental metabolism predictions, that is, biodegradation or biocatalysis by bacteria. Many of the commercial software programs listed here provide other functionality and can calculate additional ADMET properties other than what is described here. We do not aim to provide a complete description of each package, only the portions of it relative to metabolism predictions.
The metabolism end points that are currently predicted by in silico methods can be divided into two general types. The first type consists of predictions of the effects of metabolism on the structure of a compound itself, such as a list of its metabolites, the reactions that the compound will undergo (biotransformations), or the atomic sites where metabolic reactions are most likely to take place (regiolability or regioselectivity). The second type of predictions are concerned with which enzymes the compound will interact with, and include the classification of CYP substrates, inhibitors and inducers, as well as predictions of whether the compound will also (or instead) be metabolized by non-CYP enzymes such as glucuronosyltransferases and sulfotransferases. A third type of prediction, which we discuss in more detail in [16], involves estimation of a compound’s overall metabolic stability, that is, of its half-life or clearance rate, measured either in vivo or in an in vitro model.
Effects of metabolism on compound structures
The prediction of metabolites was the first computational end point for which software and databases became available, as early as the 1980s, due to the advent of personal computers and the publication of several textbooks that began to organize and categorize knowledge about metabolic reactions [1,17,18]. These methods generally consist of: a set of rules, extracted either directly from the literature or indirectly from the literature via a database; a method for applying the rules to an input compound; and a method for deciding when to stop applying them, that is, a way of ranking or ordering the combinatorial explosion of predicted metabolites. Many programs can also provide, either directly or via another program, an estimation of the toxicity for each predicted metabolite.
Regioselectivity or metabolic reaction site predictions are similar in spirit to the prediction of biotransformations, because each metabolic reaction must occur at a site, though not every site can undergo a reaction. Some software programs can predict both reactions and sites, and the underlying data for building models are generally the same. Site prediction methods fall into two categories: those that use a calculation (or fragment-based look-up) of the quantum chemical reactivity of each atom in the query molecule, usually along with a steric accessibility factor, and those that rely on some form of pattern matching to datasets of experimentally observed metabolic reaction sites. More detailed academic and proprietary/private methods have been reported in the literature [15,19], involving high-level quantum calculations, docking, homology modeling of CYP structures and molecular dynamics, but few of these have been implemented as publicly available software.
For further details on some of the programs discussed here, Kulkarni et al. [20] gives an in-depth review and comparison of the programs MetabolExpert, META, Meteor and TIMES. Computational methods for predicting sites of metabolism were reviewed recently and comprehensively by a group at Gedeon Richter in Hungary [14], and specific comparisons of a few commercial programs were done by groups in Belgium at Ghent University and Janssen Pharmaceutica [21], and at Genentech [22].
Databases
Metabolite
The oldest and largest commercial database containing biotransformation reactions, including parent compounds and metabolites, is Metabolite [201], a database of biotransformations that was developed by MDL Information Systems in 1994 [23]. MDL was purchased by Elsevier in 1997, then sold to Symyx in 2007. The Metabolite database is now available commercially through Accelrys, which merged with Symyx in 2010 (this database should not be confused with the Accelrys Metabolism database [202] originally called Biotransformations, and first developed by Synopsys, which merged into Accelrys in 2001. Metabolism was based on data extracted from two publications by the Royal Society of Chemistry: Biotransformations [24] and Metabolic Pathways of Agrochemicals [25]. Unfortunately, it is no longer commercially available).
Metabolite was originally based on data from a German book series, Biotransformation von Arzneimitteln [26], and the journal Pharmacokinetics [27]. It was intended to be a wide collection of metabolism data with a focus on quantity rather than quality [23] and now includes compounds from New Drug Applications, proceedings from meetings of the International Society for the Study of Xenobiotics and the scientific literature from 1990 onward [11]. These are mainly pharmaceutical compounds, but also include food additives, industrial chemicals and agrochemicals [28]. The latest version at the time of writing, 2011.2, contains 62,465 molecules and 103,907 biotransformation reactions, of which 36,041 are in humans. The database can be searched by structure, substructure or similarity to any or all of the parent, substrate (pathway intermediate) or metabolite compounds, or by a reaction query to the biotransformations. For some reactions in the database, the enzyme responsible for catalysis is listed, along with information about the reaction time and whether the compound can act as an inhibitor or an inducer as well as a substrate [201]. Data from both the Metabolite and Metabolism databases have been used extensively in the development of many software programs for predicting both metabolites and sites of metabolism, as will be shown below.
MetaBase
Other commercially available databases of biotransformations include MetaBase, from GeneGo, which is a large database that includes literature data on small molecule–protein, protein–protein and protein–DNA interactions, signaling pathways, regulatory networks and diseases. As of May 2012, it contains 692,425 chemical compounds, 44,171 proteins and 1,076,985 interactions. Relevant to metabolism predictions, it also contains a set of 9048 metabolic reactions on xenobiotic and endogenous compounds [203]. The program MetaDrug, first released in 2004, is a software platform and graphical interface to the MetaBase database [204]. In MetaDrug, a small set of 81 ‘metabolic rules’ covering phase I and II enzymes can be applied to input query compounds, and the predicted metabolites are prioritized according to their occurrence frequencies in MetaBase [29]. A set of QSAR models for various ADMET predictions can then be applied to the set of input compounds and their predicted metabolites, as will be discussed in the next section.
Software
MetabolExpert
The earliest computer program for metabolite prediction was MetabolExpert [30], first released in 1987 by the company CompuDrug [205], originally founded in Hungary. It was based on the metabolic pathways described in a textbook [17], which had been organized according to functional groups and substructures rather than chemical series. This allowed, for the first time, the possibility of deriving the biotransformations that were likely to occur on an entirely new compound [16], and thus, the formalizing of a set of logical rules for metabolism in an expert system. In MetabolExpert, the rules are programmed as logical statements in Prolog and are applied successively to the input molecule to generate a tree of predicted metabolites [30]. The set of rules was later augmented with data from other textbooks and the literature [206].
META
Another early program was META, part of the Computer Automated Structure Evaluation (CASE) system developed by Gilles Klopman at Case Western Reserve University (USA) in the mid-1980s [31], and now licensed by MultiCASE, Inc. [207] (META was originally written for VMS, in 1994, hence the name META-PC for the Windows version). META consists of a program for breaking down an input query molecule into fragments, then applying a dictionary of transformations to generate metabolites. There are four dictionaries available: mammalian metabolism, aerobic and anaerobic degradation by bacteria (for environmental toxicity predictions), and photodegradation. The program recognizes when an intermediate is chemically unstable and applies further transformations from a fifth ‘spontaneous’ dictionary until a stable chemical compound is achieved [32]. The mammalian metabolism dictionary for META [33] was built to be comprehensive, and to include only ‘well-established’ data from a set of textbooks dating from the mid-1970s to the early 1990s. A genetic algorithm was incorporated into the program to prioritize the transformations in the dictionary so as to be able to reproduce experimental data on observed metabolites [34]. The output from META is a tree of predicted metabolites, pruned at the point where the logP of the compounds is low enough that they can presumably be excreted by the kidneys [32].
Meteor
Meteor was developed beginning in 1997 by Lhasa, Ltd [208] as a logical outgrowth of their Derek system for toxicity prediction, as a means of dealing with chemicals that are nontoxic in their original form but run the risk of being converted into toxic metabolites in the body [35]. Meteor consists of a knowledge base of biotransformation reactions, collected from the Accelrys Metabolism database [202], from the literature, and via consultation with human experts from industry, regulatory agencies, and academia [36]. The biotransformation reactions are applied to input compounds and their logP is calculated. The resulting tree of metabolites is subjected to an absolute reasoning process to evaluate the qualitative probabilities for each reaction (probable, plausible, equivocal, doubted and improbable) as a function of the substrate’s lipophilicity, and a relative reasoning process to rank order the predicted metabolites according to regioselectivity data in the knowledge base [36].
StarDrop
StarDrop has the distinction of being simultaneously one of the oldest and one of the newest software programs for metabolic site prediction. It began life in the Camitro Corporation, which was founded in 1998 at the height of the dot-com boom, and offered its suite of ADME prediction models over a secure internet connection [11]. Camitro merged with ArQule in 2001, and in 2003, ArQule sold its ADME capabilities to Inpharmatica, who named the ADME program Admensa Interactive. Inpharmatica was bought by BioFocus in 2006, and initially kept the name Admensa, but in 2008 the program was renamed StarDrop. Finally, the company Optibrium was spun off from BioFocus in 2009, for the sole purpose of developing and marketing the StarDrop software [209].
StarDrop can predict reaction sites on small-molecule substrates for CYPs 3A4, 2D6 and 2C9. For all these enzymes, a semi-empirical calculation of hydrogen removal energies at the AM1 level is used [37,38]. This is supplemented by additional empirical steric and orientation parameters, which are different for each CYP. StarDrop no longer runs over the internet, but as a desktop client, which can be coupled to a server for running the computationally intensive semi-empirical quantum mechanical calculations. Because of these calculations, StarDrop predictions for the site of metabolism are significantly slower than methods involving only a QSAR model or a database lookup, on the order of a few minutes per molecule. The output from StarDrop is a listing of predicted sites of metabolism for the query molecule, ranked in order of the predicted relative proportion of metabolites formed at each site. Additionally, for CYP 3A4, a ‘composite site lability’ is calculated for the molecule as a whole, as an estimate of the efficiency of metabolism for the entire molecule. This number can be compared across different molecules in a data set [210].
ADMET Predictor
ADMET Predictor, formerly known as QMPRPlus, was first released in 1999 by Simulations Plus [211]. The Metabolism Module can predict sites of metabolism for nine CYPs (1A2, 2A6, 2B6, 2C8, 2C9, 2C19, 2D6, 2E1 and 3A4). The models for CYP site prediction were derived from data extracted from the Accelrys Metabolite database [201], supplemented with additional literature data. ADMET Predictor uses QSAR models built with molecular structure descriptors (e.g., molecular weight, numbers of various functional groups, geometric and electrostatic properties) and trained using artificial neural network classification ensembles [212]. In contrast to other metabolic site prediction programs, ADMET Predictor first predicts whether or not the query molecule is in fact a substrate for the CYP, and then calculates a propensity score for each atomic site [213].
ADMET Predictor can be run in interactive mode (with a spreadsheet-like user interface) or batch mode. In either case the predictions are very fast and use limited computing resources. The interactive mode can easily handle datasets of tens of thousands compounds on a Windows-based PC with a few GB of memory. For larger datasets, one may run into memory issues with the spreadsheet interface in the interactive mode.
MetaSite
MetaSite from Molecular Discovery, which was first released in 2003, is perhaps the most well-known program for regioselectivity predictions [214]. It is based on the alignment of 3D interaction points calculated for a substrate binding site with similar interaction points calculated for input query compounds. An alignment of the two sets of interaction points is optimized to predict the orientation of the query compound in the CYP active site. This allows the calculation of an accessibility score for each atom in the query, based on its distance to the heme in the CYP active site. A reactivity score is also calculated for each atom, based on semi-empirical calculations of the energy for hydrogen removal. The probability of metabolism at each site in the input compound is then given as the product of its accessibility and reactivity scores [39]. MetaSite can also calculate the contributions to reactivity by atoms adjacent to the site, which is useful for suggesting synthetic modifications to a compound’s structure in cases where the site of metabolism itself cannot be modified for whatever reason. MetaSite contains built-in models for the CYP 1A1, 1A2, 2B6, 2C9, 2C19, 2D6, 2E1, 3A4 and 3A5 substrate binding sites, and additional models for mutants or other isoforms can be built and added by the user. The newest functionality in MetaSite is the ability to generate structures for the metabolites produced by reactions at each site [214].
TIMES
Like Meteor, Tissue Metabolism Simulator (TIMES) is focused on toxicology predictions. TIMES was developed in 2004 at the Laboratory of Mathematical Chemistry at Burgas ‘Prof. Assen Zlatarov’ University in Bulgaria [215]. Currently, it contains a liver (S9) metabolism simulator [40] and a skin metabolism simulator [41], both of which are based on biotransformations collected from literature data. Generation of the metabolic maps produced from applying the biotransformation reactions to the input query molecule is stopped when a threshold for either metabolite occurrence probability or logP is reached [40]. The set of metabolites can then be filtered through one of several QSAR models to rank them according to their predicted toxicity [215].
Metabolizer
Metabolizer is a tool for the ChemAxon platform. It was introduced in 2007, and it is currently only available as a ‘preview’, pending the development of a full set of biotransformation libraries. To run Metabolizer, a library of reactions is loaded along with the set of substrates, and a set of metabolites is enumerated by applying the reactions to the substrates [216].
Merck dataset
In 2007 researchers at Merck and Co. published a set of QSAR models for predicting regioselectivity for CYPs 3A4, 2D6 and 2C9 [42]. This, in itself, is nothing extraordinary, and their methods are not available as public software; however, rather than simply providing a list of references or referring vaguely to ‘literature data’ they published the structures of the compounds used in their training sets, which were extracted from the Accelrys Metabolite [1] and Fujitsu ADME DB [217,218] databases, in computer-readable mol2 format, as supplementary information that could be downloaded. This dataset of 521 compounds was used, as either a training or test set, to develop no fewer than three new freely available site prediction methods: CypScore, SMARTCyp and RegioSelectivity Predictor (RS-Predictor).
CypScore
CypScore is an implementation by CAChe Research [219] of a method described by researchers at Bayer and the University of Erlangen-Nuremberg (Germany) in 2009 [43]. It is a hybrid of a metabolic site prediction method and a method for estimating clearance or microsomal stability in that it predicts the regiolability of query molecules toward a generalized ‘super CYP’; or, in other words, identifies sites on the input query molecules that are the most generally susceptible to oxidation. Unlike some other site prediction methods, it can be used to rank molecules relative to one another. CypScore provides a set of six multiple linear regression models for various oxidation reaction types. Models were trained using a dataset curated from the literature and from the Biotransformations [24] publication series that formed the basis for the Accelrys Metabolism database [202]. The descriptors in the models are features of the molecular electrostatic surface and of the semi-empirically calculated (AM1) wave function [43]. The compounds published by Merck [42] were used as a test set. CypScore was validated using a proprietary dataset at Bayer (though trained on public data), but the results were reported in such a way that the models could easily be reproduced by other researchers.
CypScore is freely available as a customized plug-in for the modeling program MOE from Chemical Computing Group [220] and as a component for Pipeline Pilot from Accelrys [221]. However, to perform the calculations it requires other CAChe Research software that is available under academic licensing terms [219].
SMARTCyp
SMARTCyp, released in 2010, is a simple and elegant method for predicting sites that are metabolized by CYP 3A4 and 2D6, relying on only two or three molecular descriptors. The first of these is a reactivity descriptor, which is a measure of the activation energy of the oxidation reaction at each site in the query molecule, looked up in a table of fragment energies pre-calculated using density functional theory. The second descriptor is a measure of how far each site is from the center of the molecule [44]. The CYP 2D6 model adds a third descriptor as a measure of the distance to the nearest protonated nitrogen atom [45]. The aforementioned compounds from Merck [42] were used as a test set to validate the models [44].
SMARTCyp is freely and openly available as a web service or a downloadable Java program from the University of Copenhagen (Denmark) [222]. Since SMARTCyp uses 2D ligand structure information only, it is very fast, and both the web service and the Java executable of the program are user friendly. The open source code for SMARTCyp has allowed its methodology to be used and expanded by other researchers: SMARTCyp predicted reactivities are incorporated as descriptors into the newest version of RS-Predictor, described below [46], and an openly available extension of the SMARTCyp program to cover three more CYPs, namely 1A2, 2C9 and 2C19, was recently implemented [47].
RS-Predictor
RS-Predictor was first published in 2011 [48]. It uses a large set of substructure-based, physicochemical and quantum chemical (semi-empirical AM1) descriptors, and a machine learning method called multiple instance ranking, which is a variation of support vector machines. The models were calibrated on a dataset consisting of the Merck compounds [42], curated and augmented by compounds from a recent review paper [49]. RS-Predictor was originally developed to predict metabolism sites for CYP 3A4, but has now been extended to 1A2, 2A6, 2B6, 2C19, 2C8, 2C9, 2D6, 2E1 and a theoretical ‘merged’ CYP enzyme [46]. Their training sets, annotated with site predictions from RS-Predictor, SMARTCyp, StarDrop and Schrödinger P450 Site of Metabolism, are available for download in SD format as supplementary information to the journal articles [46,48].
RS-Predictor is freely available as a web service from the Rensselaer Exploratory Center for Cheminformatics Research [223]. It is simple to use and requires only the upload of an SD file containing the query structures. The output consists of an SD file in return, annotated with the predicted primary, secondary and tertiary sites of metabolism for each compound in each CYP model.
ACD/Percepta
ACD/Percepta [224], formerly known as ADME Suite, was created in 2009 with the merger of Pharma Algorithms with ACD/Labs. Initially, the only available metabolism-related model, which had been developed by Pharma Algorithms, was for CYP 3A4 binding and sites of metabolism [225]. The regiolability models have since been expanded to include CYP 1A2, 2C19, 2C9 and 2D6, as well as a general model for human liver microsomes [226]. They are trained on literature data using fragment-based descriptors and a partial least squares-based modeling method that accounts for similarity between the query compound and compounds in the training set as well as the consistency of the experimental data for the training set compounds. This allows a reliability measure to be reported along with each site prediction [50,51]. For each prediction ACD/Percepta also displays the five most similar compounds from the training set [226,227].
MetaPrint2D
MetaPrint2D is a new open-source tool, developed in 2010 at the University of Cambridge (UK), that is freely available as a web service [228] and as a standalone Java program [229], and is also distributed as part of the Bioclipse chemo- and bio-informatics workbench [52,230]. It uses circular fingerprints to describe the environment around each atom according to the atom types found bonded to it [53]. The Accelrys Metabolite database [201] was mined to extract counts of how often biotransformations occur (or do not occur) at specific atom environments. The ratio of how often an atom environment is versus is not a reaction center gives an estimate of the likelihood of a biotransformation reaction occurring at an atom environment of that type in a new query compound [54]. The basic method for counting metabolite occurrence frequencies is the same as that used by MetaDrug to prioritize predicted metabolites [55]. The output from MetaPrint2D is a 2D structural drawing of the query compound with its atoms colored to indicate the likelihood of a biotransformation occurring at that site. In a recent extension called MetaPrint2D-React, the reactions that may occur at each atomic site and the structures of predicted metabolites can also be generated [228].
P450 Site of Metabolism
A new addition to the Schrödinger Suite of modeling programs as of 2011 is a docking-based P450 Site of Metabolism prediction method (an initial version was called IDSite [56]). This is a welcome development, inasmuch as, aside from MetaSite, most if not all other publicly available regioselectivity methods do not directly incorporate structural information about the interaction of a query compound with the CYP binding site. The Schrödinger method relies on an induced-fit docking protocol [57], which uses Glide ligand docking into a flexible receptor site, where side chain conformations are adjusted using the homology modeling module Prime. Available CYP structures include 2C9 and 2D6 (regioselectivity predictions can also be made for 3A4, but this model does not use docking). Each potential site of metabolism is given an overall score based on its accessibility to the heme in the ensemble of docked poses and a rule-based calculation of intrinsic reactivity [231].
Compound interactions with metabolizing enzymes
This general metabolism prediction end point includes the classification of compounds as CYP substrates, inhibitors, inducers and activators, binding predictions for phase II and non-CYP enzymes, and estimations of reaction rate constants and binding affinities. Publicly available software for predicting CYP interactions tends to be piecemeal, with individual QSAR models available as part of larger sets of ADMET property predicting packages. The prediction of whether or not a compound is a substrate of a given CYP enzyme is useful for the CYPs whose expression levels vary widely among different sub-populations (e.g., 2D6). Drugs that are substrates of CYP 3A4 can have their metabolism rates affected by dietary compounds such as those found in grapefruit juice. Knowing whether a compound is a CYP inhibitor is important for predicting drug–drug interactions. The difference between a substrate and an inhibitor is not always clear – generally, an inhibitor is a compound that binds tightly enough that the rate of metabolism of other substrates is affected. Commonly, inhibitors are defined as compounds with an IC50 cutoff of 10 µM or less [2].
CYP induction is an important process whereby the presence of xenobiotic compounds can increase the expression levels of certain CYPs, which has the effect of increasing the clearance of substrates metabolized by those CYPs, potentially causing drug–drug interactions [58,59]. The induction mechanism is mediated by nuclear receptor transcription factors, mainly the pregnane X receptor and the constitutive androstane receptor, which together induce CYPs from the 2B and 3A subfamilies, as well as the phase II UDP-glucuronosyl, sulfo- and glutathione transferases [60,61]. In addition, the aryl hydrocarbon receptor induces CYPs from the 1A subfamily along with several phase II enzymes, the peroxisome proliferator activated receptor induces CYPs from the 4A subfamily, and the liver X receptor induces CYPs from the 7A subfamily [60]. In addition to the expression level-based induction of CYP activity, CYPs can also be activated by certain compounds that, upon binding to the CYP enzyme itself, appear to increase the Vmax of substrate metabolism. This process is not well understood, and may either involve two molecules occupying the active site at the same time, or the presence of an allosteric site in certain isoforms [62].
Databases
ADME DB
ADME DB was developed by Slobodan Rendic of Zagreb University in Croatia, in collaboration with Fujitsu beginning in 2004 [63], and based on data collected from the literature on xenobiotic interactions with CYPs and other metabolizing enzymes [64,65]. Previously, these data had also been used in the software tool BioFrontier/P450, which was used to predict metabolites produced by CYPs [232] but which is no longer commercially available. As of April 2012, ADME DB contains information on 27,980 CYP substrates as well as 6125 substrates of other phase I and phase II metabolizing enzymes: esterases, UDP-glucuronosyltransferases, sulfotransferases, glutathione S-transferases and flavin-containing monooxygenases [217,218].
ADME DB can be searched by structure or substructure, but the search results cannot be exported in a structural format. The data for each compound include whether it is also an inhibitor, inducer or activator, the metabolic reaction it undergoes, and (where available) kinetic and other experimental information about the reaction such as the in vitro assay model used, Km, Vmax, Ki, IC50, EC50 and/or half-life. Unfortunately, the license terms for this database preclude any large-scale structure and property extraction, as well as the public dissemination of any models derived from the data.
PubChem
The well known PubChem database [66,233] contains a series of freely available assays deposited by the NIH Chemical Genomics Center (NCGC), for CYP inhibitors and substrates: 1A2 [234], 3A4 [235], 2C9 [236], 2C19 [237] and 2D6 [238], along with a panel assay with all five cytochromes [239]. The Sanford-Burnham Medical Research Institute (USA) has also screened for CYP 2C9 [240] and 2C19 [241] inhibitors. The Scripps Research Institute Molecular Screening Center (USA) has completed a set of primary and confirmatory assays for aryl hydrocarbon receptor activators, along with a counter screen for activators of the pregnane × receptor [242]. Additionally, NCGC has deposited a screen for activators of CYP 3A4 [243], and the Sanford-Burnham Medical Research Institute has screened for activators of 2C9 [244] and 2C19 [245]. These newer datasets have already been used in models included in MetaDrug and ACD/Percepta, discussed below.
The Comparative Toxicogenomics Database
The Comparative Toxicogenomics Database (CTD) is a meticulously curated collection of chemicals, genes and diseases, and the relationships and connections between them [246]. The focus of this resource is on links between environmental toxins and diseases in humans [67,68], but relevant to metabolism, it includes all of the CYP genes from hundreds of species, along with UDP-glucuronosyltransferases, sulfotransferases, N-acetyltransferases and so forth. The relationships between genes and compounds are described with a controlled vocabulary and so can be filtered according to the type of interaction. Along with binding, activity and expression, interactions include metabolic processing and a list of 35 hierarchical reaction types, such as hydroxylation, glucuronidation and acetylation. The entire set of chemical–gene interactions can be downloaded, or more specific datasets can easily be generated using batch queries [246]. However, chemical structures are not included and compounds are identified by MeSH and CAS numbers, so any extracted data would need to be collated with structural information from another resource for model building.
Software
PASS
Prediction of Activity Spectra for Substances (PASS) is a QSAR modeling program that can predict thousands of different bioactivities. The first version of PASS was developed in 1995, at the Institute of Biomedical Chemistry, in the Russian Academy of Medical Sciences. PASS is now commercially available through GeneXplain [247]. Predictions from PASS are qualitative and reported as the probability that each input compound is active and that it is inactive. The descriptors used in PASS are substructure- based, the so-called multilevel neighborhoods of atoms descriptors [69]. Its default models were trained on a dataset (called the SAR Base) that has been collected from the literature and various databases since 1972, and as of the 2011 version numbers 250,407 compounds.
PASS can qualitatively predict substrates for 97 CYP types and subtypes, inhibitors for 27 CYPs, and inducers for 12 CYPs (without regard to mechanism). There is also a model for predicting aryl hydrocarbon receptor agonists, which could also potentially be CYP inducers. Additionally, PASS has models for 70 non-CYP metabolism activities, including flavin-containing monooxygenase substrates, glutathione S-transferase substrates, monoamine oxidase substrates, peroxidase substrates, sulfotransferase substrates, and UDP-glucuronosyltransferase substrates, among others. The training sets for individual models in PASS (as part of the large default SAR Base) may be quite small, and this of course affects the ability of PASS to predict those activities with high probabilities for arbitrary compounds [70]. For each compound in the query set, PASS notes whether it contains substructure descriptors that were not seen in the training set, giving a further estimate of whether or not the model is likely to be predictive.
StarDrop
In a separate functionality from its regiolability predictions, StarDrop from Optibrium [209] has two QSAR models for CYP-binding affinity – a continuous model for 2C9 and a four-class classification model for 2D6. These models were trained on small sets of in vitro data collected in-house, and built using physicochemical descriptors along with atom type and functionality counts. The 2D6 classification model was built using decision trees and the 2C9 pKi model uses rule-based partial least squares equations. These models do not attempt to predict whether a compound will be a CYP substrate, only what its affinity will be if it is a substrate; their purpose is to predict potential drug–drug interactions. StarDrop determines whether an input compound fits into the chemical descriptor space of the models, and if not, an error of prediction with a value of infinity is returned. Otherwise, an estimate of the root-mean square error of prediction is given [248]. However, the error of prediction is not shown by default in the results window so users must exercise caution.
Accelrys
An ADME toolkit called C2.ADME was released for version 4.6 of the Cerius2 modeling program from Accelrys in 2001 [249]. This toolkit included a QSAR model for CYP 2D6 inhibition, based on a training set of 100 compounds from the literature. These compounds were collected using what the authors referred to as a ‘fairly relaxed set of criteria’ so that the training set was diverse in terms of both chemistry and bioactivity. The models were trained using an ensemble recursive partitioning technique and Cerius2 topological and atom type descriptors [71]. Currently the ADME toolkit is available in Discovery Studio [250,251] and as a component in the Pipeline Pilot ADME-Tox collection [221,252].
ADMEWORKS Predictor
ADMEWORKS Predictor, from Fujitsu, contains a set of QSAR models derived from the data in the ADME DB. It can predict Km for CYP 2D6 and 3A4, as well as Ki for CYP 3A4 inhibition [253]. Models for predicting kinetics and inhibition for other CYP types are under development. It is run over a web server located in Poland and, compared with a locally run program, the performance is quite slow.
MetaDrug
MetaDrug, from GeneGo [204], includes a set of CYP substrate and inhibition QSAR models that can be applied to both input compounds and to the full set of their predicted metabolites. These are binary classification models for substrates of 1A2, 2B6, 2D6 and 3A4, and for inhibitors (at IC50 <10 µM) of 1A2, 2C19, 2C9, 2D6 and 3A4. The substrate models were trained on literature data from MetaBase, and the inhibitor models were trained on data from the cytochrome panel assay in PubChem submitted by NCGC [239], using recursive partitioning methods and physicochemical property descriptors [72]. MetaDrug also has a classification model for pregnane × receptor activation, based on literature data from MetaBase, which could identify some CYP-inducing compounds, and a quantitative prediction of the pIC50 of human soluble epoxide hydrolase inhibition, an important phase II enzyme. For the models trained on MetaBase data, the training set can be viewed with a single click from each model description, which also includes the number of molecules in the training and test sets, and the statistical parameters for sensitivity, specificity, and accuracy. Model applicability domains are calculated using Tanimoto prioritization, which provides a measure of the similarity between the query compound and its most similar training set compound.
MetaDrug is run through a web interface. Input compounds can be uploaded in SD format, and the results can be viewed online or exported as an Excel file. MetaDrug is not intended for analysis of large datasets – the QSAR model predictions can only be run on files with less than 500 compounds, and the calculations performed on enumerated metabolites can only be run if the input file has fewer than 12 compounds.
isoCYP
isoCYP was released in 2007, and uses a simple model to classify input compounds as metabolized primarily by either CYP 3A4, 2D6, or 2C9 [254]. The training set for the model was taken from an earlier study from researchers at Liverpool John Moores University (UK), who had compiled a test set of known drugs [73] and a training set from the literature, and used these to construct recursive partitioning models for CYP substrate classification [74]. The structures of these compound sets were listed in SMILES format in a table in the manuscript. The program isoCYP is an attempt by researchers at Molecular Networks to improve upon, and market, the predictivity of the CYP substrate classification models, using molecular properties as descriptors and a support vector machine for classification. A set of compounds from the Accelrys Metabolite database [201] was also used as an external test set [75].
isoCYP is intended to be used for rapid filtering of large datasets, and can be run from the command line, from a graphical user interface, or through a component for Pipeline Pilot. It can also be tested free of charge for small sets of compounds on the Molecular Networks website [254]. The output for each compound is simply the name of the CYP for which it is predicted to be the most likely substrate. It does not take into account the possibility of overlapping substrates, or the possibility of non-CYP metabolism [75].
ADMET Predictor
In addition to its metabolic site predictions, the Metabolism Module in ADMET Predictor from Simulations Plus has classification models for substrate binding to CYPs 1A2, 2A6, 2B6, 2C8, 2C9, 2C19, 2D6, 2E1 and 3A4. There are also classification models for inhibition of five CYPs (1A2, 2C9, 2C19, 2D6 and 3A4), as well as specific Ki values for the inhibition of 3A4-mediated metabolism of midazolam and testosterone. These models were released in 2008 and developed in collaboration with Enslein Research, who collected and curated the literature data upon which the models are built [76]. Additionally, ADMET Predictor includes QSAR classification models for nine human UDP-glucuronosyltransferase isozymes. These can predict whether or not a compound will undergo a glucuronidation reaction before being oxidized in a phase I reaction [213]. All input compounds are checked to determine whether their molecular properties fall within the descriptor space of each model, and if not, the prediction is considered to be outside the scope of the model and flagged in the output [212].
ACD/Percepta
ACD/Percepta has QSAR models for the prediction of substrates and inhibitors for CYPs 1A2, 2C19, 2C9, 2D6 and 3A4. The models were trained on the same data used for the ACD/Percepta regiolability models, along with some additional data from known drugs. The inhibition models also used data from PubChem bioassays by NCGC [36]. The output for inhibitors is presented as the probability that a compound will bind with IC50 <50 µM and with IC50 <10 µM [227]. As with the regiolability models, a reliability measure is reported for the prediction. Additionally, the models can be revised and expanded to include any new experimental data that might be generated by the user to increase their coverage of chemical space and therefore the applicability domain [77].
VirtualToxLab
VirtualToxLab is unique among CYP binding prediction software programs in that it incorporates either an automated docking run or a ligand-based pharmacophore alignment to produce a set of predicted binding modes against the target of interest. For each target, a multidimensional QSAR model has been developed, consisting of a linear regression equation with atomistic descriptors, to convert scores calculated from the docked or aligned poses into predicted binding affinities [78,255]. VirtualToxLab has models for CYPs 1A2, 2A13, 2D6, 2C9 [79] and 3A4 [80], as well as other anti-targets that are involved in receptor-mediated toxicity reactions. A ‘toxic potential’ can then be calculated for each input compound based on its predicted binding affinities to all the models [78]. Three of these anti-targets are potentially involved in CYP induction: the aryl hydrocarbon [81], PPAR gamma [82] and liver X receptors [83].
VirtualToxLab was developed by the Biographics Laboratory of the 3R Research Foundation in Switzerland, whose goal is to find alternatives to animal experimentation. A version of VirtualToxLab is available (with some reduced functionality) for free to academic and nonprofit researchers. It is run with a Java interface, using the Java OpenGL library, installed on the client computer and communicating over an SSH connection with the remote server in Switzerland. This graphical interface allows the preparation of 3D structures for the input compounds, and the visualization of the docked poses for each compound. Due to the computationally intensive nature of the calculations, they take several hours per molecule per target, and only one molecule can be run at a time; however, a queuing system allows multiple molecules to be submitted in the same session.
Predictions
We collected from the Drugs@FDA website [256] a small test set of ten molecules that were very recently (within the last year) approved as drugs (new molecular entities). CYP substrate, inhibition, and induction data were extracted manually from the reviews included in the drug approval packages. Basic information about each drug is listed in Table 3, and structures are given in Table 4. We attempted to include a variety of chemotypes and therapeutic indications.
Table 3.
Recently approved drugs used as a small test set.
| Name | Trade name | Company | New drug application |
Approval | Mechanism | Target | Disease |
|---|---|---|---|---|---|---|---|
| Axitinib | Inlyta® | Pfizer | 202324 | 27 January 2012 | Kinase inhibitor | VEGFR | Renal cell carcinoma |
| Vismodegib | Erivedge™ | Genentech | 203388 | 30 January 2012 | Hedgehog pathway inhibitor | Smoothened GPCR | Basal cell carcinoma |
| Ivacaftor | Kalydeco™ | Vertex | 203188 | 31 January 2012 | CFTR potentiator | CFTR chloride channel | Cystic fibrosis |
| Ruxolitinib | Jakafi® | Incyte/Novartis | 202192 | 16 November 2011 | Kinase inhibitor | JAK1, JAK2 | Myelofibrosis |
| Crizotinib | Xalkori® | Pfizer | 202570 | 26 August 2011 | Kinase inhibitor | ALK, c-Met, RON | Non-small-cell lung cancer |
| Indacaterol | Arcapta™ | Novartis | 022383 | 1 July 2011 | Long-acting β2 agonist | β2 adrenergic receptor | Chronic obstructive pulmonary disease |
| Ticagrelor | Brilinta® | AstraZeneca | 022433 | 20 July 2011 | Platelet aggregation inhibitor | Platelet P2Y12 ADP-receptor | Acute coronary syndrome |
| Ezogabine | Potiga™ | GlaxoSmithKline/Valeant | 022345 | 10 June 2011 | Potassium channel opener | KCNQ/Kv7 | Epilepsy |
| Linagliptin | Tradjenta® | Boehringer Ingelheim | 201280 | 2 May 2011 | Peptidase inhibitor | DPP-4 | Type 2 diabetes |
| Abiraterone | Zytiga® | Janssen | 202379 | 28 April 2011 | Androgen biosynthesis inhibitor | CYP17 | Prostate cancer |
Table 4.
Test set structural information.
| Name | Structure | SMILES | InChI |
|---|---|---|---|
| Axitinib | 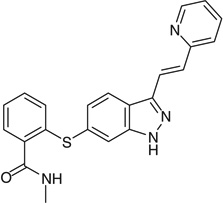 |
C2=C(SC1=CC=CC=C1C(=O)NC) C=CC3=C2[NH] N=C3C=CC4=CC=CC=N4 |
RITAVMQDGBJQJZ-UHFFFAOYSA-N |
| Vismodegib | 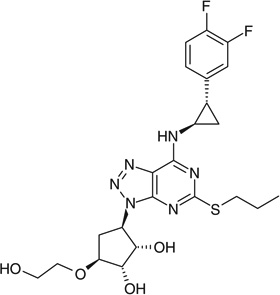 |
C1=C(Cl)C(=CC=C1[S](=O)(=O)C) C(=O)NC2=CC=C(Cl)C(=C2) C3=CC=CC=N3 |
BPQMGSKTAYIVFO-UHFFFAOYSA-N |
| Ivacaftor | 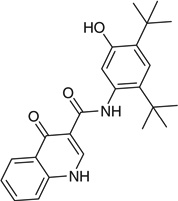 |
CC(C)(C)C1=CC(=C(C=C1NC(=O) C3=CNC2=CC=CC=C2C3=O)O)C(C)(C)C |
PURKAOJPTOLRMP-UHFFFAOYSA-N |
| Ruxolitinib | 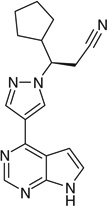 |
C[NH]C2=NC=NC(=C12)C3=C[N] (N=C3)[C@H](CC#N)C4CCCC4 |
HFNKQEVNSGCOJV-OAHLLOKOSA-N |
| Crizotinib | 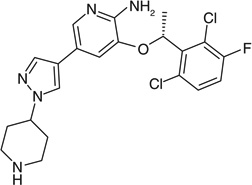 |
[C@H](OC1=CC(=CN=C1N)C2=C[N] (N=C2)C3CCNCC3)(C4=C(Cl) C=CC(=C4Cl)F)C |
KTEIFNKAUNYNJU-GFCCVEGCSA-N |
| Indacaterol | 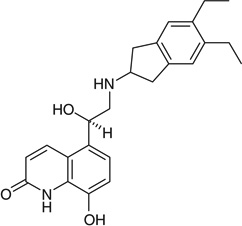 |
[C@@H](O)(C1=C2C(=C(O)C=C1) NC(=O)C=C2)CNC3CC4=C(C3) C=C(C(=C4)CC)CC |
QZZUEBNBZAPZLX-QFIPXVFZSA-N |
| Ticagrelor |  |
[C@@H]4([C@H](NC1=NC(=NC2=C1 N=N[N]2[C@H]3[C@H](O)[C@H](O) [C@@H](OCCO)C3)SCCC)C4) C5=CC(=C(F)C=C5)F |
OEKWJQXRCDYSHL-FNOIDJSQSA-N |
| Ezogabine | 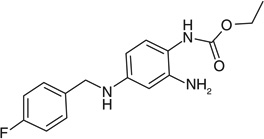 |
C1=CC(=CC(=C1NC(OCC)=O)N) NCC2=CC=C(C=C2)F |
PCOBBVZJEWWZFR-UHFFFAOYSA-N |
| Linagliptin | 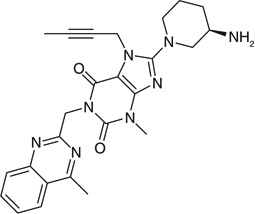 |
[C@H]5(N) CN(C1=NC2=C([N]1CC#CC)C(=O) N(C(=O)N2C)CC3=NC(=C4C(=N3) C=CC=C4)C)CCC5 |
LTXREWYXXSTFRX-QGZVFWFLSA-N |
| Abiraterone | 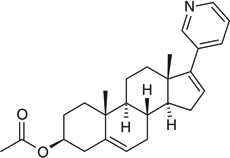 |
[C@@H]4([C@H](NC1=NC(=NC2=C1 N=N[N]2[C@H]3[C@H](O)[C@H](O) [C@@H](OCCO)C3)SCCC)C4) C5=CC(=C(F)C=C5)F |
UVIQSJCZCSLXRZ-UBUQANBQSA-N |
Here, the goal was not to provide a rigorous quantitative benchmark of the accuracy of prediction for each software program because this is a very small set of compounds and, although they are new drugs, all of them have been known in the literature for many years so we cannot guarantee that none of them is present in any of the model training sets. Rather, we intended to give a flavor of the range of enzyme interactions that could be calculated, the confidence given by each program in its predictions, and a sense of in which contexts each program might be useful.
We then ran predictions of the metabolizing enzyme interactions against this test set from all of the programs discussed in this section, with the exception of ADMEWORKS Predictor (because the trial version calculates only a small subset of the available properties) and the CYP 2D6 inhibition model in the Accelrys ADME toolkit. Versions used were: PASS 2011 Professional, StarDrop 5.0, the online demo version of isoCYP, MetaDrug (versionless, 2012), ADMET Predictor 6.0, and VirtualToxLab 4.2. The amount of computer time required to run the predictions ranged from a few seconds for the programs with simple QSAR models, to 1 h for MetaDrug, to over a week for the computationally intensive docking runs of VirtualToxLab.
The results of the predictions are shown in Figure 1. For PASS, all predictions where the probability that the compound is active was greater than the probability that it is inactive (Pa > Pi) are included. Uncertain predictions are defined as those where Pa <0.5. For StarDrop, CYP 2C9 inhibition was defined as a predicted pK >6 and 2D6 inhibitors were defined as those with predicted affinity high or very high. Uncertain predictions are those with an infinite error of prediction for 2C9 and those where the probability for each class of 2D6 inhibition is equal. In MetaDrug, substrates/inhibitors with a calculated QSAR value >0.5 were considered active, and uncertain predictions were those with a Tanimoto prioritization <50%. ADMET Predictor provides simple yes/no predictions for CYP substrates and inhibitors. In ACD/Percepta, active substrates and inhibitors were considered to be those with a probability >0.5 for an IC50 <50 µM, and uncertain predictions were those with a reliability index <0.3. In VirtualToxLab, if binding was predicted to be medium, high or very high, the compound was considered to be an inhibitor or inducer.
Figure 1. Predicted metabolizing enzyme interactions with the test set (Table 3).


Checkmarks indicate correct predictions, crosses indicate incorrect predictions and empty squares mean no prediction of the interaction was made. Confident predictions are shaded dark gray and uncertain predictions are shaded light gray.
AP: ADMET Predictor 6.0; iC: isoCYP; MD: MetaDrug; PC: ACD/Percepta; PS: PASS 2011; SD: StarDrop 5.0; VT: VirtualToxLab 4.2.
We did not observe any overwhelming difference in accuracy between the different software programs for our small test set, although of course, it bears re-emphasizing that we are presenting only a qualitative observation and not a rigorous statistical test. The most accurate results (defined as the number of correct predictions divided by the total number of predictions) were achieved by isoCYP, which predicted that all of the drugs would be metabolized by CYP 3A4, and in fact all of them are, with the exception of ezogabine, which is not a CYP substrate at all. VirtualToxLab and StarDrop both seem to perform well, with accuracies of approximately 75%. The remaining programs averaged approximately 60% accuracy.
We also calculated the sensitivity and the specificity for each program. Sensitivity is calculated as the number of true positives divided by the sum of true positives and false negatives, and defines the program’s ability to correctly make positive predictions (e.g., ivacaftor is a substrate of CYP 3A4). Specificity is calculated as the number of true negatives divided by the sum of true negatives and false positives, and defines the program’s ability to correctly make negative predictions (e.g., linagliptin does not induce CYP 2D6). Here, the differences between the programs were more pronounced.
PASS has the most available models for metabolizing enzyme interactions out of all the programs. However, by default, PASS does not show negative results (i.e., that an input compound is not an inhibitor of a given enzyme). If the result of a prediction is not on the list, then we know the probability of that activity is less than the predicted probability of its inactivity (Pa < Pi) but we are not sure how confident that prediction is.
ACD/Percepta is very conservative in expressing confidence in its predictions. The developers regard a reliability index >0.7 as a good prediction, and a reliability index between 0.3 and 0.7 as borderline. However, with our test set none of the predictions had a reliability index >0.7, and only two predictions were >0.5. We therefore used the bottom of the borderline, 0.3, as the cutoff, but even here only a third of the predictions were confident, the lowest ratio of all the programs. Generally speaking, the accuracy of the confident predictions in the other software programs was slightly higher. The greatest jump in accuracy between all predictions and only confident predictions was seen with MetaSite at 14% improvement.
This simple set of test results serves to highlight some of the difficulties faced by bench chemists or modelers without a particular interest in the gritty details of metabolic enzyme interactions or the pitfalls of QSAR modeling, who might only want a reasonably accurate prediction of the potential for toxicity or unfavorable drug–drug interactions as a filter in a screening cascade, or as a check on a set of analogs proposed for synthesis. Is a 60% accuracy rate really any kind of significant improvement over a random selection of compounds? For a single compound or a small set proposed for synthesis, in the absence of any prior knowledge about the metabolic behavior of the chemotype, such a prediction is essentially meaningless. One might well be better off generalizing from a set of simple rules of thumb [84]. Conversely, some of the programs (PASS, StarDrop, and VirtualToxLab) do show sensitivities in the 80–90% range, suggesting that they may be useful in a situation where false positives can be tolerated but false negatives (i.e., missing a good compound) are undesirable. As a filter to eliminate potentially problematic compounds, isoCYP, StarDrop, or ADMET Predictor would seem to be good choices, for rapidly if not entirely accurately predicting whether a compound is likely to be a substrate or an inhibitor of CYP 2C9 or 2D6. MetaDrug also shows reasonable specificity, but it is too slow to be used for a large database of compounds. Figure 1 also highlights, in its expanses of empty uncharted space, the lack of available computational predictions for most of the measurements that would be required by the FDA for any new drug application. This is summarized in the form of a calculated predictivity for each program, meaning the number of correct predictions divided by the total number of datapoints we had collected for all compounds. With the exception of PASS, all the programs have a predictivity of less than one-third.
Metabolic stability
The total body clearance and/or the half-life of a xenobiotic compound (these are inversely proportional to one another by the volume of distribution) is a complicated end point to model because it involves multiple enzymatic reactions and depends on factors such as the extent of plasma protein binding and the involvement of active transport across membranes. To simplify the situation, the intrinsic clearance of a compound can be considered. This consists of the portion of the total clearance that can be attributed to the removal of drug from the blood by the liver [85]. Intrinsic clearance can be approximated using one or a series of in vitro assays, including kinetics with recombinant CYPs expressed in baculoviruses, and half-life measured in human liver microsomes, liver S9 fraction, or intact hepatocytes. These in vitro assays are generally undertaken in a relatively high-throughput manner as an early screen during drug discovery, and referred to as metabolic stability assays [86,87].
It should be emphasized that the in vitro assays are themselves models, requiring various kinds of mathematical extrapolations to relate the in vitro measurements to in vivo clearance data. While there is definitely a strong correlation between in vitro and in vivo clearance, there is some concern about how well these in vitro assays can capture the complexities of clearance in vivo [86,88]. In attempting to predict, via in silico methods, an in vitro end point such as stability in human liver microsomes, one is in fact building a model of a model. Nevertheless, in silico methods may be useful as a means of filtering larger libraries of compounds much more cheaply and quickly than with in vitro screening methods.
Databases
BioPrint
The BioPrint database, developed in 1999, is produced by Cerep. Rather than data extracted from the literature, BioPrint contains data measured in-house in Cerep’s own set of 159 standardized assays. As of 2012, the database consists of a set of approximately 2500 known drugs and reference compounds. The assays relevant to metabolism are metabolic stability measured in human liver microsomes, and inhibition of CYPs 1A2, 2B6, 2C8, 2C9, 2C19, 2D6, 2E1, 3A4 and 3A5 [257]. QSAR models using the in vitro assay results as descriptors along with 3D pharmacophore-based molecular descriptors have been constructed by Cerep to allow the prediction of in vivo end points such as adverse drug reactions once a new compound has been run through the panel of assays [89]. Cerep sells this type of profiling as a service, but the BioPrint database itself is also available as a commercial standalone product.
WOMBAT-PK
World Of Molecular Bioactivity (WOMBAT)-PK was first released in 2005 by Sunset Molecular Discovery, as a subset of the WOMBAT database, to integrate medicinal chemistry knowledge with pharmacokinetics data [90]. The 2010 version of WOMBAT-PK contains 1260 drugs from textbooks, FDA databases and the literature. Data fields relevant to metabolism include systemic clearance, apparent systemic clearance, non-renal clearance, half-life, terminal half-life and phase I metabolizing enzymes. However, these metabolism and clearance data are not available for every drug in the database [258].
DrugBank
DrugBank, from the University of Alberta (Canada) [259], is a well-known free database of 6711 drug compounds in version 3.0 (approved drugs, nutraceuticals and experimental drugs). It links cheminformatics and bioinformatics by including target, metabolizing enzyme and transporter information for each drug. For a subset of the drugs, metabolism data such as half-life and clearance pathways are included, but this information is presented in free text format as extracted from journal articles [91].
AurSCOPE ADME
The AurSCOPE ADME database from Aureus Sciences consists of a set of 40,635 compounds (as of June 2012) collected from the literature, patents, known drugs and new drug applications in the USA and Europe. The metabolism-related properties that are included are binding affinity and kinetic data for various phase I and II enzymes, along with human liver microsome and hepatocyte stability data [260]. Recently, Aureus has collaborated with Institute of Biomedical Chemistry to develop AurPASS, in which the PASS modeling methods are used with the AurSCOPE database to predict a variety of biological activities [261].
Evolvus
The company Evolvus [262], which specializes among other things in chemical data curation, offers a hepatic clearance/microsomal stability dataset, containing, as of May 2010, approximately 5000 compounds tested in humans and other mammalian species. The data have been collected from the recent literature (since 2002).
Other free databases
Freely available resources include two datasets for clearance and half-life, extracted from the Goodman & Gilman textbook [92] and available at QSAR World [263]. The ChEMBL database of bioactivity data at the European Bioinformatics Institute [93,264] contains, in version 14, over 9000 half-life or metabolic stability-related assays from the literature, in particular a relatively large (669 compounds) set of human intravenous administration half-life data [94]. PubChem [66,233] contains two assays from the Conrad Prebys Center for Chemical Genomics at the Sanford-Burnham Medical Research Institute, measuring metabolic stability in human and mouse hepatic microsomes [265,266]. At the time of writing, these assays are set up as placeholders containing one compound each, but a full set of data is planned to be released. These last four resources are discussed in more detail in the accompanying paper [15], where we use them to build QSAR models of half-life in human liver microsomes.
Software
ACD/Percepta
Aside from the databases containing half-life and clearance information, mainly for relatively small sets of known drugs, there are very few publicly available resources useful in the context of metabolic stability predictions. ACD/Percepta [224] has, to our knowledge, the only explicit prediction of half-life in human liver microsomes. It uses a random forest classification model, trained on literature data, with its CYP substrate and regioselectivity predictions (discussed above) as descriptors. Input compounds are classified as ‘stable’, ‘unstable’ or ‘undefined’, where the latter can either mean that the compound is of intermediate stability or that the reliability of the prediction is too low. Users can adjust the range of half-life times that should be considered ‘undefined’.
ADMET Predictor
In ADMET Predictor, the Metabolism Module (discussed in more detail above) can predict Km and Vmax for hydroxylation reactions by five recombinant CYPs (1A2, 2C19, 2C9, 2D6 and 3A4) and converts these into an intrinsic clearance value for each CYP. It can also provide a more general ‘CYP_Risk’ score for a query compound, based on predictions of high clearance by any of the CYPs along with inhibition of 3A4 [213].
MEXAlert
The program MEXAlert from CompuDrug, a simplified, high-throughput version of MetabolExpert (discussed above), can be used to flag compounds that are likely to undergo extensive first-pass metabolism, and thus be rapidly eliminated before reaching the systemic circulation [267]. Rather than an extensive graphical tree of metabolites, MEXAlert produces a simple text table with each input compound flagged as ‘Probable’ or ‘Not Probable’ that it will be metabolized, along with a list of predicted biotransformation reactions.
QikProp
An interesting approach to metabolic stability prediction is found in the program QikProp from Schrödinger, first released in 2000, and developed by the Jorgensen group at Yale University (USA) [268]. QikProp can calculate a descriptor called #metabol, which tests whether an input compound can undergo any of a set of 21 metabolic reactions. The output is a number between 0.0 and 8.0; a higher number indicates that a compound is more likely to be metabolically unstable. The development of this property has not, to our knowledge, been described in any of the publications about QikProp, so it is not clear how well the number of potential reactions a compound can undergo correlates with its actual reactivity or metabolic stability. In a QSAR modeling study on the metabolic stability of calcitriol analogs, using QikProp properties among others, Jensen et al. evaluated several variable selection methods, and found that while the #metabol descriptor was chosen some of the time, it was not ultimately one of the most predictive descriptors [95].
Holes in the bucket
A caveat of all 2D structure-based approaches, such as QSAR models, is the inability to handle enantiomer-specific metabolism. This may not be a big issue as many pairs of stereoisomers are observed to give rise to the same metabolites [45]. However substrate stereochemistry has been known to play an important role in CYP-mediated metabolism. For example, 2C19 is known to catalyze 6- and 8-hydroxylation, but not 4´-hydroxylation of R-warfarin. On the other hand, 2C19 catalyzes 4´-hydroxylation but not 6- and 8-hydroxylation of S-warfarin [96]. Tools that explicitly consider 3D molecular conformations of both the substrate and the proteins are required for predicting stereochemistry-specific metabolism. These tools are much more resource-demanding.
One of the drawbacks to biotransformation prediction methods is that they tend to lump together biotransformation data from different species and tissue types [23,29] (an exception to this is TIMES, though its liver simulator is built on data from humans, rats and dogs [40]). Also, in spite of attempts in each software program to prune the resulting metabolic trees, a great many metabolites are still generated for each input compound, not all of which will be observed experimentally [29]. Because of this, these programs are difficult to apply in a high-throughput fashion. The advantages of biotransformation prediction methods are that, unlike other methods discussed herein, biotransformation prediction methods are not focused on CYPs and so can predict metabolites produced via other metabolizing enzymes. Furthermore, the combinatorial enumeration of metabolites can be useful in the context of identifying the compounds present in mass spectrometry data [29].
The drawbacks of metabolic site prediction methods are that they generally cannot evaluate the reactivity of different molecules relative to one another, only different sites within the same molecule [42]. They also cannot generally predict which specific CYP will metabolize a compound, or even whether or not the input query compound will actually be metabolized, only where it would be metabolized if it were a substrate (exceptions to this are StarDrop, with its composite lability prediction [210], and ADMET Predictor, which prefaces its site predictions with a substrate classification prediction [213]). Metabolic site prediction methods can be useful for optimization of a given lead compound to improve its metabolic stability [2,13], but generally not for selecting a lead compound out of a larger set of screening hits, or for database filtering prior to sample acquisition or synthesis.
Ideally, one would like to be able to predict the rate of metabolism for an input compound, compared with other compounds in the dataset under analysis. Rates of metabolic reactions are important because the extent of metabolism of a compound and which sites are predominantly metabolized is (often) kinetically driven. Rate predictions are also a way of ranking the extent of reactivity of one compound against another, rather than simply ranking the sites within a single compound. In spite of the importance of this parameter, there are very few software packages that address metabolic reaction rates, probably because of a lack of good consistent training data.
There are also very few software tools for predicting CYP induction, and none (to our knowledge) for CYP activation prediction. This is probably a function of the relative newness of this field (the nuclear receptor mechanism for CYP induction was only discovered in 1998 [58]) and of the complexity of the underlying mechanisms, confounding the development of structure-activity relationships.
The prediction of phase II and other non-CYP substrates is another area of metabolism prediction where there is very little publicly available software. This lack of models for predicting substrates and inhibitors of non-CYP metabolism enzymes is concerning, particularly in light of a recent meta-analysis of drug metabolism pathways and metabolites extracted from current literature. Testa et al. found that a full 40% of the reactive toxic metabolites described were quinones and analogs thereof (quinonimines, quinonimides, quinone-diimines) [97]. These can be produced by CYPs but also by peroxidases, an enzyme family that has essentially been neglected in the field of metabolism prediction, and whose tissue distribution and substrate specificity is very different from CYPs. Fortunately, public data on substrates of non-CYP metabolism enzymes are available from the literature, and could be extracted from several of the databases discussed here, including Accelrys Metabolite [201], MetaBase [203] or CTD [246].
Future perspective
It is customary at this point in a review paper on property prediction methods and tools – whether they are metabolism-related or dealing with other properties in the drug design and ADMET areas – to call for more public data and to hope for the sharing of the large proprietary datasets available in pharmaceutical companies, so here we will continue that tradition. The extent to which many of the software programs listed here are based on the same data (from the literature, from the Accelrys Metabolite database [201], from the relatively small set of existing drugs and patented pre-clinical compounds, and most recently from PubChem [233]) is striking. Of course, all developers of publicly available software, be it free, academic or commercial, face the same constraints on data availability. It may be, as observed in the analysis of bioactivity databases by Tiikkainen and Franke at Merz Pharma [98], that the literature data used by different vendors do not overlap all that much, due to different time frames being used for the data extraction and collection. However, in many cases, the data for training sets or dictionary development have been extracted from very old literature. Old data are not necessarily wrong, but are perhaps not fully representative of the new chemistry space being explored in current drug design and discovery work [12]. Older data are also certainly not consistent with newer methods of metabolite detection [99].
Mechanisms for publicly sharing the large proprietary ADMET datasets owned by pharmaceutical companies have been considered. One successful example of this is the non-profit Lhasa, Ltd, developers of Meteor, which has set up a membership program for collaborative work on toxicity and metabolism predictions. Generally, the actual proprietary data points or measurements are not shared between Lhasa members, but the data are used to develop and validate rules for the toxicity and metabolism knowledge bases [100]. The potential for sharing ADMET models, if not data, was also explored in a collaboration between researchers at Pfizer and Collaborative Drug Discovery [101]. Certainly it is not surprising that high-quality QSAR models can be built with open-source descriptors such as those from the Chemistry Development Kit [269] and open-source model-building tools such as R [270] or KNIME [271]. The issue is whether descriptors can be chosen in such as way as to capture aspects of the chemical structure that contribute to its biological properties, without allowing the original structures of compounds in the training set to be reverse engineered [102,103].
In calling for new data and more data, it is also worthwhile to consider what kind of new data would be the most useful. Even the large datasets in big pharmaceutical companies may be narrowly focused on sets of closely related series of analogs, and perhaps not generalizable to other regions of chemical space. It is also not clear to what extent data from different laboratories or different assay protocols can reasonably be combined [104,105]. The screening centers of the NIH Molecular Libraries Program [272] have contributed to this effort by producing assays for several metabolism end points. Some commercial software currently contains QSAR models based on these data, and we expect to see more to come. It is to be hoped that these screening efforts will continue, with PubChem as a central repository, even in the face of funding cuts to the program [106].
Ultimately, in silico models are based on one of the fundamental tenets of pharmacology, that chemically similar molecules should behave in biologically similar ways. The presence of ‘activity cliffs’ in bioactivity SAR data is well known [107,108], but metabolic processes may be particularly susceptible to these effects, as the metabolic fate of a compound depends strongly on a large number of variable factors in the biological system into which it is introduced. For example, a small difference in distribution relative to the liver between two similar compounds could result in a very large difference in metabolic outcome [23]. In addition, there are many variations in metabolic and other ADME responses due to genetic differences between individuals, and within the same individual under different circumstances (e.g., pregnancy or aging) [109]. This suggests that there is a fundamental limit to the predictivity achievable by any structure-based metabolism modeling method, and that that limit may not be very high.
A productive avenue for increasing the usability of in silico modeling would be the improvement of algorithms capable of extracting what signal there is from noisy data, in an extremely rugged activity landscape, without overfitting. Along with this it would be important to have a consistent method for dealing with uncertainty, namely, how to determine what level of confidence to have in model predictions for new individual compounds, and where to draw the line between reasonable and nonsensical predictions.
Executive summary.
-
▪
This review focuses on publicly available databases and software that can be used for in silico prediction of metabolism-related properties.
-
▪
Computational end points for metabolism predictions include regioselectivity, biotransformations, interactions with metabolizing enzymes and metabolic stability.
-
▪
Programs for predicting biotransformations and regioselectivity are highly incestuous and based on many of the same datasets.
-
▪
We tested the programs PASS, StarDrop, isoCYP, MetaDrug, ADMET Predictor, Percepta and VirtualToxLab for predicting interactions with metabolizing enzymes and found, qualitatively, a 60–75% success rate.
-
▪
It is of concern that there is very little publicly available software for predicting phase II and other non-Cyp interactions.
-
▪
Future improvements in modeling metabolism-related properties could be realized with larger sets of consistent experimental data and careful consideration of the limits of model predictivity.
Acknowledgments
This work was supported in part by the Intramural Research Program of NIH, Center for Cancer Research, in part with Federal funds from the Frederick National Laboratory for Cancer Research, National Institutes of Health, under contract HHSN261200800001E, and in part by the US Department of Defense Threat Reduction Agency Grant TMTI0004_09_BH_T.
Footnotes
Publisher's Disclaimer: Disclaimer
The content of this article does not necessarily reflect the views or policies of the US Army, the Department of Defense or the Department of Health and Human Services, nor does mention of trade names, commercial products or organizations imply endorsement by the US Government.
Financial & competing interests disclosure
The authors have no other relevant affiliations or financial involvement with any organization or entity with a financial interest in or financial conflict with the subject matter or materials discussed in the manuscript apart from those disclosed.
No writing assistance was utilized in the production of this manuscript.
References
Papers of special note have been highlighted as:
▪ of interest
- 1.Markey SP. Pathways of drug metabolism. In: Atkinson AJ Jr, Daniels CE, Dedrick RL, Grudzinskas CV, Markey SP, editors. Principles of Clinical Pharmacology. San Diego, CA, USA: Academic Press; 2001. [Google Scholar]
- 2. Gleeson MP, Hersey A, Hannongbua S. In-silico ADME models: a general assessment of their utility in drug discovery applications. Curr. Top. Med. Chem. 2011;11(4):358–381. doi: 10.2174/156802611794480927. ▪ Unflinching look at the current state-of-the-art and the strengths and weaknesses of a variety of ADME modeling methods.
- 3.Monahan BP, Ferguson CL, Killeavy ES, Lloyd BK, Troy J, Cantilena LR., Jr Torsades de pointes occurring in association with terfenadine use. JAMA. 1990;264(21):2788–2790. [PubMed] [Google Scholar]
- 4.Alfaro CL, Piscitelli SC. Drug interactions. In: Atkinson AJ Jr, Daniels CE, Dedrick RL, Grudzinskas CV, Markey SP, editors. Principles of Clinical Pharmacology. San Diego, UK: Academic Press; 2001. [Google Scholar]
- 5. O’Reilly B. Drug pirates make good. Fortune Magazine. 1998 Dec 10; ▪ Entertaining popular account of the terfenadine/fexofenadine debacle and the importance of stereochemistry.
- 6.Sanguinetti MC, Jiang C, Curran ME, Keating MT. A mechanistic link between an inherited and an acquired cardiac arrhythmia: HERG encodes the IKr potassium channel. Cell. 1995;81(2):299–307. doi: 10.1016/0092-8674(95)90340-2. [DOI] [PubMed] [Google Scholar]
- 7.Mitcheson JS, Chen J, Lin M, Culberson C, Sanguinetti MC. A structural basis for drug-induced long QT syndrome. Proc. Natl Acad. Sci. USA. 2000;97(22):12329–12333. doi: 10.1073/pnas.210244497. [DOI] [PMC free article] [PubMed] [Google Scholar]
- 8.Goldman M. Accelerating drug discovery. Drug Discov. Today. 1997;2(9):357–358. [Google Scholar]
- 9.Lloyd AW. Modifying the drug discovery/drug development paradigm. Drug Discov. Today. 1997;2(10):397–398. [Google Scholar]
- 10.Cashman J. Drug discovery and drug metabolism. Drug Discov. Today. 1996;1(5):209–216. [Google Scholar]
- 11.Langowski J, Long A. Computer systems for the prediction of xenobiotic metabolism. Adv. Drug Deliv. Rev. 2002;54(3):407–415. doi: 10.1016/s0169-409x(02)00011-x. [DOI] [PubMed] [Google Scholar]
- 12.van de Waterbeemd H, Gifford E. ADMET in silico modelling: towards prediction paradise? Nat. Rev. Drug Discov. 2003;2(3):192–204. doi: 10.1038/nrd1032. [DOI] [PubMed] [Google Scholar]
- 13.Czodrowski P, Kriegl JM, Scheuerer S, Fox T. Computational approaches to predict drug metabolism. Expert Opin. Drug Metab. Toxicol. 2009;5(1):15–27. doi: 10.1517/17425250802568009. [DOI] [PubMed] [Google Scholar]
- 14.Tarcsay A, Keseru GM. In silico site of metabolism prediction of cytochrome P450-mediated biotransformations. Expert Opin. Drug Metab. Toxicol. 2011;7(3):299–312. doi: 10.1517/17425255.2011.553599. [DOI] [PubMed] [Google Scholar]
- 15.Kirchmair J, Williamson MJ, Tyzack JD, et al. Computational prediction of metabolism: sites, products, SAR, P450 enzyme dynamics, and mechanisms. J. Chem. Inf. Model. 2012;52(3):617–648. doi: 10.1021/ci200542m. [DOI] [PMC free article] [PubMed] [Google Scholar]
- 16.Zakharov1 AV, Peach ML, Sitzmann M, et al. Computational tools and resources for metabolism-related property predictions. 2. Application to prediction of half-life time in human liver microsomes. Future Med. Chem. 2012;4(15):1933–1944. doi: 10.4155/fmc.12.152. [DOI] [PMC free article] [PubMed] [Google Scholar]
- 17.Testa B, Jenner P. The coming of age of drug metabolism: a citation classic commentary. Curr. Contents Life Sci. 1990;33:16. [Google Scholar]
- 18.Testa B, Jenner P. Drug Metabolism: Chemical and Biochemical Aspects. NY, USA: Dekker; 1976. [Google Scholar]
- 19.Madden JC, Cronin MT. Structure-based methods for the prediction of drug metabolism. Expert Opin. Drug Metab. Toxicol. 2006;2(4):545–557. doi: 10.1517/17425255.2.4.545. [DOI] [PubMed] [Google Scholar]
- 20.Kulkarni SA, Zhu J, Blechinger S. In silico techniques for the study and prediction of xenobiotic metabolism: a review. Xenobiotica. 2005;35(10–11):955–973. doi: 10.1080/00498250500354402. [DOI] [PubMed] [Google Scholar]
- 21. T’jollyn H, Boussery K, Mortishire-Smith RJ, et al. Evaluation of three state-of-the-art metabolite prediction software packages (Meteor, MetaSite, and StarDrop) through independent and synergistic use. Drug Metab. Dispos. 2011;39(11):2066–2075. doi: 10.1124/dmd.111.039982. ▪ An attempt to benchmark the predictivity of three programs. Develops sensible metrics for comparing disparate outputs and concludes the programs may be used synergistically.
- 22.Shin YG, Le H, Khojasteh C, Hop CE. Comparison of metabolic soft spot predictions of CYP 3A4, CYP 2C9 and CYP 2D6 substrates using MetaSite and StarDrop. Comb. Chem. High Throughput Screen. 2011;14(9):811–823. doi: 10.2174/138620711796957170. [DOI] [PubMed] [Google Scholar]
- 23.Erhardt P. Drug metabolism data: past and present status. Med. Chem. Res. 1998;8(7–8):400–421. [Google Scholar]
- 24.Hawkins DR. In: Biotransformations: A Survey of the Biotransformations of Drugs and Chemicals in Animals. Hawkins DR, editor. Cambridge, UK: Royal Society of Chemistry; 1988–1996. [Google Scholar]
- 25.Roberts TR, Hutson DH, Jewess PJ. Metabolic Pathways of Agrochemicals. Cambridge, UK: Royal Society of Chemistry; 1998–1999. [Google Scholar]
- 26.Pfeifer S, Gildemeister B, Pöhlmann H, Borchert HH. Biotransformation von Arzneimitteln. Verlag Chemie, Weinheim, Germany: 1977–1983. [Google Scholar]
- 27.Pfeifer S. Pharmacokinetics. Berlin, Germany: VEB Verlag Volk und Gesundheit; 1986–1990. [Google Scholar]
- 28.Borodina Y, Sadym A, Filimonov D, Blinova V, Dmitriev A, Poroikov V. Predicting biotransformation potential from molecular structure. J. Chem. Inf. Comput. Sci. 2003;43(5):1636–1646. doi: 10.1021/ci034078l. [DOI] [PubMed] [Google Scholar]
- 29.Ekins S, Andreyev S, Ryabov A, et al. Computational prediction of human drug metabolism. Expert Opin. Drug Metab. Toxicol. 2005;1(2):303–324. doi: 10.1517/17425255.1.2.303. [DOI] [PubMed] [Google Scholar]
- 30.Darvas F. Prediction of metabolic pathways by logic programming. J. Mol. Graph. 1988;6:80–86. [Google Scholar]
- 31.Klopman G. Artificial intelligence approach to structure-activity studies. Computer automated structure evaluation of biological activity of organic molecules. J. Am. Chem. Soc. 1984;106(24):7315–7321. [Google Scholar]
- 32.Klopman G, Dimayuga M, Talafous J. META. 1. A program for the evaluation of metabolic transformation of chemicals. J. Chem. Inf. Comput. Sci. 1994;34(6):1320–1325. doi: 10.1021/ci00022a014. [DOI] [PubMed] [Google Scholar]
- 33.Talafous J, Sayre LM, Mieyal JJ, Klopman G. META. 2. A dictionary model of mammalian xenobiotic metabolism. J. Chem. Inf. Comput. Sci. 1994;34(6):1326–1333. doi: 10.1021/ci00022a015. [DOI] [PubMed] [Google Scholar]
- 34.Klopman G, Tu M, Talafous J. META. 3. A genetic algorithm for metabolic transform priorities optimization. J. Chem. Inf. Comput. Sci. 1997;37(2):329–334. doi: 10.1021/ci9601123. [DOI] [PubMed] [Google Scholar]
- 35.Greene N, Judson PN, Langowski JJ, Marchant CA. Knowledge-based expert systems for toxicity and metabolism prediction: DEREK, StAR and METEOR. SAR QSAR Environ. Res. 1999;10(2–3):299–314. doi: 10.1080/10629369908039182. [DOI] [PubMed] [Google Scholar]
- 36.Button WG, Judson PN, Long A, Vessey JD. Using absolute and relative reasoning in the prediction of the potential metabolism of xenobiotics. J. Chem. Inf. Comput. Sci. 2003;43(5):1371–1377. doi: 10.1021/ci0202739. [DOI] [PubMed] [Google Scholar]
- 37.Korzekwa KR, Jones JP, Gillette JR. Theoretical studies on cytochrome P-450 mediated hydroxylation: a predictive model for hydrogen atom abstractions. J. Am. Chem. Soc. 1990;112(19):7042–7046. [Google Scholar]
- 38.Jones JP, Mysinger M, Korzekwa KR. Computational models for cytochrome P450: a predictive electronic model for aromatic oxidation and hydrogen atom abstraction. Drug Metab. Dispos. 2002;30(1):7–12. doi: 10.1124/dmd.30.1.7. [DOI] [PubMed] [Google Scholar]
- 39.Cruciani G, Carosati E, De Boeck B, et al. MetaSite: understanding metabolism in human cytochromes from the perspective of the chemist. J. Med. Chem. 2005;48(22):6970–6979. doi: 10.1021/jm050529c. [DOI] [PubMed] [Google Scholar]
- 40.Mekenyan OG, Dimitrov SD, Pavlov TS, Veith GD. A systematic approach to simulating metabolism in computational toxicology. I. The TIMES heuristic modelling framework. Curr. Pharm. Des. 2004;10(11):1273–1293. doi: 10.2174/1381612043452596. [DOI] [PubMed] [Google Scholar]
- 41.Dimitrov SD, Low LK, Patlewicz GY, et al. Skin sensitization: modeling based on skin metabolism simulation and formation of protein conjugates. Int. J. Toxicol. 2005;24(4):189–204. doi: 10.1080/10915810591000631. [DOI] [PubMed] [Google Scholar]
- 42. Sheridan RP, Korzekwa KR, Torres RA, Walker MJ. Empirical regioselectivity models for human cytochromes P450 3A4, 2D6, and 2C9. J. Med. Chem. 2007;50(14):3173–3184. doi: 10.1021/jm0613471. ▪ Notable for including the structures of molecules used in the training sets; also includes a nice comparison of its empirical methods with the first-principles methods of MetaSite.
- 43.Hennemann M, Friedl A, Lobell M, et al. CypScore: Quantitative prediction of reactivity toward cytochromes P450 based on semiempirical molecular orbital theory. Chem Med Chem. 2009;4(4):657–669. doi: 10.1002/cmdc.200800384. [DOI] [PubMed] [Google Scholar]
- 44.Rydberg P, Gloriam DE, Zaretzki J, Breneman C, Olsen L. SMARTCyp: A 2D method for prediction of cytochrome P450-mediated drug metabolism. ACS Med. Chem. Lett. 2010;1(3):96–100. doi: 10.1021/ml100016x. [DOI] [PMC free article] [PubMed] [Google Scholar]
- 45.Rydberg P, Olsen L. Ligand-based site of metabolism prediction for cytochrome P450 2D6. ACS Med. Chem. Lett. 2012;3(1):69–73. doi: 10.1021/ml200246f. [DOI] [PMC free article] [PubMed] [Google Scholar]
- 46.Zaretzki J, Rydberg P, Bergeron C, Bennett KP, Olsen L, Breneman CM. RS-Predictor models augmented with SMARTCyp reactivities: robust metabolic regioselectivity predictions for nine CYP isozymes. J. Chem. Inf. Model. 2012;52(6):1637–1659. doi: 10.1021/ci300009z. [DOI] [PMC free article] [PubMed] [Google Scholar]
- 47.Liu R, Liu J, Tawa G, Wallqvist A. 2D SMARTCyp reactivity-based site of metabolism prediction for major drug-metabolizing cytochrome P450 enzymes. J Chem. Inf. Model. 2012;52(6):1698–1712. doi: 10.1021/ci3001524. [DOI] [PubMed] [Google Scholar]
- 48.Zaretzki J, Bergeron C, Rydberg P, Huang T, Bennett KP, Breneman CM. RS-Predictor: a new tool for predicting sites of cytochrome P450-mediated metabolism applied to CYP 3A4. J. Chem. Inf. Model. 2011;51(7):1667–1689. doi: 10.1021/ci2000488. [DOI] [PMC free article] [PubMed] [Google Scholar]
- 49.Brown CM, Reisfeld B, Mayeno AN. Cytochromes P450: a structure-based summary of biotransformations using representative substrates. Drug Metab. Rev. 2008;40(1):1–100. doi: 10.1080/03602530802309742. [DOI] [PubMed] [Google Scholar]
- 50.Dapkunas J, Sazonovas A, Japertas P. Probabilistic prediction of the human CYP 3A4 and CYP 2D6 metabolism sites. Chem. Biodivers. 2009;6(11):2101–2106. doi: 10.1002/cbdv.200900078. [DOI] [PubMed] [Google Scholar]
- 51.Sazonovas A, Japertas P, Didziapetris R. Estimation of reliability of predictions and model applicability domain evaluation in the analysis of acute toxicity (LD50) SAR QSAR Environ. Res. 2010;21(1):127–148. doi: 10.1080/10629360903568671. [DOI] [PubMed] [Google Scholar]
- 52.Spjuth O, Helmus T, Willighagen EL, et al. Bioclipse: an open source workbench for chemo- and bioinformatics. BMC Bioinform. 2007;8(1):59. doi: 10.1186/1471-2105-8-59. [DOI] [PMC free article] [PubMed] [Google Scholar]
- 53.Carlsson L, Spjuth O, Adams S, Glen RC, Boyer S. Use of historic metabolic biotransformation data as a means of anticipating metabolic sites using MetaPrint2D and Bioclipse. BMC Bioinform. 2010;11:362. doi: 10.1186/1471-2105-11-362. [DOI] [PMC free article] [PubMed] [Google Scholar]
- 54.Boyer S, Arnby CH, Carlsson L, Smith J, Stein V, Glen RC. Reaction site mapping of xenobiotic biotransformations. J. Chem. Inf. Model. 2007;47(2):583–590. doi: 10.1021/ci600376q. [DOI] [PubMed] [Google Scholar]
- 55.Boyer S, Zamora I. New methods in predictive metabolism. J. Comput. Aided Mol. Des. 2002;16(5–6):403–413. doi: 10.1023/a:1020881520931. [DOI] [PubMed] [Google Scholar]
- 56.Li J, Schneebeli ST, Bylund J, Farid R, Friesner RA. IDSite: an accurate approach to predict P450-mediated drug metabolism. J. Chem. Theory Comput. 2011;7(11):3829–3845. doi: 10.1021/ct200462q. [DOI] [PMC free article] [PubMed] [Google Scholar]
- 57.Sherman W, Day T, Jacobson MP, Friesner RA, Farid R. Novel procedure for modeling ligand/receptor induced fit effects. J. Med. Chem. 2005;49(2):534–553. doi: 10.1021/jm050540c. [DOI] [PubMed] [Google Scholar]
- 58.Handschin C, Podvinec M, Meyer UA. In silico approaches, and in vitro and in vivo experiments to predict induction of drug metabolism. Drug News Perspect. 2003;16(7):423–434. doi: 10.1358/dnp.2003.16.7.829354. [DOI] [PubMed] [Google Scholar]
- 59.Lin JH. CYP induction-mediated drug interactions: in vitro assessment and clinical implications. Pharm. Res. 2006;23(6):1089–1116. doi: 10.1007/s11095-006-0277-7. [DOI] [PubMed] [Google Scholar]
- 60.Xu C, Li CY-T, Kong A-NT. Induction of phase I, II and III drug metabolism/transport by xenobiotics. Arch. Pharm. Res. 2005;28(3):249–268. doi: 10.1007/BF02977789. [DOI] [PubMed] [Google Scholar]
- 61.DeLisle RK, Otten J, Rhodes S. In silico modeling of p450 substrates, inhibitors, activators, and inducers. Comb. Chem. High Throughput Screen. 2011;14(5):396–416. doi: 10.2174/138620711795508377. [DOI] [PubMed] [Google Scholar]
- 62.Wienkers LC, Heath TG. Predicting in vivo drug interactions from in vitro drug discovery data. Nat. Rev. Drug Discov. 2005;4(10):825–833. doi: 10.1038/nrd1851. [DOI] [PubMed] [Google Scholar]
- 63.Rendic S. Strategies for more effective and reliable ADME. Expert Opin. Drug Saf. 2004;3(4):379–380. doi: 10.1517/14740338.3.4.379. [DOI] [PubMed] [Google Scholar]
- 64.Rendic S, Di Carlo FJ. Human cytochrome P450 enzymes: a status report summarizing their reactions, substrates, inducers, and inhibitors. Drug Metab. Rev. 1997;29(1–2):413–580. doi: 10.3109/03602539709037591. [DOI] [PubMed] [Google Scholar]
- 65.Rendic S. Summary of information on human CYP enzymes: human P450 metabolism data. Drug Metab. Rev. 2002;34(1–2):383–448. doi: 10.1081/dmr-120001392. [DOI] [PubMed] [Google Scholar]
- 66.Wang Y, Xiao J, Suzek TO, et al. PubChem’s BioAssay Database. Nucleic Acids Res. 2012;40:D400–D412. doi: 10.1093/nar/gkr1132. [DOI] [PMC free article] [PubMed] [Google Scholar]
- 67.Davis AP, Murphy CG, Saraceni-Richards CA, Rosenstein MC, Wiegers TC, Mattingly CJ. Comparative Toxicogenomics Database: a knowledgebase and discovery tool for chemical-gene-disease networks. Nucleic Acids Res. 2009;37:D786–D792. doi: 10.1093/nar/gkn580. [DOI] [PMC free article] [PubMed] [Google Scholar]
- 68.Davis AP, King BL, Mockus S, et al. The Comparative Toxicogenomics Database: update 2011. Nucleic Acids Res. 2011;39:D1067–D1072. doi: 10.1093/nar/gkq813. [DOI] [PMC free article] [PubMed] [Google Scholar]
- 69.Filimonov D, Poroikov V. Probabilistic approaches in activity prediction. In: Varnek A, Tropsha A, editors. Chemoinformatics Approaches to Virtual Screening. Cambridge, UK: Royal Society of Chemistry; 2008. [Google Scholar]
- 70.Poroikov VV, Filimonov DA, Borodina YV, Lagunin AA, Kos A. Robustness of biological activity spectra predicting by computer program PASS for noncongeneric sets of chemical compounds. J. Chem. Inf. Comput. Sci. 2000;40(6):1349–1355. doi: 10.1021/ci000383k. [DOI] [PubMed] [Google Scholar]
- 71.Susnow RG, Dixon SL. Use of robust classification techniques for the prediction of human cytochrome P450 2D6 inhibition. J. Chem. Inf. Comput. Sci. 2003;43(4):1308–1315. doi: 10.1021/ci030283p. [DOI] [PubMed] [Google Scholar]
- 72.Young S, Gombar V, Emptage M, Cariello N, Lambert C. Mixture deconvolution and analysis of Ames mutagenicity data. Chemometrics Intell. Lab. Syst. 2002;60(1–2):5–11. [Google Scholar]
- 73.Bertz RJ, Granneman GR. Use of in vitro and in vivo data to estimate the likelihood of metabolic pharmacokinetic interactions. Clin. Pharmacokinet. 1997;32(3):210–258. doi: 10.2165/00003088-199732030-00004. [DOI] [PubMed] [Google Scholar]
- 74.Manga N, Duffy JC, Rowe PH, Cronin MTD. Structure-based methods for the prediction of the dominant P450 enzyme in human drug biotransformation: consideration of CYP 3A4, CYP 2C9, CYP 2D6. SAR QSAR Environ. Res. 2005;16(1–2):43–61. doi: 10.1080/10629360412331319871. [DOI] [PubMed] [Google Scholar]
- 75.Terfloth L, Bienfait B, Gasteiger J. Ligand-based models for the isoform specificity of cytochrome P450 3A4, 2D6, and 2C9 substrates. J. Chem. Inf. Model. 2007;47(4):1688–1701. doi: 10.1021/ci700010t. [DOI] [PubMed] [Google Scholar]
- 76.Anderson C. A deeper metabolism model. Drug Discovery News. 2007 Nov 14; [Google Scholar]
- 77.Didziapetris R, Dapkunas J, Sazonovas A, Japertas P. Trainable structure-activity relationship model for virtual screening of CYP 3A4 inhibition. J. Comput. Aided Mol. Des. 2010;24(11):891–906. doi: 10.1007/s10822-010-9381-1. [DOI] [PubMed] [Google Scholar]
- 78.Vedani A, Smiesko M, Spreafico M, Peristera O, Dobler M. VirtualToxLab – in silico prediction of the toxic (endocrine-disrupting) potential of drugs, chemicals and natural products. Two years and 2000 compounds of experience: a progress report. ALTEX. 2009;26(3):167–176. doi: 10.14573/altex.2009.3.167. [DOI] [PubMed] [Google Scholar]
- 79.Rossato G, Ernst B, Smiesko M, Spreafico M, Vedani A. Probing small-molecule binding to cytochrome P450 2D6 and 2C9: an in silico protocol for generating toxicity alerts. Chem Med Chem. 2010;5(12):2088–2101. doi: 10.1002/cmdc.201000358. [DOI] [PubMed] [Google Scholar]
- 80.Lill MA, Dobler M, Vedani A. Prediction of small-molecule binding to cytochrome P450 3A4: flexible docking combined with multidimensional QSAR. Chem Med Chem. 2006;1(1):73–81. doi: 10.1002/cmdc.200500024. [DOI] [PubMed] [Google Scholar]
- 81.Vedani A, Dobler M, Lill MA. The challenge of predicting drug toxicity in silico. Basic Clin. Pharmacol. Toxicol. 2006;99(3):195–208. doi: 10.1111/j.1742-7843.2006.pto_471.x. [DOI] [PubMed] [Google Scholar]
- 82.Vedani A, Descloux A-V, Spreafico M, Ernst B. Predicting the toxic potential of drugs and chemicals in silico: a model for the peroxisome proliferator-activated receptor gamma (PPAR gamma) Toxicol. Lett. 2007;173(1):17–23. doi: 10.1016/j.toxlet.2007.06.011. [DOI] [PubMed] [Google Scholar]
- 83.Spreafico M, Smiesko M, Peristera O, Rossato G, Vedani A. Probing small-molecule binding to the liver-X receptor: a mixed-model QSAR study. Mol. Inf. 2010;29(1–2):27–36. doi: 10.1002/minf.200900064. [DOI] [PubMed] [Google Scholar]
- 84.Gleeson MP. Generation of a set of simple, interpretable ADMET rules of thumb. J. Med. Chem. 2008;51(4):817–834. doi: 10.1021/jm701122q. [DOI] [PubMed] [Google Scholar]
- 85.Atkinson AJ., Jr . Clinical pharmacokinetics. In: Atkinson AJ Jr, Daniels CE, Dedrick RL, Grudzinskas CV, Markey SP, editors. Principles of Clinical Pharmacology. San Diego, CA, USA: Academic Press; 2001. [Google Scholar]
- 86.Masimirembwa CM, Bredberg U, Andersson TB. Metabolic stability for drug discovery and development: pharmacokinetic and biochemical challenges. Clin. Pharmacokinet. 2003;42(6):515–528. doi: 10.2165/00003088-200342060-00002. [DOI] [PubMed] [Google Scholar]
- 87.Emoto C, Murayama N, Rostami-Hodjegan A, Yamazaki H. Methodologies for investigating drug metabolism at the early drug discovery stage: prediction of hepatic drug clearance and P450 contribution. Curr. Drug Metab. 2010;11(8):678–685. doi: 10.2174/138920010794233503. [DOI] [PubMed] [Google Scholar]
- 88.Baranczewski P, Stańczak A, Sundberg K, et al. Introduction to in vitro estimation of metabolic stability and drug interactions of new chemical entities in drug discovery and development. Pharmacol. Rep. 2006;58(4):453–472. [PubMed] [Google Scholar]
- 89.Krejsa CM, Horvath D, Rogalski SL, et al. Predicting ADME properties and side effects: the BioPrint approach. Curr. Opin. Drug Discov. Devel. 2003;6(4):470–480. [PubMed] [Google Scholar]
- 90.Olah M, Rad R, Ostopovici L, et al. WOMBAT and WOMBAT-PK: bioactivity databases for lead and drug discovery. In: Schreiber SL, Kapoor TM, Wess G, editors. Chemical Biology: from Small Molecules to Systems Biology and Drug Design. Wenheim, Germany: Wiley-VCH; 2007. [Google Scholar]
- 91.Knox C, Law V, Jewison T, et al. DrugBank 3.0: a comprehensive resource for “omics” research on drugs. Nucleic Acids Res. 2011;39:D1035–D1041. doi: 10.1093/nar/gkq1126. [DOI] [PMC free article] [PubMed] [Google Scholar]
- 92.Hardman JG, Limbird LE, Gilman AG. Goodman and Gilman’s The Pharmacological Basis of Therapeutics (10th Edition) NY, USA: McGraw-Hill; 2001. [Google Scholar]
- 93.Gaulton A, Bellis LJ, Bento AP, et al. ChEMBL: a large-scale bioactivity database for drug discovery. Nucleic Acids Res. 2011;40(D1):D1100–D1107. doi: 10.1093/nar/gkr777. [DOI] [PMC free article] [PubMed] [Google Scholar]
- 94.Obach RS, Lombardo F, Waters NJ. Trend analysis of a database of intravenous pharmacokinetic parameters in humans for 670 drug compounds. Drug Metab. Dispos. 2008;36(7):1385–1405. doi: 10.1124/dmd.108.020479. [DOI] [PubMed] [Google Scholar]
- 95.Jensen BF, Sørensen MD, Kissmeyer A-M, et al. Prediction of in vitro metabolic stability of calcitriol analogs by QSAR. J. Comput. Aided Mol. Des. 2003;17(12):849–859. doi: 10.1023/b:jcam.0000021861.31978.da. [DOI] [PubMed] [Google Scholar]
- 96.Kaminsky LS, Zhang ZY. Human P450 metabolism of warfarin. Pharmacol. Ther. 1997;73(1):67–74. doi: 10.1016/s0163-7258(96)00140-4. [DOI] [PubMed] [Google Scholar]
- 97. Testa B, Pedretti A, Vistoli G. Reactions and enzymes in the metabolism of drugs and other xenobiotics. Drug Discov. Today. 2012;17(11–12):549–560. doi: 10.1016/j.drudis.2012.01.017. ▪ Meta-analysis and overview of the catalysis of biotransformation reactions and the toxicological consequences.
- 98.Tiikkainen P, Franke L. Analysis of commercial and public bioactivity databases. J. Chem. Inf. Model. 2012;52(2):319–326. doi: 10.1021/ci2003126. [DOI] [PubMed] [Google Scholar]
- 99.Hawkins D. Use and value of metabolism databases. Drug Discov. Today. 1999;4(10):466–471. doi: 10.1016/s1359-6446(99)01401-4. [DOI] [PubMed] [Google Scholar]
- 100.Marchant CA, Briggs KA, Long A. In silico tools for sharing data and knowledge on toxicity and metabolism: Derek for Windows, Meteor, and Vitic. Toxicol. Mech. Methods. 2008;18(2–3):177–187. doi: 10.1080/15376510701857320. [DOI] [PubMed] [Google Scholar]
- 101.Gupta RR, Gifford EM, Liston T, et al. Using open source computational tools for predicting human metabolic stability and additional absorption, distribution, metabolism, excretion, and toxicity properties. Drug Metab. Dispos. 2010;38(11):2083–2090. doi: 10.1124/dmd.110.034918. [DOI] [PubMed] [Google Scholar]
- 102.Filimonov D, Poroikov V. Why relevant chemical information cannot be exchanged without disclosing structures. J. Comput. Aided Mol. Des. 2005;19(9–10):705–713. doi: 10.1007/s10822-005-9014-2. [DOI] [PubMed] [Google Scholar]
- 103.Clement OO, Güner OF. Possibilities for transfer of relevant data without revealing structural information. J. Comput. Aided Mol. Des. 2005;19(9–10):731–738. doi: 10.1007/s10822-005-9026-y. [DOI] [PubMed] [Google Scholar]
- 104. Stouch TR, Kenyon JR, Johnson SR, Chen X-Q, Doweyko A, Li Y. In silico ADME/Tox: why models fail. J. Comput. Aided Mol. Des. 2003;17(2–4):83–92. doi: 10.1023/a:1025358319677. ▪ Four illustrative examples of the failure of models to perform as expected in a pharmaceutical drug-discovery environment.
- 105.Fox T, Kriegl JM. Machine learning techniques for in silico modeling of drug metabolism. Curr. Top. Med. Chem. 2006;6(15):1579–1591. doi: 10.2174/156802606778108915. [DOI] [PubMed] [Google Scholar]
- 106.Wadman M. National prescription for drug development. Nat. Biotechnol. 2012;30(4):309–312. doi: 10.1038/nbt.2176. [DOI] [PubMed] [Google Scholar]
- 107.Maggiora GM. On outliers and activity cliffs – why QSAR often disappoints. J. Chem. Inf. Model. 2006;46(4):1535. doi: 10.1021/ci060117s. [DOI] [PubMed] [Google Scholar]
- 108.Guha R. The ups and downs of structure-activity landscapes. Methods Mol. Biol. 2011;672:101–117. doi: 10.1007/978-1-60761-839-3_3. [DOI] [PMC free article] [PubMed] [Google Scholar]
- 109.Flockhart DA. Clinical pharmacogenetics. In: Atkinson AJ Jr, Daniels CE, Dedrick RL, Grudzinskas CV, Markey SP, editors. Principles of Clinical Pharmacology. San Diego, CA, USA: Academic Press; 2001. [Google Scholar]
- 201.Accelrys. Metabolite. http://accelrys.com/products/databases/bioactivity/metabolite.html. [Google Scholar]
- 202.Accelrys. Metabolism. http://web.archive.org/web/20011215121925/ www.accelrys.com/chem_db/metabolism.html.
- 203.GeneGo. MetaBase. www.genego.com/metabase.php. [Google Scholar]
- 204.GeneGo. MetaDrug. www.genego.com/metadrug.php. [Google Scholar]
- 205.CompuDrug. MetabolExpert. www.compudrug.com/?q=node/36. [Google Scholar]
- 206.CompuDrug. Source of metabolic reactions. www.compudrug.com/sites/default/files/filepicker/1/source_of_metabolic_reactions.pdf. [Google Scholar]
- 207.MultiCASE. META. www.multicase.com/products/prod05.htm. [Google Scholar]
- 208.Lhasa Limited. General information about Meteor. www.lhasalimited.org/index.php/meteor. [Google Scholar]
- 209.Optibrium. StarDrop. www.optibrium.com/stardrop. [Google Scholar]
- 210.Optibrium. FAQs: P450 models. www.optibrium.com/community/faq/p450-models. [Google Scholar]
- 211.Simulations Plus. ADMET Predictor. www.simulations-plus.com/Products.aspx?grpID=1&cID=11&pID=13. [Google Scholar]
- 212.Simulations Plus. Structure-to-property prediction. www.simulations-plus.com/Products.aspx?pID=13&mlID=14&lmID=85. [Google Scholar]
- 213.Simulations Plus. Metabolism product module. www.simulations-plus.com/Products.aspx?pID=13&mID=15. [Google Scholar]
- 214.Molecular Discovery. MetaSite. www.moldiscovery.com/soft_metasite.php. [Google Scholar]
- 215.Laboratory of Mathematical Chemistry. TIMES. http://oasis-lmc.org/?section=software&swid=4. [Google Scholar]
- 216.ChemAxon. Metabolizer preview. www.chemaxon.com/products/metabolizerpreview. [Google Scholar]
- 217.Fujitsu Kyushu Systems. ADME database. http://jp.fujitsu.com/group/kyushu/en/services/admedatabase. [Google Scholar]
- 218.FQS Poland. ADME database. www.fqs.pl/chemistry_materials_life_science/products/adme_db. [Google Scholar]
- 219.CAChe Research. Chemical and physical property prediction from electronic properties of molecular surfaces. http://cacheresearch.com/cepos.html [Google Scholar]
- 220.Chemical Computing Group. Molecular Operating Environment. www.chemcomp.com/software.htm. [Google Scholar]
- 221.Accelrys. Pipeline Pilot Overview. http://accelrys.com/products/pipeline-pilot. [Google Scholar]
- 222.University of Copenhagen. SMARTCyp Web Service. www.farma.ku.dk/smartcyp.
- 223.Rensselaer Exploratory Center for Cheminformatics Research. RS-WebPredictor. http://reccr.chem.rpi.edu/Software/RS-WebPredictor.
- 224.ACD/Labs. ACD/Percepta. www.acdlabs.com/products/percepta. [Google Scholar]
- 225.ACD/Labs. ACD/ADME suite. http://web.archive.org/web/20090622115310/ www.acdlabs.com/products/admet/adme.
- 226.ACD/Labs. P450 regioselectivity. www.acdlabs.com/download/app/admet/1006_p450regioselectivity.pdf.
- 227.ACD/Labs. Cytochrome P450 Specificity Module. www.acdlabs.com/download/docs/datasheets/datasheet_cyps.pdf.
- 228.University of Cambridge. MetaPrint2D. www-metaprint2d.ch.cam.ac.uk. [Google Scholar]
- 229.Sourceforge. MetaPrint2D. http://sourceforge.net/projects/metaprint2d. [Google Scholar]
- 230.Bioclipse Wiki. MetaPrint2D. http://wiki.bioclipse.net/index.php?title=MetaPrint2D. [Google Scholar]
- 231.Schrödinger. Prediction of cytochrome P450 sites of metabolism using induced fit docking. https://docs.google.com/file/d/0B-qRWhJqQzmbYmU2YzI5YWEtYjEy00ZmFlLTgwMjAtOTQ5NzA2ODI2ZDYz/edit?hl=en&authkey=CMGttaEK. [Google Scholar]
- 232.Fujitsu. BioFrontier/P450: major functions. http://web.archive.org/web/20070813232709/ www.fqs.pl/life_science/biofrontier/functions.
- 233.National Center for Biotechnology Information. The PubChem Project. http://pubchem.ncbi.nlm.nih.gov.
- 234.National Center for Biotechnology Information. PubChem BioAssay database; AID 410. http://pubchem.ncbi.nlm.nih.gov/assay/assay.cgi?aid=410.
- 235.National Center for Biotechnology Information. PubChem BioAssay database; AID 884. http://pubchem.ncbi.nlm.nih.gov/assay/assay.cgi?aid=884.
- 236.National Center for Biotechnology Information. PubChem BioAssay database; AID 883. http://pubchem.ncbi.nlm.nih.gov/assay/assay.cgi?aid=883.
- 237.National Center for Biotechnology Information. PubChem BioAssay database; AID 899. http://pubchem.ncbi.nlm.nih.gov/assay/assay.cgi?aid=899.
- 238.National Center for Biotechnology Information. PubChem BioAssay database; AID 891. http://pubchem.ncbi.nlm.nih.gov/assay/assay.cgi?aid=891.
- 239.National Center for Biotechnology Information. PubChem BioAssay database; AID 1851. http://pubchem.ncbi.nlm.nih.gov/assay/assay.cgi?aid=1851.
- 240.National Center for Biotechnology Information. PubChem BioAssay database; AID 777. http://pubchem.ncbi.nlm.nih.gov/assay/assay.cgi?aid=777.
- 241.National Center for Biotechnology Information. PubChem BioAssay database; AID 778. http://pubchem.ncbi.nlm.nih.gov/assay/assay.cgi?aid=778.
- 242.National Center for Biotechnology Information. PubChem BioAssay database; AID 2804. http://pubchem.ncbi.nlm.nih.gov/assay/assay.cgi?aid=2804.
- 243.National Center for Biotechnology Information. PubChem BioAssay database; AID 885. http://pubchem.ncbi.nlm.nih.gov/assay/assay.cgi?aid=885.
- 244.National Center for Biotechnology Information. PubChem BioAssay database; AID 1024. http://pubchem.ncbi.nlm.nih.gov/assay/assay.cgi?aid=1024.
- 245.National Center for Biotechnology Information. PubChem BioAssay database; AID 1025. http://pubchem.ncbi.nlm.nih.gov/assay/assay.cgi?aid=1025.
- 246.Mount Desert Island Biological Lab. Comparative Toxicogenomics database. http://ctdbase.org. [Google Scholar]
- 247.GeneXplain. PASS. www.genexplain.com/pass. [Google Scholar]
- 248.Optibrium. FAQs: ADME QSAR models. www.optibrium.com/community/faq/adme-qsar-models. [Google Scholar]
- 249.Evaluate Pharma. Accelrys announces release of software for prediction ADME in early drug discovery. www.evaluatepharma.com/Universal/View.aspx?type=Story&id=20793. [Google Scholar]
- 250.Accelrys. Discovery studio. http://accelrys.com/products/discovery-studio. [Google Scholar]
- 251.Accelrys. ADMET descriptors in discovery studio. http://accelrys.com/products/datasheets/admet-descriptors.pdf. [Google Scholar]
- 252.Accelrys. ADME-Tox component collection. http://accelrys.com/products/pipeline-pilot/component-collections/adme-tox.html. [Google Scholar]
- 253.FQS Poland. ADMEWORKS predictor models. http://www.fqs.pl/chemistry_materials_life_science/products/admeworks_predictor/models. [Google Scholar]
- 254.Molecular Networks. isoCYP – Predictions of the predominant isoform of human cytochrome P450 substrates. www.molecular-networks.com/products/isocyp. [Google Scholar]
- 255.Biograf 3R. VirtualToxLab. www.biograf.ch/index.php?id=projects&subid=virtualtoxlab. [Google Scholar]
- 256.US FDA. Drugs@FDA. www.accessdata.fda.gov/scripts/cder/drugsatfda/index.cfm.
- 257.Cerep. BioPrint profile and services. www.cerep.fr/cerep/users/pages/ProductsServices/bioprintservices.asp. [Google Scholar]
- 258.Sunset Molecular. WOMBAT-PK. www.sunsetmolecular.com/index.php?option=com_content&view=article&id=16&Itemid=11. [Google Scholar]
- 259.Wishart D. DrugBank. www.drugbank.ca. [Google Scholar]
- 260.Aureus Sciences. ADME overview. www.aureus-sciences.com/aureus/web/guest/adme-overview.
- 261.Aureus Sciences. AurPASS. www.aureus-sciences.com/aureus/web/guest/aurpass-overview.
- 262.Evolvus. Microsomal stability database. www.evolvus.com/Products/Databases/MicrosomalStability.html. [Google Scholar]
- 263.Strand Life Sciences. QSAR World. www.qsarworld.com/qsar-datasets.php?mm=5. [Google Scholar]
- 264.EBI. ChEMBL database. www.ebi.ac.uk/chembl. [Google Scholar]
- 265.National Center for Biotechnology Information. PubChem BioAssay database; AID 1940. http://pubchem.ncbi.nlm.nih.gov/assay/assay.cgi?aid=1940.
- 266.National Center for Biotechnology Information. PubChem BioAssay Database; AID 1555. http://pubchem.ncbi.nlm.nih.gov/assay/assay.cgi?aid=1555.
- 267.CompuDrug. MEXAlert. www.compudrug.com/?q=node/37. [Google Scholar]
- 268.Schrödinger. QikProp. www.schrodinger.com/products/14/17. [Google Scholar]
- 269.Sourceforge. Chemistry development kit. http://cdk.sf.net. [Google Scholar]
- 270.Hothorn T. CRAN task view: machine learning and statistical learning. http://cran.r-project.org/web/views/MachineLearning.html.
- 271.KNIME. www.knime.org. [Google Scholar]
- 272.Molecular Libraries Program. Center capabilities. https://mli.nih.gov/mli/mlpcn/mlpcn-probe-production-centers.