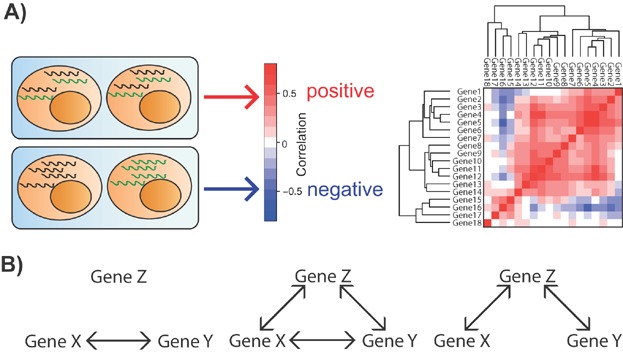
Figure 2.

Transcriptional network analysis from single cell gene expression data. A: Single cell expression data can be used to calculate correlations, which describe the likelihood of two genes being expressed at the same time in the same cell. Positive correlations are shown in red and negative correlations in blue. These data can be shown as heatmaps and used to develop hypotheses about transcriptional regulation. B: Partial correlations can be calculated to determine whether the correlation between two factors, X and Y, is direct (left); due to both being regulated by a third factor, Y (right); or a combination of both (middle). These interactions can be validated experimentally using ChIP-seq to identify TF binding to target loci, and reporter assays to show that binding has an effect on gene expression, as well as using perturbation studies to demonstrate that changing the expression of the direct interactor affects expression of the target gene.
