

Abstract
To date, little is known about the unique contributions of specialized human DC subsets to protection against tuberculosis (TB). Here, we focus on the role of human plasmacytoid (p)DCs and myeloid (m)DCs in the immune response to the TB vaccine bacille Calmette-Guérin (BCG). Ex vivo DC subsets from human peripheral blood were purified and infected with BCG expressing GFP to distinguish between infected and noninfected cells. BDCA-1+ myeloid DCs were more susceptible than BDCA-3+ mDCs to BCG infection. Plasmacytoid DCs have poor phagocytic activity but are equipped with endocytic receptors and can be activated by bystander stimulation. Consequently, the mutual interaction of the two DC subsets in response to BCG was analyzed. We found that pDCs were activated by BCG-infected BDCA-1+ mDCs to upregulate maturation markers and to produce granzyme B, but not IFN-α. Reciprocally, the presence of activated pDCs enhanced mycobacterial growth control by infected mDCs and increased IL-1β availability. The synergy between the two DC subsets promoted BCG-specific CD8+ T-cell stimulation and the role of BCG-infected BDCA-1+ mDCs could not be efficiently replaced by infected BDCA-3+ mDCs in the crosstalk with pDCs. We conclude that mDC–pDC crosstalk should be exploited for rational design of next-generation TB vaccines.
Keywords: Bacille Calmette-Guérin (BCG), BDCA-1+ myeloid DCs, CD8+ T cells, human, plasmacytoid DCs, tuberculosis
Introduction
Tuberculosis (TB) is a global health threat caused by the intracellular bacterial pathogen Mycobacterium tuberculosis (Mtb) [1]. TB is mainly transmitted by the inhalation of aerosol droplets engulfed by macrophages and DCs in the lung [2]. DCs home to draining LNs where they instruct naïve T cells [3]. The balance between mycobacterial persistence and host response determines the degree of infection control. The current TB vaccine is an attenuated form of Mycobacterium bovis termed bacille Calmette-Guérin (BCG). Although this vaccine is effective in controlling disseminated childhood TB, it does not protect against pulmonary disease in all age groups [4, 5]. Reasons for insufficient efficacy of BCG remain incompletely understood but have been associated with inadequate T-cell stimulation, including partial activation of CD4+ T-cell subsets and scanty stimulation of CD8+ T cells [4–6]. DCs are characterized by their ability to sense pathogen-and damage-associated molecular patterns, thereby instructing the innate and adaptive immune response [7]. As critical inducers of T-cell responses, understanding of DCs is salient for rational TB vaccine design. Both human and murine DCs constitute a heterogeneous population that can be segregated into two major subsets: myeloid (m)DCs and plasmacytoid (p)DCs [8, 9].
Among human mDC subsets, BDCA-1+ mDCs engulf bacteria and strongly respond to signals from surface-associated TLRs to bacterial ligands by producing proinflammatory cytokines, or IL-10 but not type I IFN [10, 11]. BDCA-3+ mDCs share numerous functions with mouse CD8α+ DCs. They are specialized to present antigens from necrotic cells by virtue of exclusive expression of Clec9A [12–17]. pDCs possess marginal phagocytic activity and do not respond to TLR2 ligands [18] but they produce abundant type I IFN in response to unmethylated CpG-containing DNA or ssRNA, which are sensed by intracellular TLR9 or TLR7, respectively [19–21]. pDCs are therefore placed in the centre of viral infection. On the other hand, pDCs have been identified in the skin of tuberculin-positive skin test induration [22] and in LNs of TB patients [23] and activation in response to extracellular bacteria has been shown [24]. Finally, despite their high plasticity, mDCs and pDCs display unique and complementary functions for efficacious T-cell stimulation in response to TLRs and pathogens [25–27].
Most of the studies concerning the role of DCs in Mtb infection or BCG vaccination were performed using in vitro generated monocyte-derived DCs [28–31], which have recently been found to be the counterpart of monocyte-related inflammatory DCs [32]. However, little is known about the role of DCs in steady-state conditions.
To better understand the role of physiological human DC subsets in response to BCG vaccination, DCs were isolated ex vivo and infected with BCG. In an attempt to dissect the crosstalk between pDCs and mDCs, we demonstrate that pDCs, after activation through cognate interactions with BCG-infected BDCA-1+ mDCs, induced growth control of BCG and stimulation of BCG-specific CD8+ T cells. This study provides evidence that human pDC–mDC crosstalk should be exploited for improved vaccination strategies against TB.
Results
pDCs are activated by rBCG-infected BDCA-1+ mDCs and enhance BDCA-1+ mDC anti-mycobacterial activity
We quantified BCG uptake by mDCs (sorted as lin−HLA-DR+BDCA-1+) and pDCs (sorted as lin−HLA-DR+BDCA-4+) isolated ex vivo from blood of healthy donors (Supporting Information Fig. 1). DC subsets were infected with GFP-expressing BCG (referred to as recombinant (r)BCG) to facilitate distinction between infected and noninfected cells. mDCs readily engulfed rBCG (43.9% ± (28.1–58.4) (min–max)) (Fig. 1A) and the rate of infection was decreased in the presence of cytochalasin D (an inhibitor of actin polymerization) (Fig. 1B) indicating that mDCs phagocytosed live bacilli. Following infection, mDCs upregulated markers of maturation (CD40), LN homing (CCR7), antigen presentation (HLA-ABC, HLA-DR), costimulation (CD86), and adhesion molecules (Fig. 2A and data not shown). Bystander activation of GFP− mDCs was observed but a minute number of colonies were found among GFP− mDCs (Supporting Information Fig. 2A and B) excluding that GFP− mDCs contained live bacteria. Few GFP+ pDCs were detected after culture with rBCG (0.5% ± (0.2–3.3)) (Fig. 1C) indicating that pDCs failed to efficiently phagocytose live BCG by themselves. pDCs are known to cooperate with mDCs during infections [25–27]. Therefore we assessed whether pDCs could play a similar role in response to BCG. For this purpose, pDCs were added to infected or noninfected mDC cultures and the two subsets were discriminated as CD123high/lowCD11c− and CD123low/−CD11c+, respectively (Fig. 1D). We confirmed the authenticity of the two DC subsets by distinct gene expression transcripts of BDCA-2 (CLEC4C) and BDCA-1 (CD1c) after purification by sorting of CD123high/lowCD11c− and CD123low/−CD11c+ cells (Supporting Information Fig. 3A). The percentage of GFP+ pDCs increased almost fivefold in the presence of rBCG-infected mDCs (1.7% ± (0.4–9.2)) (Fig. 1E, top) but corresponded to less than 10% of total cell numbers. Moreover, negligible mycobacterial colonies were observed in pDCs purified from mono-or co-cultures (Fig. 1F, top). Thus, even in the presence of mDCs, pDCs did not harbor live bacteria. The number of GFP+ mDCs (Fig. 1E, bottom) and the phenotype of mDCs were not influenced by pDCs (Fig. 2A). However, the bacterial growth among rBCG-infected mDCs was significantly reduced when pDCs were present (Fig. 1F, bottom).
Figure 1.
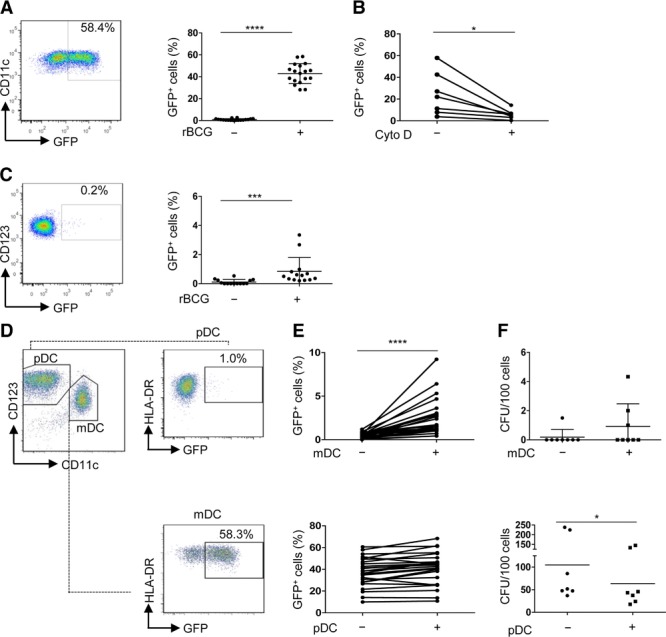
Infection and growth of rBCG in BDCA-1+ mDCs and pDCs. (A) BDCA-1+ myeloid (m)DC cultures (referred to as mDCs) were infected for 2 h (MOI 10) using bacille Calmette–Guérin (BCG) that express GFP [referred to as recombinant (r)BCG], washed extensively and infected cells were visualized as GFP+ cells by flow cytometry 16 h postinfection (p.i.). Bars represent mean of 18 samples pooled from 6 independent experiments. (B) mDCs were treated with cytochalasin D and analyzed 16 h p.i. Each line represents an individual sample (n = 7) pooled from three independent experiments. (C) Percentage of GFP+ plasmacytoid (p)DCs treated as described for mDCs. Bars represent mean of 14 samples pooled from 6 independent experiments (right). (D) In co-culture conditions, nonstimulated pDCs were added to rBCG-infected BDCA-1+ mDC cultures and analyzed after 14 h. pDCs and mDCs were gated as CD123high/lowCD11c− and CD123low/−CD11c+, respectively. Infected cells were visualized as HLA-DR+GFP+ cells. One representative experiment out of 20 is shown. (E) Percentage of GFP+ pDCs (top) and GFP+ mDCs (bottom) after mono-or co-culture is shown. Each line represents an individual sample (n = 25) pooled from eight independent experiments. (F) Bacterial growth of pDCs (sorted as CD123high/low CD11c−) stimulated with rBCG alone (−) or with rBCG-infected mDCs (+) (top) and of mDCs (sorted as GFP+CD123low/−CD11c+), after infection and culture in the presence (+) or absence (−) of uninfected pDCs (bottom) is shown. Each symbol represents individual sample and bars represent mean of eight (top) and seven (bottom) samples pooled from three individual experiments.*p < 0.05, ***p < 0.001, ****p < 0.0001 (Wilcoxon signed-rank test).
Figure 2.

Surface markers of BDCA-1+ mDCs and pDCs. Indicated markers of maturation and adhesion were determined on (A) mDCs and (B) pDCs by flow cytometry after exclusion of doublets and dead cells. MFI obtained after stimulation was normalized to the MFI of the corresponding uninfected monoculture (relative MFI). Box and whiskers plots show the mean, SD and interquartile range (Tukey), and data shown are representative of at least 20 (CD40, HLA-DR, CD123, and CD11c), 6 (CCR7, HLA-ABC, CD2, and CD54) and 3 (CD11a and CD18) independent experiments performed. *p < 0.05 **p < 0.01; ***p < 0.001 (Kruskall–Wallis test).
Phenotypic maturation of pDCs was observed only in the presence of rBCG-infected mDCs but not after mere contact with rBCG (Fig. 2B) and required cell contact between the two DC subsets (Supporting Information Fig. 3B).
These data indicate that mDCs were activated by rBCG directly while pDC activation required rBCG-infected mDCs. Conversely, the presence of pDCs enhanced bacterial growth control in infected mDCs.
Higher abundance of IL-1β protein in the presence of pDCs
To understand how the presence of pDCs promotes bacterial growth control, we analyzed cytokines relevant to mycobacterial infection. Both subsets produced TNF-α and IL-6 (Fig. 3A–D and Supporting Information Fig. 4A and B). Low levels of IL-10 (Fig. 3E) but not IL-12 (data not show) were detected. IL-1β is associated with antimycobacterial functions and higher levels of IL-1β products were detected in infected co-cultures (Fig. 3F). We confirmed that IL-1β expression was restricted to mDCs (Fig. 3G) and corresponded to the mature form (17 kDa) (Supporting Information Fig. 4C). IL-1β gene transcripts were found both in GFP− cells and GFP+ mDCs and their expression was not altered in presence of pDCs (Fig. 3H). Blocking IL-1β increased susceptibility of mDCs to BCG suggesting a role for this cytokine in controlling bacterial growth (Fig. 3I and Supporting Information Fig. 4D and E). Altogether these data indicate that the presence of pDCs promoted IL-1β release by mDCs thereby indirectly helping to contain bacterial growth.
Figure 3.

Cytokine production by mDCs and pDCs after rBCG infection and co-culture. The supernatants in pDC or mDC monocultures or in pDC-BDCA-1+ mDC co-cultures (pDC–mDC) in the absence (–) or presence (+) or rBCG (16 h p.i.) were analyzed for the expression of (A) TNF-α, (C) IL-6, (E) IL-10 (n = 10 samples) and (F) IL-1β (n = 25 samples) by ELISA. Data are shown as mean + SD of data pooled from six independent experiments. (F) Symbols represent results from the same sample. (B, D, and G) Fold changes of (B) TNF-α, (D) IL-6, and (G) IL-1β transcripts of mDCs and pDCs sorted from infected co-cultures (6 h p.i.) are shown as mean + SD of four samples from two pooled experiments. (H) IL-1β transcripts of mDCs in the absence of rBCG (cntr), uninfected (GFP−), and infected (GFP+) mDCs and in the presence (+pDC) or absence (–pDC) of pDCs are shown as mean + SD of six samples from three pooled experiments. Fold changes refer to GFP+ mDC monocultures. (I) Bacterial growth of mDCs (sorted as GFP+CD123low/−CD11c+) after infection and culture with pDCs in the presence (+) or absence (–) of IL-1β blocking antibody. Each line represents an individual sample and data of two pooled experiments are shown. *p < 0.05, **p < 0.001, ****p < 0.0001 (one-way ANOVA).
rBCG-infected mDCs activate GrB+ pDCs
Phenotypic changes on pDCs stimulated us to analyze in more depth the state of activation of pDCs. rBCG-infected co-cultures of pDCs and mDCs contained high concentrations of granzyme B (GrB) (Fig. 4A). Both, neosynthesis and release of GrB were restricted to pDCs (Fig. 4B and C). We exclude that GrB was released by dying (apoptotic/necrotic) DCs in co-culture, since GrB was primarily produced by CD123high pDCs (Supporting Information Fig. 5A, top panel, gate I), which were negative for Annexin V and PI (Supporting Information Fig. 5A, bottom panels, gate I). Apoptotic/necrotic cells were identified among CD123low pDCs and mDCs (Supporting Information Fig. 5A, bottom panel, gate II and III) but those cells produced virtually no GrB (Supporting Information Fig. 5A, top panel, gate II and III). Production of GrB required cell contact (Supporting Information Fig. 5B) and cognate interactions between the two cell types were necessary since less GrB was released after neutralization of CD11a/CD18 (LFA-1) or in the presence of supernatants of rBCG-infected mDCs (<200 pg/mL GrB) (Supporting Information Fig. 5C and D). Inhibition of IL-10 did not affect GrB production (data not shown) excluding that, in this system, IL-10 plays a major role in GrB production. GrB+pDCs were CD123hiCD4+ and expressed low level of CD2 and CD83 but not TRAIL, CD56, or FasL (Fig. 4D and Supporting Information Fig. 5E). Production of perforin and granulysin was absent (Fig. 4D). pDCs maintained the ability to produce high amounts of IFN-α in response to synthetic CpG C (TLR9 agonist) or purified DNA from BCG or Mtb (Fig. 5A). Yet, they did not produce IFN-α after culture with rBCG alone (Fig. 5B) or in the presence of rBCG-infected DCs (Fig. 5C). Blocking of the IFN-αβ receptor (Fig. 5C) and absence of IFNA1 and IFNB gene upregulation (Fig. 5D) confirm that IFN-α was not induced. We conclude that pDCs mainly produced GrB but not type I IFN or any of the described cytotoxic molecules after contact with rBCG-infected mDCs.
Figure 4.

Phenotype of pDCs activated by rBCG-BDCA-1+ mDCs. (A) ELISA for GrB at the indicated conditions of culture and treatment (16 h p.i.). Symbols represent results from the same donor (n = 14). Fold changes of (B) GZMB transcripts of mDCs and pDCs sorted from rBCG-infected co-cultures and of (C) pDCs in the presence (+mDC) or absence (–mDC) of rBCG-infected mDCs (6 h p.i.). Mean + SD of five samples from two pooled experiments are shown. (D) Expression of cytotoxic molecules of pDCs (CD123hiBDCA-2+) after stimulation with rBCG-infected BDCA-1+ mDCs. One experiment out of three is shown. **p < 0.01; ***p < 0.001 (one-way ANOVA).
Figure 5.
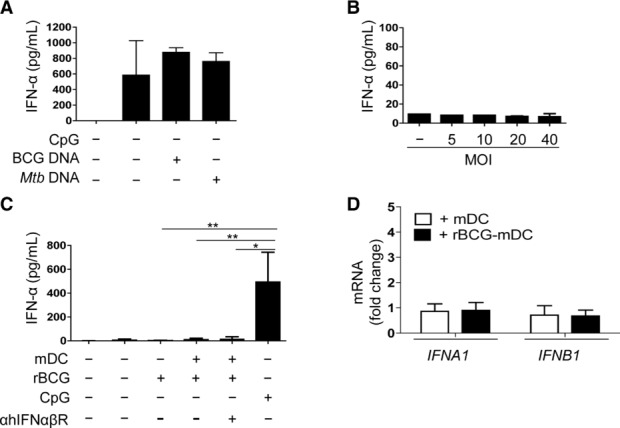
IFN-α production of pDCs in presence of rBCG or rBCG-infected mDCs. ELISA for IFN-α produced by pDCs (A) in the presence of CpG C (CpG), BCG DNA or Mtb DNA (10 μg/mL) 16 h poststimulation (n = 3 samples), or (B) in the presence of rBCG at different MOI, 16 h p.i. (n = 2 samples). Data are shown as mean + SD of two pooled experiments. (C) Elisa for IFN-α produced in mono-or co-culture of pDCs and mDCs in the presence or absence of rBCG (16 h p.i.). Antibody blocking hIFNαβR was added to pDCs 2 h before co-culture with rBCG-infected mDCs (n = 4 samples). Stimulation with synthetic CpG was used as positive control. (D) Fold changes of IFNA1 and IFNB1 mRNA transcripts. pDCs were co-cultured with either noninfected (+ mDC) or rBCG-infected mDCs (+ rBCG-mDC) and sorted as CD123high/lowCD11c− at 4 h poststimulation. Fold changes were referred to BCG–pDC monoculture (n = 3 samples). Data are shown as mean + SD of two pooled experiments. *p < 0.05, **p < 0.01 (Kruskall–Wallis test).
pDCs activated by rBCG-infected mDCs do not induce apoptosis of mDCs
Since pDCs are known to exert tumoricidal and suppressive functions [33–37], we analyzed whether they induced apoptosis of mDCs thereby limiting BCG growth. While pDCs were able to kill K562 cells at 20:1 ratio (Effector:target = pDC:K562) and 24 h of contact (Supporting Information Fig. 6), the number of early and late apoptotic mDCs after infection was not affected by pDCs (Fig. 6A and B). We conclude that scant apoptosis of mDCs occurred apparently independently from direct cytotoxicity of GrB under these conditions.
Figure 6.
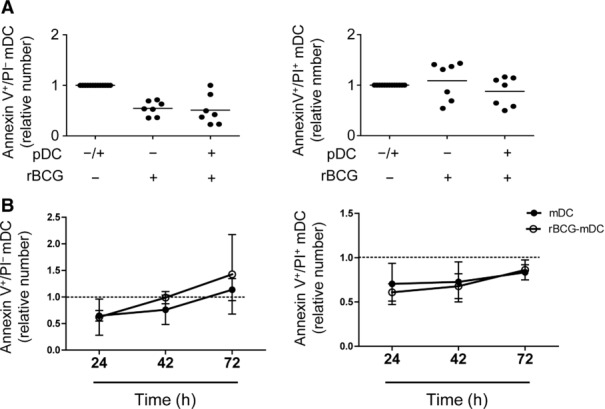
Apoptosis in rBCG-infected mDCs. Relative number of early (Annexin V+ PI−) and late apoptotic (Annexin V+ PI+) mDCs in monocultures or co-cultures with pDCs (pDC-mDC ratio = 1:1) (A) at 16 h p.i. and (B) over time. The percentages of early and late apoptotic mDCs after stimulation were normalized to the percentages of the respective controls (mono-or co-culture in the absence of rBCG, dotted line). Mean ± SD of (A) seven and (B) three independent experiments (Wilcoxon signed-rank test).
rBCG-infected BDCA-1+ mDCs activate pDCs more efficiently than rBCG-infected BDCA-3+ mDCs
We extended our study to the analysis of BDCA-3+ mDCs. BDCA-3+ mDCs were also susceptible to rBCG infection (Fig. 7A and B) albeit to a lower extent than BDCA-1+ mDCs. Lower amounts of IL-1β were detected in both infected mono-(65 ± (4–126) pg/mL, median ± (min–max)), and co-cultures ((64 ± (14–102) pg/mL) compared with that in BDCA-1+ mDCs (295 ± (105–1427 pg/mL). Moreover, rBCG-infected BDCA-3+ mDCs did not trigger GrB production by pDCs as efficiently as BDCA-1+ mDCs (Fig. 7C). Thus pDC activation most likely required unique cell contact signals from BDCA-1+ mDCs with the unique ability to recognize and respond to BCG infection.
Figure 7.
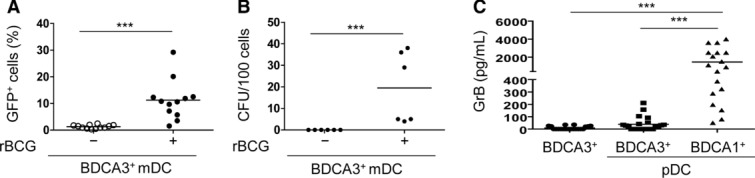
Infection of BDCA-3+ mDCs and activation of GrB+ pDCs. Percentage of (A) GFP+ BDCA-3+ mDCs (n = 12 samples) and (B) bacterial growth (n = 6 samples) measured after isolation of GFP+ BDCA-3+ mDCs (16 h p.i.). (C) ELISA of GrB 16 h p.i. measured in pDC–BDCA-3+ mDC co-cultures or pDC-BDCA-1+ mDC co-cultures (n = 22 samples). Bars represent means of data pooled from six (A, C) and two (B) experiments. ***p < 0.001 (Wilcoxon signed-rank test).
BCG antigen-specific CD8+ T-cell stimulation is enhanced by pDC–mDC crosstalk
We finally determined how mDCs, pDCs, and pDC–mDC co-cultures impact T-cell activation after BCG infection. To this end, we first analyzed priming of naïve CD4+ and CD8+ T cells by DCs. Naïve T cells were purified (Supporting Information Fig. 7A) and their expansion monitored in the presence of rBCG-infected or-uninfected autologous DCs by CFSE dilution (Supporting Information Fig. 7B). Naïve CD4+ T-cell proliferation was not affected by the presence of pDCs (Fig. 8A) while naïve CD8+ T cells proliferated more vigorously in response to rBCG-infected BDCA-1+ mDCs and pDCs (Fig. 8B) but not in response to rBCG-infected BDCA-3+ mDCs alone or in the presence of pDCs (Fig. 8C). T-cell proliferation was not affected by blocking IL-1β with neutralizing Abs (Fig. 8D) and required antigen recognition since it occurred in the presence of rBCG-infected but not with LPS-stimulated, mDCs (Fig. 8E). Higher levels of IFN-γ were detected in the presence of pDCs (Fig. 8F) and correlated with higher numbers of proliferating T cells (pDC–mDC co-cultures: r2 = 0.97, p 0.0009 compared with mDC cultures: r2 = 0.87, p 0.02) (Fig. 8G).
Figure 8.
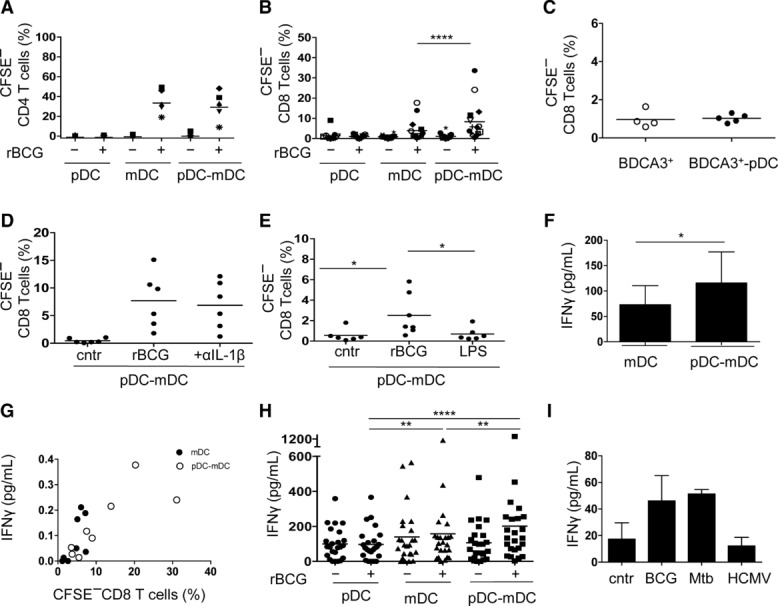
CD8+ T-cell stimulation in response to BCG. Naïve T cells were isolated as CD45RA+IL7RhighCD25− and cultured with infected or uninfected pDCs, mDCs or pDC–mDC cultures. Percentage of (A) CFSElow CD4+ T cells (n = 7 samples) and (B) CFSElow CD8+ T cells (n = 15 samples) after 7 days of culture. (C) Percentage of CFSElow CD8+ T cells after stimulation with rBCG-infected BDCA-3+ alone or pDC-BDCA-3+ mDC co-cultures (n = 4 samples). (D) Percentage of CFSElow CD8+ T cells induced by pDC–mDC co-cultures after infection and in the presence or absence of IL-1β blocking antibody (n = 6 samples). (E) Percentage of CFSElow CD8+ T cells after stimulation with rBCG-infected mDCs (rBCG) or LPS-stimulated mDCs (LPS) (n = 6 samples). Cntr indicates uninfected co-cultures. (F) IFN-γ production of CFSElow CD8+ T cells primed by rBCG-infected mDCs (mDC) alone or in the presence of pDCs (pDC–mDC) (n = 4 samples). (G) Correlation between percentage of CFSElow CD8+ T cells and IFN-γ production after stimulation with infected-mDCs or mDC-pDC co-cultures (n = 8 samples, Spearman rank correlation coefficient). (A–G) Each symbol represents an individual sample. Bars represent means of data of at least three pooled experiments. (H, I) ELISA for IFN-γ measured in different BCG-specific CD8+ T-cell lines stimulated at indicated conditions. Data are shown as mean + SD of (H) 24 samples pooled from 5 independent experiments and (I) two samples pooled from one experiment. *p < 0.05, **p < 0.01, ****p < 0.0001 (Wilcoxon signed-rank test).
To verify influence of pDCs on activated antigen-specific T cells, BCG-specific CD8+ T-cell lines were generated and restimulated with rBCG-infected mDCs alone or in the presence of pDCs. Because of restricted availabilities of DCs from fresh blood, we stimulated T cells using allogeneic DCs from matched HLA-A2 donors. The production of IFN-γ by some CD8+ T-cell lines increased when stimulated with rBCG-infected mDCs in the presence of pDCs compared to mDCs alone or pDC–mDC co-culture controls (Fig. 8H). Subsequently, we used infected autologous DCs and confirmed that BCG-specific T-cell lines responded not only to BCG-infected DCs but also to DCs infected with the pathogen Mtb (Fig. 8I). No response was detected after unrelated DC stimulation (Fig. 8I). We conclude that the crosstalk between pDCs and mDCs promotes BCG-specific CD8+ T-cell activation.
Discussion
The role of human DC subsets in instructing vaccine-induced immunity remains insufficiently understood. We approached this conundrum by dissecting the activation of ex vivo isolated pDCs and mDCs in response to BCG, the current TB vaccine. We found that BDCA-1+ mDCs, but not pDCs, readily phagocytosed rBCG. The pDCs were activated by rBCG-infected mDCs but not by rBCG alone to upregulate markers of maturation and the LN homing chemokine receptor CCR7. The communication between pDCs and mDCs improved control of bacterial growth and enhanced BCG-specific CD8+ T-cell responses. In stark contrast to virus infections [38], activation of pDCs by rBCG-infected mDCs caused prompt secretion of GrB in absence of type I IFN.
Human pDCs have been shown to acquire cytotoxic activity and to produce GrB [34–37, 39]. GrB is traditionally viewed as proapoptotic protease of NK or CD8+ T cells that acts on target cells by perforin-dependent and-independent mechanisms [40]. However, recent evidence suggests that cytotoxic functions of pDCs are primarily mediated by type I IFN in a TRAIL-dependent fashion [35, 41] and require cell contact [36]. In line with these data, in our system we did not detect TRAIL or IFN-α production and pDCs apparently did not directly kill mDCs. This could be explained by the low mDC-pDC ratio used since pDCs could kill K562 cells at higher effector-target ratios. It is possible that this tumor cell line is more su-sceptible to killing by pDCs than by mDCs. Similarly, we did not detect suppression of naïve T-cell proliferation. Cytotoxic functions of pDCs could be more pronounced against allogeneic T cells as shown by other studies [37] than in an autologous system as used here. Granzymes induce proinflammatory cytokine responses [42–44] and extracellular proteolytic activity of granzymes through the RGD domain (Arg-Gly-Asp) has been described [40, 43]. Because we observed higher abundance of IL-1β in infected mDC–pDC co-cultures, we speculate that GrB increased the proinflammatory response against BCG by cleaving target proteases (such as caspases associated with IL-1 activation). Caspase-1 expresses the RGD domain and hence could serve as potential target of GrB [45]. IL-1β signaling exacerbates TB susceptibility in mice [46, 47] and antimicrobial activity of IL-1β is associated with enhanced TNFR-mediated signaling and caspase-dependent regulation of intracellular bacterial growth [48]. In line with this notion, our preliminary data suggested that IL-1β curtails bacterial growth control by mDCs. TNF produced by both pDCs and mDCs could further amplify this pathway. We did not detect a substantial increase in the numbers of apoptotic cells in the presence of pDCs but apoptotic cells were present after infection. Thus we do not exclude that uninfected mDCs engulfed apoptotic cells as described for macrophages or in vitro generated DCs, during TB infection [49, 50].
Cell contact is essential for pDC activation [26, 34] and we obtained evidence for participation of LFA-1 in the induction of GrB, at least during contact with BDCA-1+ mDCs. We exclude a major role for IL-10 presumably because higher concentrations of this cytokine are required for GrB production [37]. Compared with BDCA-1+ mDCs, BDCA-3+ mDCs were less susceptible to BCG infection, induced less GrB-pDC activation and produced lower level of IL-1β. These findings emphasize the notion that activation of pDCs required unique cell–cell signals related to differential expression of bacterial recognition receptors of BDCA-1+ and BDCA-3+ mDCs.
We finally determined the impact of pDCs on T-cell activation. Type I IFNs released by pDCs activate mDCs, thereby modulating CD4+ T-cell response and promoting activation of CD8+ T cells [51–54]. Cross-talk between monocyte-derived DCs and neutrophils has been shown [55]. Here, we propose an immunological crosstalk between mDC and pDC subsets in response to BCG, by which pDCs enhance antigen-specific CD8+ T-cell responses and priming of naïve CD8+ T cells in the absence of IFN-α. Despite some variability in naïve CD8+ T-cell responses and donor heterogeneity, the priming of naïve CD8+ T cells was consistently more efficient after contact of pDCs with BDCA-1+ mDCs than with BDCA-3+ mDCs and was antigen dependent. Our finding does not exclude effects of maturation state, tissue localization, and route of antigen delivery on cross-presentation efficacy of pDC and mDC subsets [56–58] and we do not exclude that DC populations in tissues or LNs can activate pDCs in vivo and better cross-present BCG antigens.
Although BCG vaccination prevents severe childhood TB, it fails to control the most prevalent form, pulmonary TB in all age groups [59]. It is generally assumed that the failure of BCG to protect against pulmonary TB involves insufficient stimulation of CD8+ T cells and restricted duration of immunologic memory [60]. This could be due to an inadequate state of activation of DC subsets and evasion mechanisms exploited by BCG. In addition, continued persistence of BCG organisms after vaccination could induce anergy or exhaustion of T cells. Since the number of pDCs in healthy skin is minute [61], the success of intradermally applied BCG likely depends on spatiotemporal regulatory events. Contact with infected mDCs led pDCs to potentially home to LNs as suggested by CCR7 upregulation, to prime naïve CD8+ T cells in cooperation with mDCs. In addition, pDCs favored accessibility to IL-1β and faster bacterial control. We propose that coordinated activation and recruitment of pDCs in response to BCG vaccination exerts an intrinsic adjuvant function. Thus, means to enhance the antigen-presenting properties of the human DC system involving the pDC–mDC crosstalk should be exploited for future vaccination strategies against TB.
Materials and methods
Ethics statement
Experiments with donor material were approved by the Ethics Committee of the Charité University Hospital (Charité Universitätsmedizin) in Berlin, Germany [EA1/200/08]. Donations received from blood bank donors were anonymized.
Media and reagents
FACS sorting (FACS Aria II, BD) and analysis (LSR II, BD) employed the following antihuman (α-h) antibodies: BDCA-1-FITC, BDCA-4-PE, BDCA-3-allophycocyanin (Miltenyi Biotec); CD3-AlexaFluor700 (UCHT1), CD4-Pacific Blue (RPA-T4), CD11c-AlexaFluor700 (B-ly6), CD14-Pacific Blue (M5E2), CD54-Pe-Cy7 (B159), HLA-DR-PerCP (L243), CCR7-AlexaFluor647 (3D12), Granzyme B-AlexaFluor700 (GB11) and Annexin V-allophycocyanin (BD Biosciences); CD8-BrilliantViolet421 (RPA-T8), CD11a-PerCP (TS2/4), CD18-PE (TS1/18), CD19-Pe-Cy5 (HIB19), CD45RA-AlexaFluor700 (HI100), CD54-PE (HCD54), HLA-ABC-PE (W6/32), and IFN-γ-BrilliantViolet421 (4S.B3) (Biolegend), CD123-eFluor450 (6H6), PI (eBioscience); CD25 FITC-(B1.49.9), CD2-PC7 (39C1.5), CD40-PE (MAB89) and CD127-PE (R34.34) (Beckman Coulter).
Cell isolations
DCs were isolated from buffy coats obtained from the German Red Cross blood bank (DRK-Blutspendedienst Ost) by Ficoll-Hypaque gradient (Biochrom), as described previously [11]. Briefly, DCs were enriched from PBMCs by MACS separation using BDCA-1-FITC, BDCA-4-PE, and BDCA-3-allophycocyanin followed by incubation with FITC-, PE-, and allophycocyanin beads. The positive fraction was stained with lineage markers (lin) (α-CD3, α-CD19, α-CD20, α-CD56, α-CD14), and α-HLA-DR and DCs were further purified by cell sorting according to the following staining: pDCs (lin−HLA-DR+BDCA-4+BDCA-1−BDCA-3−), BDCA-1+ mDCs (lin−HLA-DR+BDCA-4−BDCA-1+BDCA-3−), and BDCA-3+ mDCs (lin−HLA-DR+BDCA-4−BDCA-1−BDCA-3+). Unless otherwise specified, “mDCs” indicate BDCA-1+ mDCs. Naïve CD4+ and CD8+ T cells were enriched using MACS beads (Miltenyi Biotec) followed by sorting according to naïve (CD45RA+CD127highCD25−) markers. Sorted cells with purity higher than 98% were used for experiments.
Cell culture conditions
Cultures were performed using complete RPMI media 1640 (Life Technologies) in the presence of 5% human serum (Lonza) without antibiotics.
DCs were infected for 2 h using BCG (Danish strain) expressing GFP [referred to as recombinant (r)BCG] [62] at an MOI of 10 unless otherwise indicated. External bacteria were removed by extensive washing. In co-culture conditions, unstimulated pDCs were added to rBCG-infected mDC cultures at a 1:1 ratio. Contact was blocked using 96-well plates with a Transwell system (Corning). Blocking αh-CD11a/CD18 (Biolegend) or αh-IFN-αβR antibodies (5 μg/mL) (R&D Systems) were added to pDCs while αh-IL-1β (10 ng/mL) (R&D Systems) were added to rBCG-infected mDCs 2 h before co-culture. TLR4 or TLR9 were activated using 100 ng/mL ultra pure Escherichia coli-purified LPS (Invivogen) or 10 μg/mL type C CpG (ODN 2395, Invivogen), respectively. Genomic DNA from exponentially grown heat-killed mycobacteria (BCG and Mtb) was extracted using phenol/chloroform, purified by two consecutive ethanol precipitations and dissolved in water. Purity was confirmed by a nanodrop spectrophotometer (Thermo Scientific). For inhibition assays, mDCs were treated with 5 μg/mL Cytochalasin D (Sigma), 1 h before infection with rBCG and maintained over time.
Flow cytometric analysis
After stimulation, cells were labeled with α-hCD123 and α-hCD11c antibodies that allow distinction between pDCs (CD123high/lowCD11c−) and mDCs (CD123low/−CD11c+). The maturation of DCs was analyzed by surface staining using α-hCD40, CCR7, HLA-DR, and HLA-ABC. To detect adhesion molecules, α-hCD2, CD54 (ICAM-1), CD18, and CD11a were used. To compare the values of different experiments, the MFI after stimulation was normalized to the MFI of the corresponding unstimulated monoculture (relative MFI). Apoptotic cells were detected as Annexin V+ PI− (early apoptotic cells) or Annexin V+ PI+ (late apoptotic cells). Intracellular GrB was measured after fixation (2% paraformaldehyde) and permeabilization (0.5% saponin-PBS) of cells. Naïve CD4+ and CD8+ T cells were labeled with CFSE according to manufacturer's instructions (Molecular Probes) and proliferation analyzed after 7 days of culture with autologous DCs. CFSE-labeled K562 cells were used for the cytotoxic assay. Analysis was performed using FlowJo (TreeStar).
Bacterial cell growth assay
Cells from mono-or co-cultures were harvested and triplicates of 100 cells were purified by sorting according to pDC (CD123high/lowCD11c−) and rBCG-infected mDC (GFP+ CD123low/−CD11c+) markers. Cells were lysed with 100 μL of 0.1% Triton-X100 in PBS and plated on Middlebrook 7H11 agar. Plates were incubated at 37°C and CFUs were counted after 4 weeks.
Generation of BCG-specific T-cell lines and T-cell assays
CD8+ T cells and monocytes from healthy tuberculin skin test positive donors were purified using cell sorting. CD8+ T cells were added to rBCG-infected monocytes (MOI 10) at a 1:5 (monocyte:T cell) ratio. After 6 days of culture, 0.3–0.5 cells/well were seeded in a 96-well plate in medium containing irradiated (28 Gray) feeder cells, 40 IU/mL rhIL-2 (Peprotech), and 5 μg/mL PHA (phytohemagglutinin, Sigma) for 10 days. Wells showing visible growth were stimulated with irradiated autologous rBCG-infected DCs (MOI 10) and cultured for 7 days. Responding cells were further expanded in medium containing feeder cells, IL-2 and PHA. To assess IFN-γ production, T-cell lines were stimulated (8 h) with pDC or mDC monocultures or pDC–mDC co-cultures previously infected for 16 h with rBCG, M. tuberculosis H37Rv (MOI 10), or HCMV (kindly provided by D. Lilleri and E. Percivalle, IRCCS San Matteo, Pavia, Italy). Naïve CD4+ and CD8+ T cells were stimulated with autologous DCs at a 1:5 ratio (DC subset:T cell).
ELISA
ELISA was performed at 16-h poststimulation (2-h infection and additional 14-h incubation). IFN-α was measured by VeriKine Human Interferon Alpha ELISA Kit (PBL Interferon Source), GrB by PeliKine Compact Human Granzyme B Elisa Kit (Sanquin), IL-1β and IFN-γ by R&D Systems, TNF-α, IL-6 and IL-10 by Ready-SET-Go kit (eBioscience).
RT-PCR
Gene expression levels were analyzed using the 48.48 Dynamic Array Integrated Fluidic Circuits (IFCs) from Fluidigm. After 6 h of cultures (2 h of infection and additional 4 h of incubation), cells were sorted according to pDC (CD123high/lowCD11c−) and mDC (CD123low/−CD11c+) markers and exclusion of dead cells. rBCG-infected mDCs were sorted as GFP+CD123low/−CD11c+ cells. Triplicates of 100 sorted cells were collected in a 96-well PCR plate (Eppendorf) and genes of interest were preamplified on chips using Fluidigm 48.48 IFC Controller MX. Quantitative PCR was performed with Taqman Gene expression Assay (Applied Biosystems) and the BioMark™ HD System (Fluidigm). ΔCt was referred to GAPDH (NM_001256799.1) transcript. Fold change (2−ΔΔCt) in transcripts of IL1B (NM_000576.2), IFNA1 (NM_024013), IFNB1 (NM_002176.2), GZMB (NM_004131.4), TNF (NM_000594.3), and IL6 (NM_000600.3) were calculated relative to infected DC monocultures (GFP+–mDC or BCG–pDC cultures).
Statistical analysis
We performed statistical analysis using Graph Pad Prism 5 Software. Each sample corresponds to a different donor and the number is reported in brackets. Group data were tested for normal distribution (Shapiro–Wilk normality test). Data in more than two groups were analyzed with analysis of variance (ANOVA) followed by a Bonferroni correction for multiple testing. Lines and error bars represent mean ± SD.
Acknowledgments
The authors thank Jenny Kirsch and Toralf Kaiser from the Flow Cytometry Core Facility, Christiane Hübler from the German Red Cross (DRK) blood bank, Chiara Romagnani and Maria Esterhuyse for critical comments, and Mary Louise Grossman for excellent editorial assistance to the authors during preparation of this manuscript. This study was supported in part by the European Union's Seventh Framework Programme (EU FP7) project “NEWTBVAC” (Health-F3-2009-241745).
Glossary
- BCG
bacille Calmette-Guérin
- GrB
granzyme B
- mDC
myeloid mDC
- Mtb
Mycobacterium tuberculosis
- pDC
plasmacytoid pDC
- rBCG
recombinant bacille Calmette-Guérin
- TB
tuberculosis
Conflict of interest
The authors declare no financial or commercial conflict of interest.
Additional supporting information may be found in the online version of this article at the publisher's web-site
References
- 1.WHO. Global Tuberculosis Report 2012. Geneva: WHO Press; 2012. http://www.who.int/tb/publications/global_report/en/ [Google Scholar]
- 2.Urdahl KB, Shafiani S, Ernst JD. Initiation and regulation of T-cell responses in tuberculosis. Mucosal Immunol. 2011;4:288–293. doi: 10.1038/mi.2011.10. [DOI] [PMC free article] [PubMed] [Google Scholar]
- 3.Cooper AM. Cell-mediated immune responses in tuberculosis. Annu. Rev. Immunol. 2009;27:393–422. doi: 10.1146/annurev.immunol.021908.132703. [DOI] [PMC free article] [PubMed] [Google Scholar]
- 4.Colditz GA, Brewer TF, Berkey CS, Wilson ME, Burdick E, Fineberg HV, Mosteller F. Efficacy of BCG vaccine in the prevention of tuberculosis. Meta-analysis of the published literature. JAMA. 1994;271:698–702. [PubMed] [Google Scholar]
- 5.Trunz BB, Fine P, Dye C. Effect of BCG vaccination on childhood tuberculous meningitis and miliary tuberculosis worldwide: a meta-analysis and assessment of cost-effectiveness. Lancet. 2006;367:1173–1180. doi: 10.1016/S0140-6736(06)68507-3. [DOI] [PubMed] [Google Scholar]
- 6.Kaufmann SH. The contribution of immunology to the rational design of novel antibacterial vaccines. Nat. Rev. Microbiol. 2007;5:491–504. doi: 10.1038/nrmicro1688. [DOI] [PubMed] [Google Scholar]
- 7.Banchereau J, Steinman RM. Dendritic cells and the control of immunity. Nature. 1998;392:245–252. doi: 10.1038/32588. [DOI] [PubMed] [Google Scholar]
- 8.Villadangos JA, Schnorrer P. Intrinsic and cooperative antigen-presenting functions of dendritic-cell subsets in vivo. Nat. Rev. Immunol. 2007;7:543–555. doi: 10.1038/nri2103. [DOI] [PubMed] [Google Scholar]
- 9.Heath WR, Carbone FR. Dendritic cell subsets in primary and secondary T cell responses at body surfaces. Nat. Immunol. 2009;10:1237–1244. doi: 10.1038/ni.1822. [DOI] [PubMed] [Google Scholar]
- 10.Kassianos AJ, Hardy MY, Ju X, Vijayan D, Ding Y, Vulink AJ, McDonald KJ, et al. Human CD1c (BDCA-1)(+) myeloid dendritic cells secrete IL-10 and display an immuno-regulatory phenotype and function in response to Escherichia coli. Eur. J. Immunol. 2012;42:1512–1522. doi: 10.1002/eji.201142098. [DOI] [PubMed] [Google Scholar]
- 11.Jarrossay D, Napolitani G, Colonna M, Sallusto F, Lanzavecchia A. Specialization and complementarity in microbial molecule recognition by human myeloid and plasmacytoid dendritic cells. Eur. J. Immunol. 2001;31:3388–3393. doi: 10.1002/1521-4141(200111)31:11<3388::aid-immu3388>3.0.co;2-q. [DOI] [PubMed] [Google Scholar]
- 12.Caminschi I, Proietto AI, Ahmet F, Kitsoulis S, Shin TJ, Lo JC, Rizzitelli A, et al. The dendritic cell subtype-restricted C-type lectin Clec9A is a target for vaccine enhancement. Blood. 2008;112:3264–3273. doi: 10.1182/blood-2008-05-155176. [DOI] [PMC free article] [PubMed] [Google Scholar]
- 13.Haniffa M, Shin A, Bigley V, McGovern N, Teo P, See P, Wasan PS, et al. Human tissues contain CD141hi cross-presenting dendritic cells with functional homology to mouse CD103+ nonlymphoid dendritic cells. Immunity. 2012;37:60–73. doi: 10.1016/j.immuni.2012.04.012. [DOI] [PMC free article] [PubMed] [Google Scholar]
- 14.Jongbloed SL, Kassianos AJ, McDonald KJ, Clark GJ, Ju X, Angel CE, Chen CJ, et al. Human CD141+ (BDCA-3)+ dendritic cells (DCs) represent a unique myeloid DC subset that cross-presents necrotic cell antigens. J. Exp. Med. 2010;207:1247–1260. doi: 10.1084/jem.20092140. [DOI] [PMC free article] [PubMed] [Google Scholar]
- 15.Crozat K, Guiton R, Contreras V, Feuillet V, Dutertre CA, Ventre E, Vu Manh TP, et al. The XC chemokine receptor 1 is a conserved selective marker of mammalian cells homologous to mouse CD8alpha +dendritic cells. J. Exp. Med. 2010;207:1283–1292. doi: 10.1084/jem.20100223. [DOI] [PMC free article] [PubMed] [Google Scholar]
- 16.Poulin LF, Salio M, Griessinger E, Anjos-Afonso F, Craciun L, Chen JL, Keller AM, et al. Characterization of human DNGR-1 +BDCA3+ leukocytes as putative equivalents of mouse CD8alpha+ dendritic cells. J. Exp. Med. 2010;207:1261–1271. doi: 10.1084/jem.20092618. [DOI] [PMC free article] [PubMed] [Google Scholar]
- 17.Bachem A, Guttler S, Hartung E, Ebstein F, Schaefer M, Tannert A, Salama A, et al. Superior antigen cross-presentation and XCR1 expression define human CD11c+CD141+ cells as homologues of mouse CD8+ dendritic cells. J. Exp. Med. 2010;207:1273–1281. doi: 10.1084/jem.20100348. [DOI] [PMC free article] [PubMed] [Google Scholar]
- 18.Kadowaki N, Ho S, Antonenko S, Malefyt RW, Kastelein RA, Bazan F, Liu YJ. Subsets of human dendritic cell precursors express different toll-like receptors and respond to different microbial antigens. J. Exp. Med. 2001;194:863–869. doi: 10.1084/jem.194.6.863. [DOI] [PMC free article] [PubMed] [Google Scholar]
- 19.Colonna M, Trinchieri G, Liu YJ. Plasmacytoid dendritic cells in immunity. Nat. Immunol. 2004;5:1219–1226. doi: 10.1038/ni1141. [DOI] [PubMed] [Google Scholar]
- 20.Gilliet M, Cao W, Liu YJ. Plasmacytoid dendritic cells: sensing nucleic acids in viral infection and autoimmune diseases. Nat. Rev. Immunol. 2008;8:594–606. doi: 10.1038/nri2358. [DOI] [PubMed] [Google Scholar]
- 21.Siegal FP, Kadowaki N, Shodell M, Fitzgerald-Bocarsly PA, Shah K, Ho S, Antonenko S, et al. The nature of the principal type 1 interferon-producing cells in human blood. Science. 1999;284:1835–1837. doi: 10.1126/science.284.5421.1835. [DOI] [PubMed] [Google Scholar]
- 22.Bond E, Liang F, Sandgren KJ, Smed-Sorensen A, Bergman P, Brighenti S, Adams WC, et al. Plasmacytoid dendritic cells infiltrate the skin in positive tuberculin skin test indurations. J. Invest. Dermatol. 2012;132:114–123. doi: 10.1038/jid.2011.246. [DOI] [PMC free article] [PubMed] [Google Scholar]
- 23.Facchetti F, De Wolf-Peeters C, De VR, van den Oord JJ, Pulford KA, Desmet VJ. Plasmacytoid monocytes (so-called plasmacytoid T cells) in granulomatous lymphadenitis. Hum. Pathol. 1989;20:588–593. doi: 10.1016/0046-8177(89)90248-7. [DOI] [PubMed] [Google Scholar]
- 24.Michea P, Vargas P, Donnadieu MH, Rosemblatt M, Bono MR, Dumenil G, Soumelis V. Epithelial control of the human pDC response to extracellular bacteria. Eur. J. Immunol. 2013;43:1264–1273. doi: 10.1002/eji.201242990. [DOI] [PubMed] [Google Scholar]
- 25.Yoneyama H, Matsuno K, Toda E, Nishiwaki T, Matsuo N, Nakano A, Narumi S, et al. Plasmacytoid DCs help lymph node DCs to induce anti-HSV CTLs. J. Exp. Med. 2005;202:425–435. doi: 10.1084/jem.20041961. [DOI] [PMC free article] [PubMed] [Google Scholar]
- 26.Piccioli D, Sammicheli C, Tavarini S, Nuti S, Frigimelica E, Manetti AG, Nuccitelli A, et al. Human plasmacytoid dendritic cells are unresponsive to bacterial stimulation and require a novel type of cooperation with myeloid dendritic cells for maturation. Blood. 2009;113:4232–4239. doi: 10.1182/blood-2008-10-186890. [DOI] [PubMed] [Google Scholar]
- 27.Kuwajima S, Sato T, Ishida K, Tada H, Tezuka H, Ohteki T. Interleukin 15-dependent crosstalk between conventional and plasmacytoid dendritic cells is essential for CpG-induced immune activation. Nat. Immunol. 2006;7:740–746. doi: 10.1038/ni1348. [DOI] [PubMed] [Google Scholar]
- 28.Tailleux L, Schwartz O, Herrmann JL, Pivert E, Jackson M, Amara A, Legres L, et al. DCSIGN is the major Mycobacterium tuberculosis receptor on human dendritic cells. J. Exp. Med. 2002;197:121–127. doi: 10.1084/jem.20021468. [DOI] [PMC free article] [PubMed] [Google Scholar]
- 29.Geijtenbeek TB, van Vliet SJ, Koppel EA, Sanchez-Hernandez M, Vandenbroucke-Grauls CM, Appelmelk B, van Kooyk Y. Mycobacteria target DCSIGN to suppress dendritic cell function. J. Exp. Med. 2003;197:7–17. doi: 10.1084/jem.20021229. [DOI] [PMC free article] [PubMed] [Google Scholar]
- 30.Mazurek J, Ignatowicz L, Kallenius G, Jansson M, Pawlowski A. Mycobacteria-infected bystander macrophages trigger maturation of dendritic cells and enhance their ability to mediate HIV transinfection. Eur. J. Immunol. 2012;42:1192–1202. doi: 10.1002/eji.201142049. [DOI] [PubMed] [Google Scholar]
- 31.Gerosa F, Baldani-Guerra B, Lyakh LA, Batoni G, Esin S, Winkler-Pickett RT, Consolaro MR, et al. Differential regulation of interleukin 12 and interleukin 23 production in human dendritic cells. J. Exp. Med. 2008;205:1447–1461. doi: 10.1084/jem.20071450. [DOI] [PMC free article] [PubMed] [Google Scholar]
- 32.Segura E, Touzot M, Bohineust A, Cappuccio A, Chiocchia G, Hosmalin A, Dalod M, et al. Human inflammatory dendritic cells induce Th17 cell differentiation. Immunity. 2013;38:336–348. doi: 10.1016/j.immuni.2012.10.018. [DOI] [PubMed] [Google Scholar]
- 33.Stary G, Bangert C, Tauber M, Strohal R, Kopp T, Stingl G. Tumoricidal activity of TLR7/8-activated inflammatory dendritic cells. J. Exp. Med. 2007;204:1441–1451. doi: 10.1084/jem.20070021. [DOI] [PMC free article] [PubMed] [Google Scholar]
- 34.Matsui T, Connolly JE, Michnevitz M, Chaussabel D, Yu CI, Glaser C, Tindle S, et al. CD2 distinguishes two subsets of human plasmacytoid dendritic cells with distinct phenotype and functions. J. Immunol. 2009;182:6815–6823. doi: 10.4049/jimmunol.0802008. [DOI] [PMC free article] [PubMed] [Google Scholar]
- 35.Kalb ML, Glaser A, Stary G, Koszik F, Stingl G. TRAIL(+) human plasmacytoid dendritic cells kill tumor cells in vitro: mechanisms of imiquimod-and IFN-alpha-mediated antitumor reactivity. J. Immunol. 2012;188:1583–1591. doi: 10.4049/jimmunol.1102437. [DOI] [PubMed] [Google Scholar]
- 36.Tel J, Smits EL, Anguille S, Joshi RN, Figdor CG, de Vries IJ. Human plasmacytoid dendritic cells are equipped with antigen-presenting and tumoricidal capacities. Blood. 2012;120:3936–3944. doi: 10.1182/blood-2012-06-435941. [DOI] [PubMed] [Google Scholar]
- 37.Jahrsdorfer B, Vollmer A, Blackwell SE, Maier J, Sontheimer K, Beyer T, Mandel B, et al. Granzyme B produced by human plasmacytoid dendritic cells suppresses T-cell expansion. Blood. 2010;115:1156–1165. doi: 10.1182/blood-2009-07-235382. [DOI] [PMC free article] [PubMed] [Google Scholar]
- 38.Cella M, Jarrossay D, Facchetti F, Alebardi O, Nakajima H, Lanzavecchia A, Colonna M. Plasmacytoid monocytes migrate to inflamed lymph nodes and produce large amounts of type I interferon. Nat. Med. 1999;5:919–923. doi: 10.1038/11360. [DOI] [PubMed] [Google Scholar]
- 39.Facchetti F, Vermi W, Mason D, Colonna M. The plasmacytoid monocyte/interferon producing cells. Virchows Arch. 2003;443:703–717. doi: 10.1007/s00428-003-0918-8. [DOI] [PubMed] [Google Scholar]
- 40.Chowdhury D, Lieberman J. Death by a thousand cuts: granzyme pathways of programmed cell death. Annu. Rev. Immunol. 2008;26:389–420. doi: 10.1146/annurev.immunol.26.021607.090404. [DOI] [PMC free article] [PubMed] [Google Scholar]
- 41.Drobits B, Holcmann M, Amberg N, Swiecki M, Grundtner R, Hammer M, Colonna M, et al. Imiquimod clears tumors in mice independent of adaptive immunity by converting pDCs into tumor-killing effector cells. J. Clin. Invest. 2012;122:575–585. doi: 10.1172/JCI61034. [DOI] [PMC free article] [PubMed] [Google Scholar]
- 42.Metkar SS, Menaa C, Pardo J, Wang B, Wallich R, Freudenberg M, Kim S, et al. Human and mouse granzyme A induce a proinflammatory cytokine response. Immunity. 2008;29:720–733. doi: 10.1016/j.immuni.2008.08.014. [DOI] [PubMed] [Google Scholar]
- 43.Afonina IS, Tynan GA, Logue SE, Cullen SP, Bots M, Luthi AU, Reeves EP, et al. Granzyme B-dependent proteolysis acts as a switch to enhance the proinflammatory activity of IL-1alpha. Mol. Cell. 2011;44:265–278. doi: 10.1016/j.molcel.2011.07.037. [DOI] [PMC free article] [PubMed] [Google Scholar]
- 44.Spencer CT, Abate G, Sakala IG, Xia M, Truscott SM, Eickhoff CS, Linn R, et al. Granzyme A produced by gamma(9)delta(2) T cells induces human macrophages to inhibit growth of an intracellular pathogen. PLoS Pathog. 2013;9:e1003119. doi: 10.1371/journal.ppat.1003119. [DOI] [PMC free article] [PubMed] [Google Scholar]
- 45.Shi L, Chen G, MacDonald G, Bergeron L, Li H, Miura M, Rotello RJ, et al. Activation of an interleukin 1 converting enzyme-dependent apoptosis pathway by granzyme B. Proc. Natl. Acad. Sci. USA. 1996;93:11002–11007. doi: 10.1073/pnas.93.20.11002. [DOI] [PMC free article] [PubMed] [Google Scholar]
- 46.Fremond CM, Togbe D, Doz E, Rose S, Vasseur V, Maillet I, Jacobs M, et al. IL-1 receptor-mediated signal is an essential component of MyD88-dependent innate response to Mycobacterium tuberculosis infection. J. Immunol. 2007;179:1178–1189. doi: 10.4049/jimmunol.179.2.1178. [DOI] [PubMed] [Google Scholar]
- 47.Mayer-Barber KD, Barber DL, Shenderov K, White SD, Wilson MS, Cheever A, Kugler D, et al. Caspase-1 independent IL-1beta production is critical for host resistance to mycobacterium tuberculosis and does not require TLR signaling in vivo. J. Immunol. 2010;184:3326–3330. doi: 10.4049/jimmunol.0904189. [DOI] [PMC free article] [PubMed] [Google Scholar]
- 48.Jayaraman P, Sada-Ovalle I, Nishimura T, Anderson AC, Kuchroo VK, Remold HG, Behar SM. IL-1beta promotes antimicrobial immunity in macrophages by regulating TNFR signaling and caspase-3 activation. J. Immunol. 2013;190:4196–4204. doi: 10.4049/jimmunol.1202688. [DOI] [PMC free article] [PubMed] [Google Scholar]
- 49.Martin CJ, Booty MG, Rosebrock TR, Nunes-Alves C, Desjardins DM, Keren I, Fortune SM, et al. Efferocytosis is an innate antibacterial mechanism. Cell Host Microbe. 2012;12:289–300. doi: 10.1016/j.chom.2012.06.010. [DOI] [PMC free article] [PubMed] [Google Scholar]
- 50.Winau F, Weber S, Sad S, de Diego J, Hoops SL, Breiden B, Sandhoff K, et al. Apoptotic vesicles crossprime CD8 T cells and protect against tuberculosis. Immunity. 2006;24:105–117. doi: 10.1016/j.immuni.2005.12.001. [DOI] [PubMed] [Google Scholar]
- 51.Le Bon A, Etchart N, Rossmann C, Ashton M, Hou S, Gewert D, Borrow P, et al. Cross-priming of CD8+ T cells stimulated by virus-induced type I interferon. Nat. Immunol. 2003;4:1009–1015. doi: 10.1038/ni978. [DOI] [PubMed] [Google Scholar]
- 52.Santini SM, Lapenta C, Logozzi M, Parlato S, Spada M, Di PT, Belardelli F. Type I interferon as a powerful adjuvant for monocyte-derived dendritic cell development and activity in vitro and in Hu-PBLSCID mice. J. Exp. Med. 2000;191:1777–1788. doi: 10.1084/jem.191.10.1777. [DOI] [PMC free article] [PubMed] [Google Scholar]
- 53.Tough DF, Borrow P, Sprent J. Induction of bystander T cell proliferation by viruses and type I interferon in vivo. Science. 1996;272:1947–1950. doi: 10.1126/science.272.5270.1947. [DOI] [PubMed] [Google Scholar]
- 54.Takagi H, Fukaya T, Eizumi K, Sato Y, Sato K, Shibazaki A, Otsuka H, et al. Plasmacytoid dendritic cells are crucial for the initiation of inflammation and T cell immunity in vivo. Immunity. 2011;35:958–971. doi: 10.1016/j.immuni.2011.10.014. [DOI] [PubMed] [Google Scholar]
- 55.Morel C, Badell E, Abadie V, Robledo M, Setterblad N, Gluckman JC, Gicquel B, et al. Mycobacterium bovis BCG-infected neutrophils and dendritic cells cooperate to induce specific T cell responses in humans and mice. Eur. J. Immunol. 2008;38:437–447. doi: 10.1002/eji.200737905. [DOI] [PubMed] [Google Scholar]
- 56.Segura E, Durand M, Amigorena S. Similar antigen cross-presentation capacity and phagocytic functions in all freshly isolated human lymphoid organ-resident dendritic cells. J. Exp. Med. 2013;210:1035–1047. doi: 10.1084/jem.20121103. [DOI] [PMC free article] [PubMed] [Google Scholar]
- 57.Cohn L, Chatterjee B, Esselborn F, Smed-Sorensen A, Nakamura N, Chalouni C, Lee BC, et al. Antigen delivery to early endosomes eliminates the superiority of human blood BDCA3+ dendritic cells at cross presentation. J. Exp. Med. 2013;210:1049–1063. doi: 10.1084/jem.20121251. [DOI] [PMC free article] [PubMed] [Google Scholar]
- 58.Tel J, Schreibelt G, Sittig SP, Mathan TS, Buschow SI, Cruz LJ, Lambeck AJ, et al. Human plasmacytoid dendritic cells efficiently cross-present exogenous Ags to CD8+ T cells despite lower Ag uptake than myeloid dendritic cell subsets. Blood. 2013;121:459–467. doi: 10.1182/blood-2012-06-435644. [DOI] [PubMed] [Google Scholar]
- 59.Kaufmann SH, Hussey G, Lambert PH. New vaccines for tuberculosis. Lancet. 2010;375:2110–2119. doi: 10.1016/S0140-6736(10)60393-5. [DOI] [PubMed] [Google Scholar]
- 60.Kaufmann SH. Tuberculosis vaccine development: strength lies in tenacity. Trends Immunol. 2012;33:373–379. doi: 10.1016/j.it.2012.03.004. [DOI] [PubMed] [Google Scholar]
- 61.Zaba LC, Fuentes-Duculan J, Steinman RM, Krueger JG, Lowes MA. Normal human dermis contains distinct populations of CD11c+BDCA-1+ dendritic cells and CD163+FXIIIA+ macrophages. J. Clin. Invest. 2007;117:2517–2525. doi: 10.1172/JCI32282. [DOI] [PMC free article] [PubMed] [Google Scholar]
- 62.Kremer L, Baulard A, Estaquier J, Poulain-Godefroy O, Locht C. Green fluorescent protein as a new expression marker in mycobacteria. Mol. Microbiol. 1995;17:913–922. doi: 10.1111/j.1365-2958.1995.mmi_17050913.x. [DOI] [PubMed] [Google Scholar]
Associated Data
This section collects any data citations, data availability statements, or supplementary materials included in this article.