Abstract
The K-ras gene is frequently mutated in lung and other cancers. K-ras protein includes two splice variants, K-ras 4A and 4B. While K-ras 4B is more widely expressed, recent evidence implicates K-ras 4A in lung tumorigenesis. We found that K-ras 4A protein has a wide range of expression in a large panel of human lung adenocarcinoma cell lines. In cell lines with mutant K-ras, but not those with wildtype K-ras, the K-ras 4A protein had a strong positive correlation with levels of cellular superoxide. We investigated whether K-ras 4A protein was involved in superoxide production, or alternatively was modulated by elevated superoxide. Experiments with small interfering RNA targeting K-ras 4A did not confirm its role in superoxide generation. However, decreasing cellular superoxide with the scavenger Tiron tended to reduce levels of K-ras 4A protein. K-ras 4A and 4B mRNA were also quantified in a number of NSCLC cell lines. 4A mRNA correlated with 4A protein only in K-ras-mutant cells. K-ras 4A mRNA also correlated with superoxide, but with no difference between cell lines with mutant or wildtype K-ras. K-ras 4B mRNA correlated with 4A mRNA and with superoxide, in both K-ras mutant and wildtype cells. The results are consistent with superoxide directly or indirectly up-regulating expression of all K-ras genes, and also increasing the stability of K-ras 4A mutant protein selectively.
Keywords: K-ras 4A, lung, adenocarcinoma, superoxide, mutant K-ras, cell lines, siRNA
Introduction
K-ras protein has two distinct isoforms, K-ras 4A and 4B, which result from alternate splicing and differ mainly at the carboxyl terminal hypervariable region; mutations at codons 12 and 13, common in some human cancers, affect both isoforms. K-ras 4B is more widely expressed [1,2]; is necessary for embryonic development, whereas K-ras 4A is not [3]; and does not affect lifespan or spontaneous tumor incidence in mice [4]. In some situations, K-ras 4A was found to be pro-apoptotic [4] or tumor suppressive [5]. For these reasons K-ras 4B has often been the main focus of attention. Recently, however, in mouse lung K-ras 4A was implicated in tumor initiation [6] and development [7]. Increased K-ras 4A/4B ratios in mouse lung correlated with susceptibility to lung tumorigenesis [1]. Cell culture studies also indicated enhanced oncogenic properties for K-ras 4A: transfected into NIH3T3 fibroblasts, Rat-1 fibroblasts, or RIE-1 epithelial cells, K-ras 4A was much more efficient in inducing transformed foci than 4B [8]. K-ras 4A, but not 4B, enabled anchorage independent growth of RIE-1.
Since K-ras is often mutated in lung adenocarcinomas, the expression of K-ras 4A in these cancers is of interest. We have quantified expression of K-ras 4A protein and mRNA in a panel of human lung adenocarcinoma cell lines with either wildtype or mutant K-ras. We also examined the relationships between K-ras 4A protein, mRNA, and superoxide levels in these cells, since a previous study demonstrated a positive relationship between total K-ras protein and superoxide [9]. The results suggest that superoxide may regulate levels of mutant K-ras 4A protein as well as all species of K-ras mRNA.
Methods
Cell culture
Lung adenocarcinoma cell lines, obtained from ATCC (Manassas, VA), included H23, H441, H460, A549, H1355, H1373, H1734, H1792, H1944, H2030, and H2122 with mutant K-ras and H322, H1395, H1703, and H2126 with wildtype K-ras. A table of the characteristics of these cell lines may be found in [9]. Immortalized nontransformed HPL cells were obtained directly from Drs. A. Masuda and T. Takahashi. These are nonmalignant and derived from normal human peripheral lung epithelium, having characteristics of both alveolar type II and Clara cells, and grown as described in [10]. All other cells were grown in RPMI 1640 growth media (Quality Biological, Gaithersburg, MD) plus fetal bovine serum (10% v/v), 364 μM glutamine, penicillin (90.9 units/ml), and streptomycin (90.9 μg/ml). Cells were grown at 37° C in a humidified cell culture incubator (7% CO2 concentration). Proliferating cells were used, at 70-80% confluence. Cells were scraped into lysis buffer containing 25 mM HEPES, pH 7.5, 1 mM EDTA, 10 mM MgCl2, 1% NP-40 (nonyl phenoxypolyethoxylethanol, USB, Cleveland, OH), 0.25% sodium deoxycholate, 150 mM NaCl, 10% glycerol (Invitrogen, Carlsbad, CA) 1 mM phenylmethylsulfonyl fluoride, 0.2 TIU/ml aprotinin, 10 mM NaF, and 0.2 mM sodium orthovanadate. Unless noted otherwise above, chemicals were obtained from Sigma Chemical Company (St. Louis, MO).
siRNA treatment
Cells were seeded at 4-6 × 10⁵ cells per well in 6 well plates containing 2.3 ml of media. K-ras 4A was silenced using a proprietary mixture of several siRNAs obtained from Santa Cruz Biotechnology (Santa Cruz, CA), product number sc-43874. A 5 nM concentration of siRNA was found to produce the maximum degree of K-ras 4A silencing. The transfection reagent (HiPerFect) and nonsilencing siRNA (AllStars negative control siRNA) were obtained from Qiagen (Germantown, MD). Cells were treated with siRNA for 72 hours.
Superoxide measurement and scavenging
Methods for determination of superoxide using nitroblue tetrazolium (NBT) reduction were reported previously [9]. Intracellular superoxide concentrations were reduced by incubating the cells in media with 2 to 5 mM Tiron (4,5-dihydroxy-1,3-benzene-disulfonic acid), Sigma-Aldrich, St. Louis, MO. Cells were treated with Tiron for 72 hours prior to collection.
Protein immunoblotting
Either tris-glycine or bis-tris NuPage 12% polyacrylamide gels (Invitrogen) were used to separate proteins. Gels were run with both BenchMark and MagicMark XP protein standards (Invitrogen, Carlsbad, CA). Running buffer was either 25 mM Tris-base, 192 mM glycine with 0.1% SDS for tris-glycine gels or MES NuPage buffer (Invitrogen) for Nupage bis-tris gels. Voltage was 120 V for 1.5 to 2h. Gels were electro blotted on to a PVDF membrane for 1.5 to 2 h at 30 V using Towbin's transfer buffer (12 mM Tris-base, 96 mM glycine and 20% methanol) or NuPage transfer buffer with 20% methanol added.
Blots were blocked with 5% dry milk in PBS-T (phosphate buffered saline with 0.1% Tween 20) for 1.5 h. After blocking, blots were rinsed and incubated with a specific K-ras 4A antibody (product # sc-522, Santa Cruz Biotechnology), diluted 1:200 in 3% milk/PBS-T overnight at 4° C. Following 6 rinses with PBS-T over 60 minutes, the blot was incubated with an anti-rabbit secondary antibody coupled to horseradish peroxidase (GE Healthcare UK Ltd., Buckinghamshire, UK) diluted 1:1000 for 1 h at room temperature. After rinsing as above, the blot was treated with ECL reagent (GE Healthcare UK, Ltd, Buckinghamshire, UK) and exposed to X-ray film for 10 s to 10 min.
After three 1-2 min rinses with PBS-T, blots were incubated with a β-actin antibody (# ab8227-50, Abcam, Cambridge, MA) diluted 1:2.5 × 10⁵ for 2 h at room temperature. Following three 15 min rinses in PBS-T, the blot was treated with a rabbit secondary antibody and ECl signal was detected as above. For determination of comparative K-ras 4A protein values from different cell lines by Western blotting, individual densitometric values were compared to the mean densitometric value of two H441 standards on each blot.
Quantitative real time RT PCR
Total RNA was collected using an RNeasy Mini Kit (Qiagen). For K-ras 4A and 4B mRNA analysis, complementary DNA (cDNA) was synthesized using the Omniscript Reverse Transcriptase Kit (Qiagen). SYBR Green Supermix (Bio-Rad, Hercules, CA, USA) was used for real-time PCR applications. The RT primer for K-ras 4A mRNA had sequence 5'-ATCATCAACACCCAGATTAC-3' (nucleotides +768 to + 749 relative to transcription start site). For the K-ras 4B, the primer sequence was 5'-CATCATCAACACCCTGTC-3' (nucleotides +645 to +628). PCR primers for amplification of either K-ras 4A or 4B cDNAs had sequences 5'-GAGGCCTGCTGAAAATGACTG-3' (upstream, +169 to +189) and 5'-TTCGTCCACAAAATGATTCTGA-3' (+275 to +254, downstream). GAPDH was used as an internal standard. The GAPDH RT primer had sequence 5'-GCAGGGGAGATTCAGTGTG-3'. PCR primers to amplify GAPDH cDNA were 5'- GTGAAGGTCGGAGTCAACGGAT-3' (upstream) and 5'-CATGGGTGGAATCATATTGGAACA-3' (downstream). Quantitative analysis was performed using the Opticon Monitor 3.1 software (Bio-Rad). Relative intensity of K-ras to GAPDH was calculated using the delta Ct value, to facilitate comparison between cell lines.
Statistical analysis
Statistical analysis utilized GraphPad InStat 3 (www.graphpad.com). Results were considered statistically significant at P < 0.05. Comparisons among multiple averages utilized the Kruskal-Wallis non-parametric ANOVA followed by Dunn's multiple comparisons test for pairwise comparisons. Other statistical comparisons were made as described in the figure legends. For correlations, the Pearson correlation values were calculated.
Results
K-ras 4A protein correlated with superoxide in cell lines with mutant K-ras
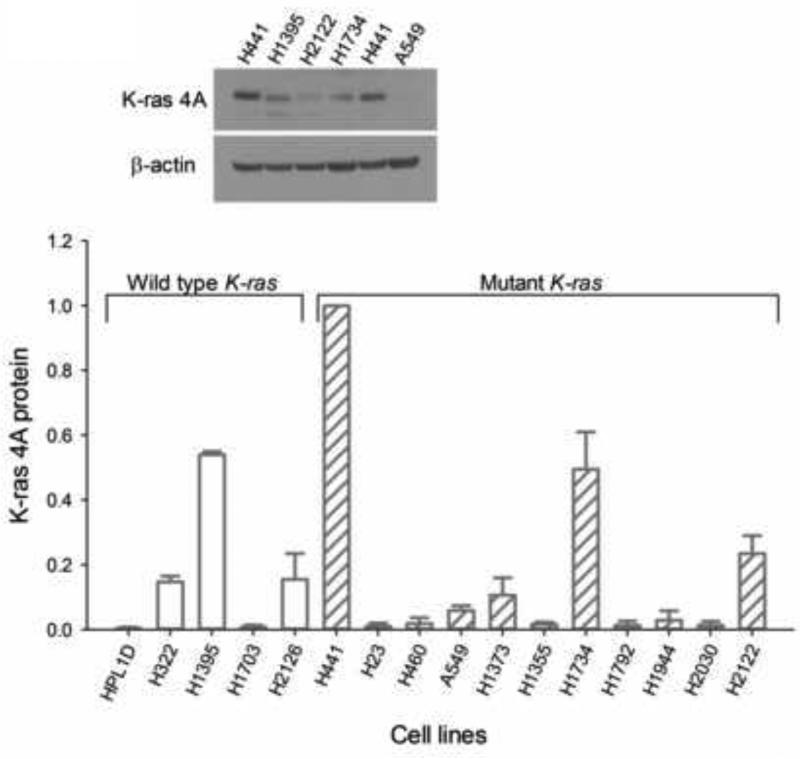
Two determinations of K-ras 4A protein from separate cultures of cells grown at different times were made by Western blotting (Fig. 1). There were apparent major differences in amounts of K-ras 4A protein among the cell lines. On average, levels were not related to K-ras mutational status, with values of 0.17 ± 0.10 for wildtype (N = 5) and 0.18 ± 0.09 for mutant K-ras cell lines (N = 11).
Fig. 1.
Levels of K-ras 4A protein in lung cancer cell lines, relative to that in H441 cells measured on the same immunoblot. A representative blot is shown in the inset. Each value is the average of determinations with two different cell preparations, with the ranges given as bars.
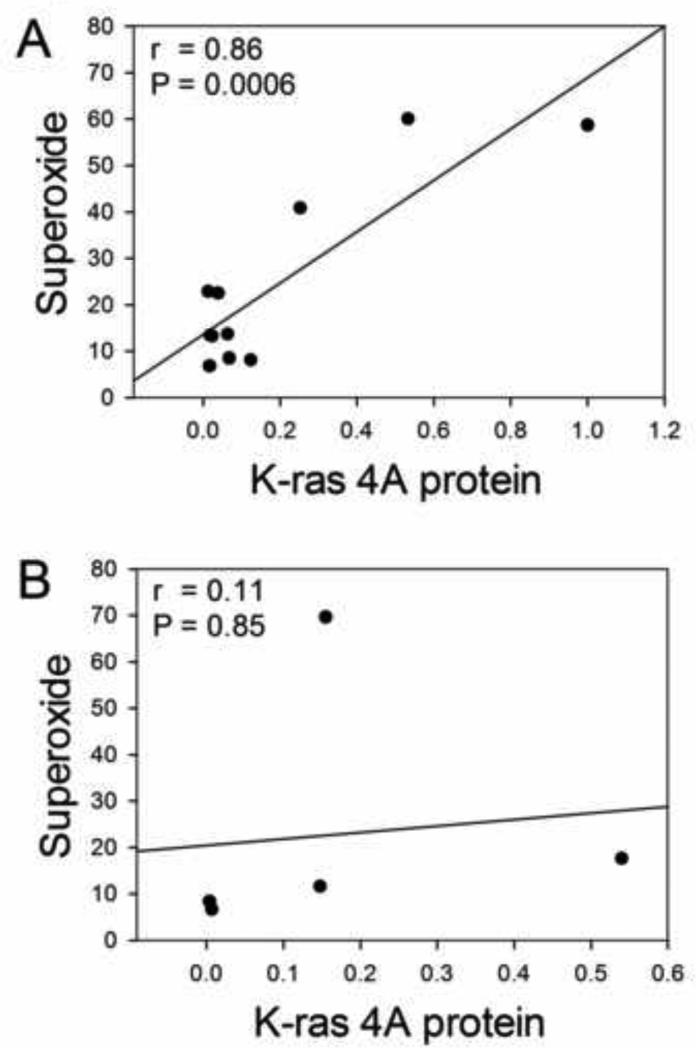
The averages of the two determinations of K-ras levels were plotted vs average superoxide values, and significance determined by the Pearson linear correlation test. For the 11 cell lines presenting mutant K-ras , K-ras 4A protein correlated with average superoxide levels with a high degree of significance (P = 0.0006, r = 0.86) (Fig. 2A). By contrast, for the 5 cell lines with wildtype K-ras, there was no significant correlation between K-ras 4A protein and average superoxide levels (P = 0.85, r = 0.11) (Fig. 2B)
Fig. 2.
Correlations of average relative K-ras 4A protein levels with average superoxide levels (μmol nitro blue tetrazolium reduced in 30 min per mg total protein, from [9]). Significance values from Pearson correlations are given on the graphs. Correlation was strong for cell lines with mutant K-ras (A), but lacking in those with wildtype K-ras (B).
Inhibition of K-ras 4A protein levels by siRNA did not decrease superoxide levels.
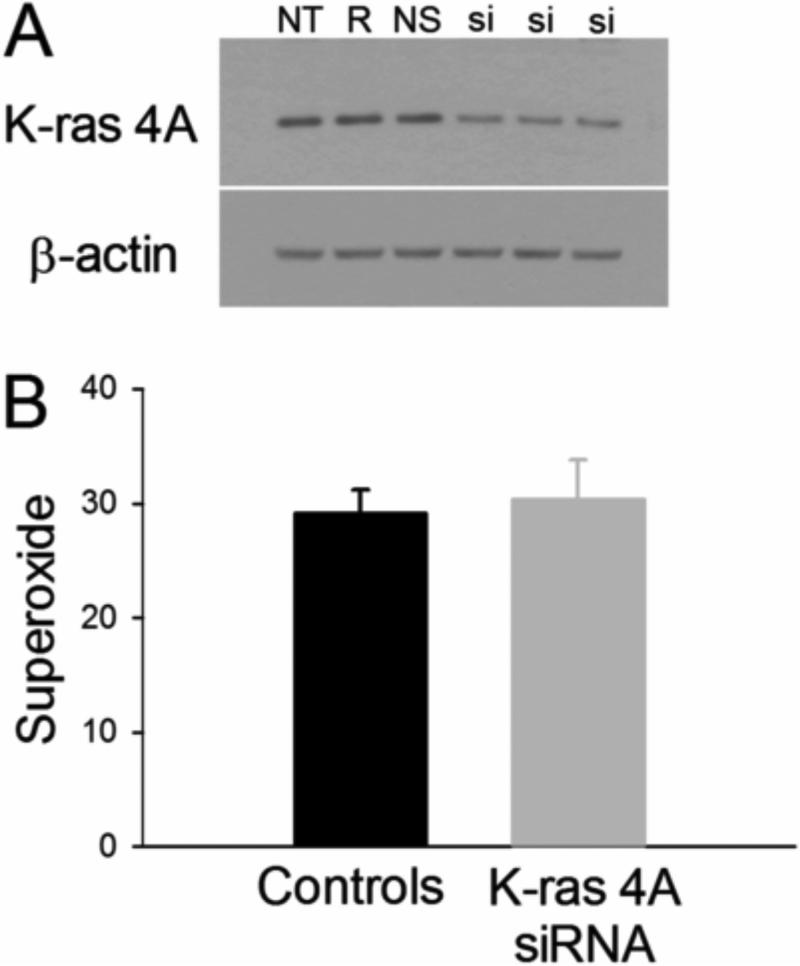
We hypothesized that K-ras 4A protein might control or regulate superoxide generation. This possibility was tested in H441and H1734 cells, both of which produced high levels of both K-ras 4A protein and superoxide. In H441 cells, 5 nM K-ras 4A siRNA decreased K-ras 4A to 35% of control value, P = 0.0001 (Fig 3A). Superoxide levels were not altered from control. Mean control superoxide values of H441 cells versus those treated with K-ras 4A siRNA were 29.08 ± 2.15 and 30.28 ± 3.58 (mean ± SEM) nmol NBT reduced/mg protein, respectively (Fig 3B). These data were confirmed by a second siRNA experiment with H441 cells which yielded similar results. For further confirmation of results, we did the same experiment with H1734 cells. Five nM siRNA decreased K-ras 4A protein expression to a mean of 61.4% of control value (P = 0.0298, t-test). There was no significant difference in superoxide levels in control versus siRNA-treated cells: 18.35 ± 2.039 and 17.93 ± 4.318 nmol NBT reduced per mg protein, respectively (data not shown). Therefore, we concluded K-ras 4A was not responsible for superoxide generation, at least in these two cell lines.
Fig. 3.
A. Representative western blot for K-ras 4A following siRNA treatment in H441 cells, resulting in a significant decrease of K-ras 4A levels to 35% of control (p = 0.0001). Abbreviations: NT = no treatment, R = transfection reagent only, NS = nonsilencing siRNA (negative control), and si = K-ras 4A siRNA. B. The reduction of K-ras 4A protein produced no change in superoxide. Units for superoxide are the same as in Fig. 2.
Decrease in superoxide levels tended to reduce K-ras 4A protein levels
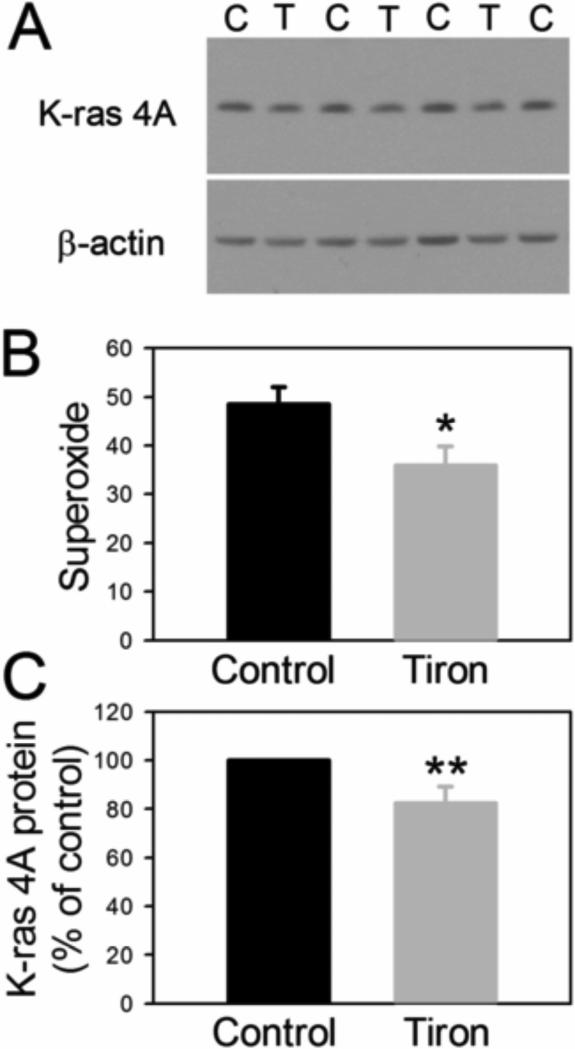
An alternative hypothesis was that cellular superoxide positively regulates K-ras 4A protein levels. Levels of superoxide were reduced by incubation of H441 or H1734 cells with the superoxide scavenger Tiron. In H441 cells, 5 mM Tiron significantly decreased superoxide production by 26% (P = 0.0291, 2-tailed t-test, N = 9 for control, N= 8 for Tiron) and K-ras 4A protein expression by 18% (Fig. 4 A and B). Because the decrease in K-ras 4A protein in H441 cells was modest, Tiron K-ras 4A protein values on each gel were normalized to the mean of the control values for that gel (Fig. 4C) and statistical analysis utilized a 2-tailed 1 sample t-test (P = 0.0476, n= 6 for both controls and Tiron-treated cells). H1734 cells were treated with 2 mM Tiron, to avoid the cytotoxicity we noted at 5 mM. This tended to decrease superoxide production by 20%, which was not statistically significant (not shown, P = 0.126, N = 5 for control, 5 for Tiron-treated). Despite the fact that this 20% decrease in superoxide was not statistically significant, a significant 40% decrease in K-ras 4A protein was noted with Tiron treatment (not shown, P = 0.0406, N = 5 for control and 5 for Tiron-treated). These results together suggested that superoxide was stimulating up-regulation of K-ras 4A protein in these cell lines.
Fig. 4.
A. Representative western blot of K-ras 4A protein from H441 cells treated with 5 mM Tiron (C = control, T = Tiron). B. Average superoxide values for these cells (units defined in Fig. 2), *p = 0.0291. C. Levels of K-ras 4A protein normalized to the mean of controls for each blot, **p = 0.0476, two-tailed one sample t-test.
Levels of K-ras 4A protein and mRNA correlated in cell lines with mutant K-ras
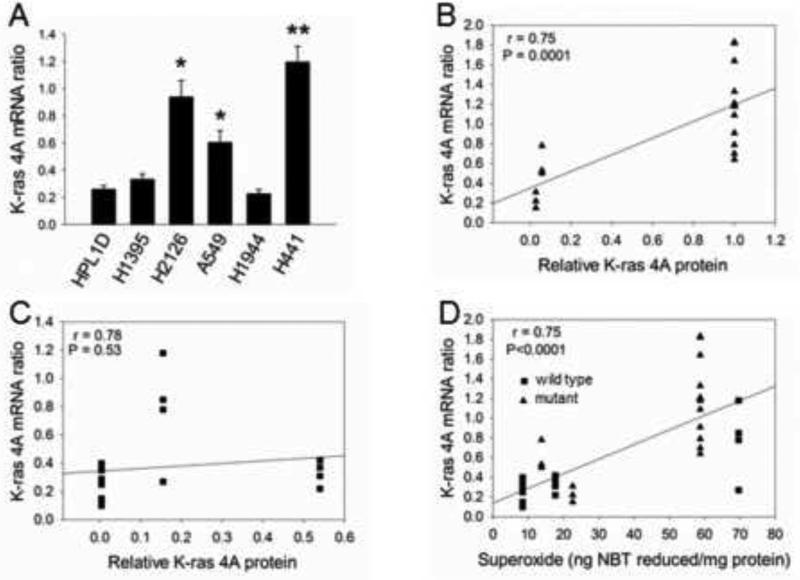
To investigate possible mechanisms of effects of superoxide on K-ras 4A protein, we quantified K-ras 4A mRNA in 6 cell lines, including ones with high or low superoxide and mutant or wildtype K-ras. These lines were characterized by variable levels of K-ras 4A mRNA normalized to GAPDH mRNA (Fig. 5A). K-ras 4A mRNA levels were significantly higher in H441 cancer cells, compared with the non-transformed HPL cells. Levels were also higher in H2126 and A549 cells by pair-wise tests. For those with mutant K-ras, 4A protein and 4A mRNA correlated strongly (Fig. 5B, P = 0.0001), whereas those with wildtype K-ras showed no significant correlation (Fig. 5C, P = 0.53). These results suggest that the level of K-ras 4A mRNA is a limiting factor for amounts of K-ras 4A protein, specifically in cells with mutant K-ras.
Fig. 5.
A. Levels of K-ras 4A mRNA relative to GAPDH. Sample size (N) values for K-ras 4A determinations were as follows: HPL, N = 13; H441, N =12; H1395, N = 4; H1944, N = 4; H2126, N = 4; A549, N = 3. ** P < 0.001 vs. HPL cells, Kruskal-Wallis test, followed by Dunn’s multiple comparisons test. * P< 0.05 vs. HPL, Mann-Whitney pair-wise test. B. Significant correlation between K-ras 4A protein and mRNA in cell lines with mutant K-ras. C. Lack of correlation between K-ras 4A protein and mRNA in cell lines with wildtype K-ras. D. Significant correlation between K-ras 4A mRNA and superoxide for all cell lines (P values on graph), including those with mutant K-ras (symbol triangle) (P = 0.0013) and those with wildtype K-ras (symbol square) (P<0.0001).
K-ras 4A mRNA correlated with superoxide in all cell lines
The results above raised the possibility that superoxide might be selectively regulating transcription of the mutant K-ras gene. Superoxide correlated strongly with K-ras 4A mRNA (Fig. 5D, P<0.0001 for all 6 lines). But this was true for the lines with wildtype K-ras (P<0.0001) as well as for those with mutant K-ras (P =0.0013). These results suggest that superoxide might indeed influence K-ras 4A mRNA levels, but do not explain why only mutant K-ras 4A protein correlates with superoxide.
K-ras 4B mRNA levels correlated with K-ras 4A mRNA levels and with superoxide
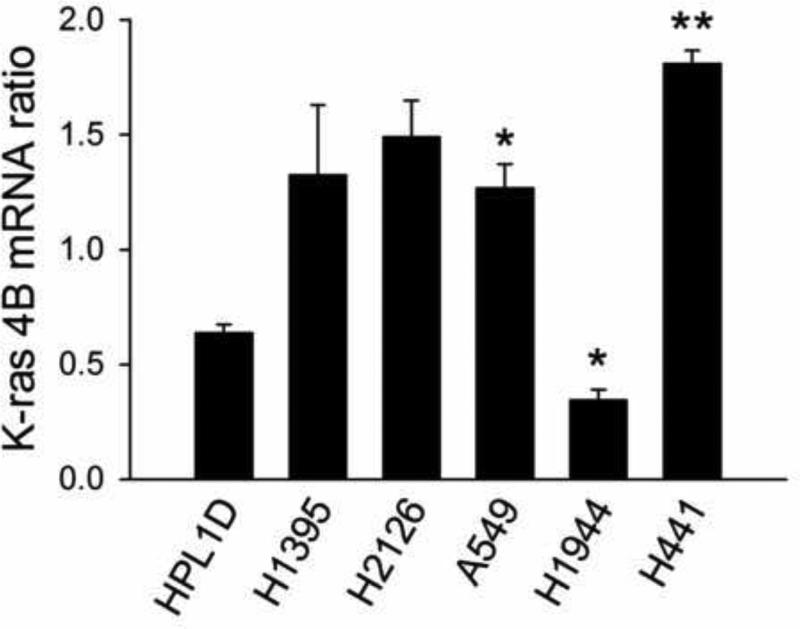
K-ras 4B mRNA levels were also measured in the cell lines (Fig. 6). As for K-ras 4A, H441 cancer cells presented a significant increase in K-ras 4B mRNA relative to nontransformed HPL cells. A549 cells had higher K-ras 4B mRNA, and H1944 lower, by pairwise tests. Relative levels of K-ras 4A and 4B mRNAs were correlated for all cell lines (P<0.0001), for K-ras mutant cell lines (P<0.0001) (Suppl. Fig. 1 A, C) and for K-ras wildtype cell lines (P = 0.061 and 0.0017) (Suppl. Fig. 1 B, D). It thus appeared that 4A and 4B mRNAs were similarly regulated, whether or not mutated.
Fig. 6.
Levels of K-ras 4B mRNA relative to GAPDH. Sample size (N) values for K-ras 4A determinations were as follows: HPL, N = 10; H441, N =10; H1395, N = 2; H1944, N = 3; H2126, N = 3; A549, N = 3. ** P < 0.01 vs. HPL cells, Kruskal-Wallis test, followed by Dunn’s multiple comparisons test. * P< 0.05 vs. HPL, Mann-Whitney pair-wise test.
As for K-ras 4A mRNA, K-ras 4B mRNA correlated significantly with superoxide for all cell lines, with P = 0.017 for mutant cell lines (Suppl. Fig. 2A), and with somewhat less significance (P=0.044) for wildtype cell lines (Suppl. Fig 2B). Collectively these results are consistent with superoxide regulating pre-splicing expression of K-ras transcription.
Levels of K-ras 4A and 4B mRNA were similar on average for cell lines with wildtype or mutant K-ras, but 4A predominated in H441 cells
Average levels of K-ras 4A mRNA normalized to GAPDH mRNA were 0.45 ± 0.16 and 0.67 ± 0.28 for cell lines with wildtype or mutant K-ras, respectively (P = 0.55). These values for K-ras 4B mRNA were 1.22 ± 0.19 and 1.31 ± 0.60, respectively. Thus, for both 4A and 4B, mRNA levels were independent of mutational status. These real-time mRNA determinations provided relative rather than absolute values, so it was not possible directly to compare quantitatively the levels of K-ras 4A mRNA with levels of K-ras 4B. However, for several cancer cell lines it was possible to normalize 4A and 4B mRNAs relative to these values in the non-transformed HPL line. For H441 cells, 4A mRNA was 70% higher than 4B mRNA (P=0.0028), but H1944, H1395, and H2126 did not present significant differences (not shown). Relative total K-ras protein levels in the cell lines were reported previously [9]. The ratio of relative K-ras 4A protein to relative total K-ras protein for H441 cells was 0.1, compared to a ratio of 0.002 for HPL cells. Thus in the H441 cell line, at least, the relatively greater 4A mRNA compared with 4B mRNA corresponded with a relatively greater percentage of total K-ras protein as 4A protein.
Discussion
Here we present the first extensive quantification of K-ras 4A protein in lung cancer cell lines. The amounts of this protein varied 250-fold among the lines. On average, neither 4A protein nor 4A mRNA was significantly different in amount between lines with wild-type or mutant K-ras. However, there was a significant correlation between 4A protein and mRNA only in cell lines with mutant K-ras.
In pursuit of an earlier observation linking K-ras activity to superoxide [9], we looked for a correlation between K-ras 4A and superoxide levels. Heretofore no report has considered the K-ras splice variants in the context of reactive oxygen species. We were not surprised to observe a correlation between K-ras 4A protein and superoxide levels in lung cancer cell lines containing mutant K-ras. Unexpected, however, was the experimental evidence, from manipulation of K-ras and superoxide levels, that mutant K-ras 4A was not causing superoxide elevation, but rather that superoxide seemed to be influencing expression of mutant K-ras 4A protein.
We used Tiron to reduce cellular superoxide levels. Tiron could possibly have unexpected off target effects which might reduce the level of K-ras 4A protein. In addition to scavenging superoxide, Tiron also binds metals including iron, copper, uranium, strontium, vanadium, beryllium and chromium (11). Iron, copper and chromium would be expected to be present in the adenocarcinoma cells, while the other metals would need to be deliberately added. Iron has been reported to facilitate K-ras mutations in naked DNA through production of hydroxyl radicals (12). Tiron binding to free iron might be expected to reduce K-ras mutations in their system by inhibiting the Fenton reaction. However, alteration of K-ras 4A protein or mRNA levels associated with reduced iron, copper or chromium levels has not been reported. Considering what is known about Tiron, we think an off-target effect resulting in reduced levels of K-ras 4A protein is unlikely.
Increased expression of Ras genes in cells has caused increases in reactive oxygen species. While most studies have utilized H-ras (e.g., [13]), K-rasV12 transfected into NRK kidney cells resulted in upregulation of Nox1 and superoxide [14]. On the other hand, transfection of the E10 murine lung cell line with K-rasV12 did not result in increased levels of superoxide compared to wt K-ras transfectants or to the parental E10 cell line [15], although increased peroxides did result, via induction of cyclooxygenase 2.
We sought further understanding of the mutant K-ras 4A protein-superoxide relationship by testing for correlations. Such correlations do not, of course, establish cause-effect, but can lead to speculations and suggestions for further studies. Superoxide correlated with mRNA for K-ras 4A and 4B, both wildtype and mutant. This suggested superoxide effects on mRNA transcription or stability prior to splicing. Ras genes are among those that respond immediately to ionizing radiation, which entails superoxide generation [16]. The let-7 family of microRNAs changed expression in response to ionizing radiation [17]. Let-7 microRNA negatively regulates Ras gene transcription [18], including K-ras in A549 cells [19], and Let-7 microRNA reduced growth of mouse lung tumors [20].
In addition to the putative general effects of superoxide on K-ras mRNA, there appeared to be possible actions specific to the mutant protein form, at least mutant K-ras 4A. Wild-type and mutant K-ras p21s are degraded after intracellular trafficking to lysosomes [21] with a rate that may be influenced by motility and residence time in the cell membrane [22,23] and may be greater for the mutant form [23,24]. This has been shown for K-ras 4B p21 [25,26]; K-ras 4A may not have been specifically studied. Superoxide could affect these processes indirectly via signaling pathways. Direct effects are also possible, altering conformation of mutant protein specifically, to result in increased cell membrane residence or slower trafficking into the lysosomes. The Cys118 in Ras is redox-active [27].
Conclusion
Lung cancer lines with mutant K-ras differed from those with wildtype K-ras, in that K-ras 4A protein correlated with superoxide and with K-ras 4A mRNA. Several experiments indicated that superoxide was impacting K-ras 4A protein levels, and not vice versa. However, superoxide correlated with both 4A and 4B mRNA, in wildtype as well as mutant cell lines. The results are most consistent with two different cumulative effects of superoxide: stimulation of transcription of the K-ras gene; and selective stabilization of K-ras 4A mutant protein.
Superoxide-mediated increases in K-ras 4A mutant protein in lung cancer cells could be of interest in the contexts of both lung cancer prevention and treatment, in view of the likely importance of this isoform for this cancer type. Mitochondrially-generated ROS were needed for full tumorigenicity of a K-ras mutant in mouse lung [28] and for K-ras 4A activation related to malignant progression of several cancer types [29].
Supplementary Material
Suppl. Fig 1. Significant correlations between K-ras 4A and 4B mRNAs, for cell lines with mutant K-ras (A and C) and for cell lines with wildtype K-ras (B and D). Two analytical approaches were used: averages of K-ras 4A mRNA values plotted vs. individual K-ras 4B mRNA values (A and B), and averages of K-ras 4B mRNA values plotted vs. individual K-ras 4A mRNA values (C and D). Averages were used for these analyses, because K-ras 4A mRNA and K-ras 4B mRNA determinations were made on different cell preparations.
Suppl. Fig. 2. Significant correlations of K-ras 4B mRNA with superoxide, in cell lines with mutant K-ras (A) and in those with wild-type K-ras (B).
Acknowledgements
We wish to thank Drs. A. Masuda and T. Takahashi for providing the HPL cells on a collaborative basis. The authors also wish to recognize the technical assistance of William T. Calvert. This research was supported by the Intramural Research Program of the National Institutes of Health, National Cancer Institute, and with Federal funds from the National Cancer Institute under Contract HHSN261200800001E. Any opinions, findings, conclusions, or recommendations in this publication are those of the authors and do not necessarily reflect the views of the Department of Health and Human Services.
Footnotes
Publisher's Disclaimer: This is a PDF file of an unedited manuscript that has been accepted for publication. As a service to our customers we are providing this early version of the manuscript. The manuscript will undergo copyediting, typesetting, and review of the resulting proof before it is published in its final citable form. Please note that during the production process errors may be discovered which could affect the content, and all legal disclaimers that apply to the journal pertain.
Conflict of Interest Statement
None of the authors have any actual or potential conflict of interest including any financial, personal or other relationships with other people or organizations that could inappropriately influence (bias) their work.
References
- 1.Wang Y, You M, Wang Y. Alternative splicing of the K-ras gene in mouse tissues and cell lines. Exp Lung Res. 2001;27:255–267. doi: 10.1080/019021401300054028. [DOI] [PubMed] [Google Scholar]
- 2.Plowman SJ, Berry RL, Bader SA, Luo F, Arends MJ, Harrison DJ, et al. K-ras 4A and 4B are co-expressed widely in human tissues, and their ratio is altered in sporadic colorectal cancer. J Exp Clin Cancer Res. 2006;25:259–267. [PubMed] [Google Scholar]
- 3.Plowman SJ, Williamson DJ, O'Sullivan MJ, Doig J, Ritchie AM, Harrison DJ, et al. While K-ras is essential for mouse development, expression of the K-ras 4A splice variant is dispensable. Mol Cell Biol. 2003;23:9245–50. doi: 10.1128/MCB.23.24.9245-9250.2003. [DOI] [PMC free article] [PubMed] [Google Scholar]
- 4.Plowman SJ, Arends MJ, Brownstein DG, Luo F, Devenney PS, Rose L, et al. The K-ras 4A isoform promotes apoptosis but does not affect either lifespan or spontaneous tumor incidence in aging mice. Exp Cell Res. 2006;312:16–26. doi: 10.1016/j.yexcr.2005.10.004. [DOI] [PubMed] [Google Scholar]
- 5.Luo F, Ye H, Hamoudi R, Dong G, Zhang W, Patek CE, et al. K-ras exon 4A has a tumour suppressor effect on carcinogen-induced murine colonic adenoma formation. J Pathol. 2010;220:542–50. doi: 10.1002/path.2672. [DOI] [PubMed] [Google Scholar]
- 6.To MD, Wong CE, Karnezis AN, Del Rosario R, Di Lauro R, Balmain A. Kras regulatory elements and exon 4A determine mutation specificity in lung cancer. Nature Genet. 2008;40:1240–44. doi: 10.1038/ng.211. [DOI] [PMC free article] [PubMed] [Google Scholar]
- 7.Patek CE, Arends MJ, Wallace WA, Luo F, Hagan S, Brownstein DG, et al. Mutationally activated K-ras 4A and 4B both mediate lung carcinogenesis. Exp Cell Res. 2008;314:1105–14. doi: 10.1016/j.yexcr.2007.11.004. [DOI] [PubMed] [Google Scholar]
- 8.Voice JK, Klemke RL, Le A, Jackson JH. Four human ras homologs differ in their abilities to activate Raf-1, induce transformation, and stimulate cell motility. J Biol Chem. 1999;274:17164–70. doi: 10.1074/jbc.274.24.17164. [DOI] [PubMed] [Google Scholar]
- 9.Romanowska M, Maciag A, Smith AL, Fields JR, Fornwald LW, Kikawa K, et al. DNA damage, superoxide, and mutant K-ras in human lung adenocarcinoma cells. Free Radic Biol Med. 2007;43:1145–55. doi: 10.1016/j.freeradbiomed.2007.07.004. [DOI] [PubMed] [Google Scholar]
- 10.Masuda A, Kondo M, Saito T, Yatabe Y, Kobayshi T, Okamoto M, et al. Establishment of human peripheral lung epithelial cell lines (HPL1) retaining differentiated characteristics and responsiveness to epidermal growth factor, hepatocyte growth factor, and transforming growth factor β1. Cancer Res. 1997;57:4898–904. [PubMed] [Google Scholar]
- 11.Krishna CM, Liebmann JE, Kaufman D, DeGraf W, Hahn SM, McMurry T, et al. The catecholic metal sequestering agent 1,2-dihydroxybenzene-3,5-disulfonate confers protection against oxidative cell damage. Arch Biochem Biophys. 1992;294:98–106. doi: 10.1016/0003-9861(92)90142-j. [DOI] [PubMed] [Google Scholar]
- 12.Jackson JH, Vollenweider M, Hill J, Rodriguez H, Schwabacher AW, Mitra G, et al. Stimulated human leukocytes cause activation mutations in the K-ras proto-oncogene. Oncogene. 1997;14:2803–2808. doi: 10.1038/sj.onc.1201118. [DOI] [PubMed] [Google Scholar]
- 13.Weyemi U, Lagente-Chevallier O, Boufraqech M, Prenois F, Courtin F, Caillou B, et al. ROS-generating NADPH oxidase NOX4 is a critical mediator in oncogenic H-Ras-induced DNA damage and subsequent senescence. Oncogene. 2012;31:1117–29. doi: 10.1038/onc.2011.327. [DOI] [PMC free article] [PubMed] [Google Scholar]
- 14.Mitsushita J, Lambeth JD, Kamata T. The superoxide-generating oxidase Nox1 is functionally required for ras oncogene transformation. Cancer Res. 2004;64:3580–85. doi: 10.1158/0008-5472.CAN-03-3909. [DOI] [PubMed] [Google Scholar]
- 15.Maciag A, Sithanandam G, Anderson LM. Mutant K-rasv12 increases COX-2, peroxides and DNA damage in lung cells. Carcinogenesis. 2004;25:2231–37. doi: 10.1093/carcin/bgh245. [DOI] [PubMed] [Google Scholar]
- 16.Prasad AV, Mohan N, Chandrasekar B, Meltz ML. Induction of transcription of “immediate early genes” by low-dose ionizing radiation. Radiat Res. 1995;143:263–272. [PubMed] [Google Scholar]
- 17.Chaudhry MA. Real-time PCR analysis of micro-RNA expression in ionizing radiation-treated cells. Cancer Biother Radiopharm. 2009;24:49–56. doi: 10.1089/cbr.2008.0513. [DOI] [PubMed] [Google Scholar]
- 18.Johnson SM, Grosshans H, Shingara J, Byrom M, Jarvis R, Cheng A, et al. RAS is regulated by the let-7 microRNA family. Cell. 2005;120:635–47. doi: 10.1016/j.cell.2005.01.014. [DOI] [PubMed] [Google Scholar]
- 19.Oh JS, Kim JJ, Byun JY, Kim IA. Lin28-let7 modulates radiosensitivity of human cancer cells with activation of K-Ras. Int J Radiat Oncol Biol Phys. 2010;76:5–8. doi: 10.1016/j.ijrobp.2009.08.028. [DOI] [PubMed] [Google Scholar]
- 20.Trang P, Medina PP, Wiggins JF, Ruffino L, Kelnar K, Omotola M, et al. Regression of murine lung tumors by the let-7 microRNA. Oncogene. 2010;29:1580–7. doi: 10.1038/onc.2009.445. [DOI] [PMC free article] [PubMed] [Google Scholar]
- 21.Lu A, Tebar F, Alvarez-Moya B, Lopez-Alcala C, Calvo M, Enrich C, et al. A clathrin-dependent pathway leads to KRas signaling on late endosomes en route to lysosomes. J Cell Biol. 2009;184:863–79. doi: 10.1083/jcb.200807186. [DOI] [PMC free article] [PubMed] [Google Scholar]
- 22.Weisz B, Giehl K, Gana-Weisz M, Egozi Y, Ben-Baruch G, Marciano D, et al. A new functional Ras antagonist inhibits pancreatic tumor growth in nude mice. Oncogene. 1999;18:2579–88. doi: 10.1038/sj.onc.1202602. [DOI] [PubMed] [Google Scholar]
- 23.Niv H, Gutman O, Kloog Y, Henis YI. Activated K-Ras and H-Ras display different interactions with saturable nonraft sites at the surface of live cells. J Cell Biol. 2002;157:865–72. doi: 10.1083/jcb.200202009. [DOI] [PMC free article] [PubMed] [Google Scholar]
- 24.Haklai R, Weisz MG, Elad G, Paz A, Marciano D, Egozi Y, et al. Dislodgment and accelerated degradation of Ras. Biochemistry. 1998;37:1306–14. doi: 10.1021/bi972032d. [DOI] [PubMed] [Google Scholar]
- 25.Niv H, Gutman O, Henis YI, Kloog Y. Membrane interactions of a constitutively active GFP-Ki-Ras 4B and their role in signaling. Evidence from lateral mobility studies. J Biol Chem. 1999;274:1606–13. doi: 10.1074/jbc.274.3.1606. [DOI] [PubMed] [Google Scholar]
- 26.Elad G, Paz A, Haklai R, Marciano D, Cox A, Kloog Y. Targeting of K-Ras 4B by S-trans,trans-farnesyl thiosalicylic acid. Biochim Biophys Acta. 1999;1452:228–42. doi: 10.1016/s0167-4889(99)00144-5. [DOI] [PubMed] [Google Scholar]
- 27.Heo J, Campbell SL. Ras regulation by reactive oxygen and nitrogen species. Biochem. 2006;45:2200–10. doi: 10.1021/bi051872m. [DOI] [PubMed] [Google Scholar]
- 28.Weinberg F, Hamanaka R, Wheaton WW, Weinberg S, Joseph J, Lopez M, et al. Mitochondrial metabolism and ROS generation are essential for Kras-mediated tumorigenicity. Proc Natl Acad Sci USA. 2010;107:8788–93. doi: 10.1073/pnas.1003428107. [DOI] [PMC free article] [PubMed] [Google Scholar]
- 29.Cook CC, Kim A, Terao S, Gotoh A, Higuchi M. Consumption of oxygen: a mitochondrial-generated progression signal of advanced cancer. Cell Death Dis. 2012;3:e258. doi: 10.1038/cddis.2011.141. [DOI] [PMC free article] [PubMed] [Google Scholar]
Associated Data
This section collects any data citations, data availability statements, or supplementary materials included in this article.
Supplementary Materials
Suppl. Fig 1. Significant correlations between K-ras 4A and 4B mRNAs, for cell lines with mutant K-ras (A and C) and for cell lines with wildtype K-ras (B and D). Two analytical approaches were used: averages of K-ras 4A mRNA values plotted vs. individual K-ras 4B mRNA values (A and B), and averages of K-ras 4B mRNA values plotted vs. individual K-ras 4A mRNA values (C and D). Averages were used for these analyses, because K-ras 4A mRNA and K-ras 4B mRNA determinations were made on different cell preparations.
Suppl. Fig. 2. Significant correlations of K-ras 4B mRNA with superoxide, in cell lines with mutant K-ras (A) and in those with wild-type K-ras (B).


