Correction to “Organic Radical Contrast Agents for Magnetic Resonance Imaging”
Andrzej Rajca,*,† Ying Wang,† Michael Boska,‡ Joseph T. Paletta,† Arnon Olankitwanit,† Michael A. Swanson,§ Deborah G. Mitchell,§ Sandra S. Eaton,§ Gareth R. Eaton,§ and Suchada Rajca†
J. Am. Chem. Soc., 2012, 134, 15724–15727. DOI: 10.1021/ja3079829
We re-examined the T1 weighted raw data and found that the raw signal intensity scale was changing despite the designation of “absolute value” reconstruction on the Bruker scanner. There was a hidden “slope” factor that modifies the raw intensities when the absolute value reconstruction was designated. This does not affect the signal within a single acquisition, such as the T1 mapping data, but does affect the intensities scales before and after injection of contrast agent. Elimination of this scaling factor (done via user designation of the slope and offset in the reconstruction options) eliminates this factor and provides a true rendering of the signal changes with constant acquisition parameters and constant receiver gain (which was done in all experiments).
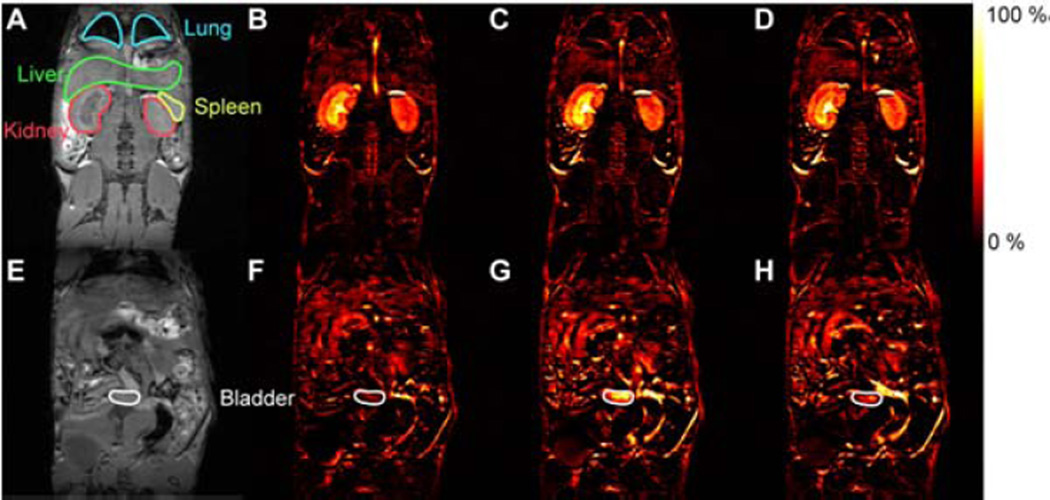
Page 15726. Correction to the subtraction images and caption in Figure 3. We obtain corrected subtraction image with this same data set, but with the slope factor manually designated as 1. The corrected subtracted images and caption are shown below in the in the corrected version of Figure 3.
Figure 3.
3D T1-weighted spoiled-gradient recalled-echo MRI of mouse before and after injection of 1-mPEG-G4. (A,E) MRI before injection. (B–D,F–H) subtraction of pre-injection images from images obtained during the period 0–30 min (B,F), 30–60 min (C,G), and 60–90 min (D,H) after injection.
Page 15727. Correction to MR signal intensity of the lung. We examined the lung region of interest (ROI) and found that the signal in the lung is at least 10 – 100 times smaller than in the kidneys and the blood, based upon the normalized intensities.


