

Homozygous sickle-cell disease (HbSS; SCD) is associated with vaso-occlusive manifestations of varying severity [1]. Pain crises are generally believed to result from obstruction of the microvasculature secondary to adhesion of red blood cells (RBCs) and other cellular elements, and decreased deformability of hypoxia-induced sickled RBCs, with ensuing activation of coagulation and inflammatory pathways [2, 3]. One of the proposed contributors to thrombosis in SCD is the loss of normal phospholipid asymmetry on sickled RBCs due to the repeated process of hypoxia-induced sickling and unsickling [4]. The exposure of anionic phosphatidylserine (PS) on the outer membrane supports the assembly of enzymatic clotting reactions, leading to a sub-population of RBCs with a prothrombotic phenotype [5, 6].
We recently demonstrated that in healthy individuals, a subpopulation (∼0.5%) of PS-expressing RBCs contribute a significant fraction (∼40%) of the total thrombin generating potential of blood [7]. Prothrombin activation requires factor Xa to perform two proteolytic cleavages at Arg 271 and Arg 320 to release the active α-thrombin (αIIa) product [8]. Depending on the order of proteolysis, prothrombin activation can occur via two possible intermediates; meizothrombin (mIIa), an active enzyme; or prethrombin-2 (pre2), a non-enzymatic intermediate [9]. Unlike platelets, which support thrombin generation exclusively through the pre2 intermediate [10], this subpopulation of procoagulant RBCs supports prothrombin activation via the mIIa intermediate in a manner similar to that on synthetic phospholipids [7]. mIIa is of interest because it exhibits the anticoagulant functions of αIIa towards protein C activation, while lacking any significant activity towards procoagulant substrates like fibrinogen, FV and platelets [11]. Due to the markedly enhanced PS expression by sickled RBCs, we therefore hypothesized that the total αIIa generation potential, as well as mIIa production, would be significantly increased in the whole blood of SCD patients compared to healthy controls. To test this hypothesis, we recruited 7 outpatients (4 female and 3 male, age 28-51) with HbSS, in their non-crisis, “steady states,” and 6 healthy African-American controls (3 female and 3 male age 24-38). None of the patients or controls was being treated currently with anticoagulant or anti-platelet therapy, and all SCD patients were at least 3 months remote from red cell transfusion or hospital admission for pain crisis. We utilized our immunoassays that are capable of selective quantitation of αIIa-antithrombin (αTAT) and mIIa-antithrombin (mTAT) to measure the relative production of the two species produced in SCD vs. control individuals after tissue factor (TF)-initiated coagulation.
To examine the thrombin generation potential of the HbSS cohort vs. that of the control group, whole blood was subjected to a 5 pM TF stimulus in the presence of 0.1 mg/mL of corn trypsin inhibitor. Quenched time course samples were subsequently analyzed using αTAT and mTAT ELISAs. Figure 1A displays the time course data for αTAT generation in the HbSS and control cohorts. The control cohort clotted on average at 3.8±0.2 min (mean±SEM), generated αTAT at a rate of 63±3.9 nM/min and reached a maximum αTAT level of 502±14 nM. Unexpectedly, clot time (3.98±0.2 min) and the maximum level (515±49 nM) of αTAT generated in the HbSS cohort were similar to that observed in the controls while the rate of αTAT generation at 74.1±7.9 nM/min was only 15% higher (P>0.05).
Figure 1.
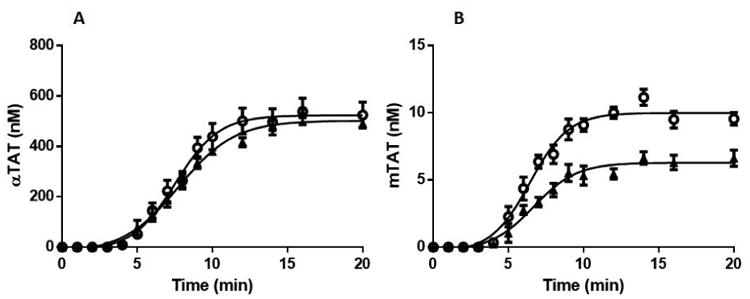
αTAT and mTAT ELISA analyses of HbSS and Control groups.
Whole blood was drawn into 0.1 mg/mL CTI and activated by 5 pM TF at t=0. Samples were quenched at varying intervals with EDTA and FPR-chloromethyl ketone prior to being analyzed by αTAT and mTAT ELISA assays. A. Average αTAT generation profiles for healthy African American controls (N=6) (▲) and for HbSS patients (N=7)(
 ). B. Average mTAT generation profiles for healthy African American controls (N=6)(▲) and for HbSS patients (N=7) (
). Data are shown as the mean±SEM.
). B. Average mTAT generation profiles for healthy African American controls (N=6)(▲) and for HbSS patients (N=7) (
). Data are shown as the mean±SEM.
Figure 1B displays the time course data for mTAT generation. As reported previously [7], the observed mTAT levels were significantly less than αTAT due to the lability of the mIIa intermediate. The control cohort generated mTAT at an average maximum rate of 1.02±0.13 nM/min and reached an average maximum level of 6.5±0.52 nM. The HbSS cohort generated mTAT 33% faster (1.51±0.12 nM/min) and reached a maximum level of mTAT (10.1±0.44 nM) that was 36% higher than that observed in the control group. Thus, unlike the case with αTAT, a significant difference (mTAT max level P<0.001, mTAT max rate P=0.02) in the mTAT generation profiles between the two subject groups was observed.
The expression of PS on RBCs was detected by the binding of FITC-labeled bovine lactadherin using flow cytometry. Consistent with our previous report [7], the control cohort displayed low levels (0.59±0.19%) of PS-expressing RBCs, whereas the HbSS cohort displayed a wide range (2-26%) of PS-expressing RBCs with a mean of 6.4±6.1%, consistent with previous reports [6, 12]. The number of PS-expressing cells relative to the individual hematocrits in the HbSS and control groups were examined and compared to the rates of mTAT generation in the time course samples. Six of the 7 HbSS patients and 5 of the 6 controls were analyzed. Although these data were not statistically significant, the control cohort showed a trend towards a positive correlation of 0.74 (P=0.09) and the HbSS cohort also showed a positive correlation of 0.55 (P=0.11). RBC microparticles (MPs) were also measured in both cohorts and on average, the SCD cohort showed double the level of RBC MPs observed in the controls (1116±1079/μL vs 677±230/μL respectively). However, no correlation between the rate of either αTAT or mTAT formation and the RBC microparticle counts in either cohort was observed.
In addition to the hemolytic and vaso-occlusive complications experienced by patients with SCD, activation of coagulation remains a critical component of their pathology [13]. Previous studies in SCD have generally been performed using TF-initiated thrombin generation in platelet-poor plasma, and have failed to agree on whether the principal indices of thrombin generation are abnormal [13]. While the lack of consensus on this issue may be partly explained by varying pre-analytical and analytical conditions, this experimental system fails to take into account the important potential role that red cells and other circulating hematopoietic cells play in the hypercoagulable state associated with SCD. We were therefore somewhat surprised to see that in our minimally modified whole blood model, the overall extent of αTAT generation did not differ significantly between the two groups. However, in view of the large (∼50%) reduction in RBC number in SCD (2.50 ± 0.73 × 10⁶/μL in SCD vs. 4.93 ± 0.56 × 10⁶/μL in controls) the erythrocyte contribution to overall thrombin generation is probably much greater than we have observed in healthy individuals. In support of this hypothesis, the rate of mTAT generation and the maximum mTAT level attained in the HbSS cohort were 36% greater than that observed in controls. As previously reported, maximum mTAT levels in both groups were approximately 40-fold lower than the corresponding αTAT levels, most likely due to the labile nature of the Arg 155 and Arg 271 bonds in mIIa species in the clotting blood of a closed system which favors the formation of α-thrombin [14]. Furthermore, since factor Xa is the limiting component of the prothrombinase complex, more phospholipid surface does not necessarily equate to more thrombin generation. However, although limited by the small study size, the increase in PS expression observed in HbSS RBC populations appeared to be directly proportional to mTAT production, in agreement with our previous report [7]. Thus, the higher rate of mIIa generation observed in HbSS is in support of our previous work implicating PS-expressing RBC membranes as the primary source of meizothrombin production in TF-activated whole blood. The mTAT generation therefore appears to represent a useful probe of red cell-dependent thrombin generation in pathologic states as well as in healthy controls. Future studies will be aimed at measuring the specific contribution of RBCs to overall thrombin generation in both ‘steady state’ and during crises, as well as the effect of hematocrit and RBC expression of PS in other hemolytic anemias.
Acknowledgments
This research was supported by National Institutes of Health P01HL046703 awarded to KGM.
Footnotes
Authorship Contributions: MFW performed all whole blood experiments and wrote the manuscript. MJM performed all flow cytometry and helped write the manuscript. KIA recruited patients and helped write the manuscript. VZ and RLB provided technical expertise. KGM and NSK participated in experimental design and helped write the manuscript.
Conflicts of Interest Disclosure: The authors have no conflicts of interest to declare.
References
- 1.Ballas SK, Smith ED. Red blood cell changes during the evolution of the sickle cell painful crisis. Blood. 1992;79(8):2154–63. [PubMed] [Google Scholar]
- 2.Hebbel RP, Osarogiagbon R, Kaul D. The endothelial biology of sickle cell disease: inflammation and a chronic vasculopathy. Microcirculation. 2004;11(2):129–51. [PubMed] [Google Scholar]
- 3.Frenette PS. Sickle cell vaso-occlusion: multistep and multicellular paradigm. Curr Opin Hematol. 2002;9(2):101–6. doi: 10.1097/00062752-200203000-00003. [DOI] [PubMed] [Google Scholar]
- 4.Chiu D, Lubin B, Shohet SB. Erythrocyte membrane lipid reorganization during the sickling process. Br J Haematol. 1979;41(2):223–34. doi: 10.1111/j.1365-2141.1979.tb05851.x. [DOI] [PubMed] [Google Scholar]
- 5.Zwaal RF, Schroit AJ. Pathophysiologic implications of membrane phospholipid asymmetry in blood cells. Blood. 1997;89(4):1121–32. [PubMed] [Google Scholar]
- 6.Setty BN, Rao AK, Stuart MJ. Thrombophilia in sickle cell disease: the red cell connection. Blood. 2001;98(12):3228–33. doi: 10.1182/blood.v98.12.3228. [DOI] [PubMed] [Google Scholar]
- 7.Whelihan MF, Zachary V, Orfeo T, Mann KG. Prothrombin activation in blood coagulation: the erythrocyte contribution to thrombin generation. Blood. 2012;120(18):3837–45. doi: 10.1182/blood-2012-05-427856. [DOI] [PMC free article] [PubMed] [Google Scholar]
- 8.Heldebrant CM, Butkowski RJ, Bajaj SP, Mann KG. The activation of prothrombin. II. Partial reactions, physical and chemical characterization of the intermediates of activation. J Biol Chem. 1973;248(20):7149–63. [PubMed] [Google Scholar]
- 9.Krishnaswamy S, Church WR, Nesheim ME, Mann KG. Activation of human prothrombin by human prothrombinase. Influence of factor Va on the reaction mechanism. J Biol Chem. 1987;262(7):3291–9. [PubMed] [Google Scholar]
- 10.Haynes LM, Bouchard BA, Tracy PB, Mann KG. Prothrombin activation by platelet-associated prothrombinase proceeds through the prethrombin-2 pathway via a concerted mechanism. J Biol Chem. 2012;287(46):38647–55. doi: 10.1074/jbc.M112.407791. [DOI] [PMC free article] [PubMed] [Google Scholar]
- 11.Mann KG. Thrombin generation in hemorrhage control and vascular occlusion. Circulation. 2011;124(2):225–35. doi: 10.1161/CIRCULATIONAHA.110.952648. [DOI] [PMC free article] [PubMed] [Google Scholar]
- 12.Kuypers FA, Lewis RA, Hua M, Schott MA, Discher D, Ernst JD, Lubin BH. Detection of altered membrane phospholipid asymmetry in subpopulations of human red blood cells using fluorescently labeled annexin V. Blood. 1996;87(3):1179–87. [PubMed] [Google Scholar]
- 13.Lim MY, Ataga KI, Key NS. Hemostatic abnormalities in sickle cell disease. Current Opinion in Hematology. 2013;20(5):472–7. doi: 10.1097/MOH.0b013e328363442f. [DOI] [PubMed] [Google Scholar]
- 14.Doyle MF, Haley PE. Meizothrombin: active intermediate formed during prothrombinase-catalyzed activation of prothrombin. Methods Enzymol. 1993;222:299–312. doi: 10.1016/0076-6879(93)22020-g. [DOI] [PubMed] [Google Scholar]