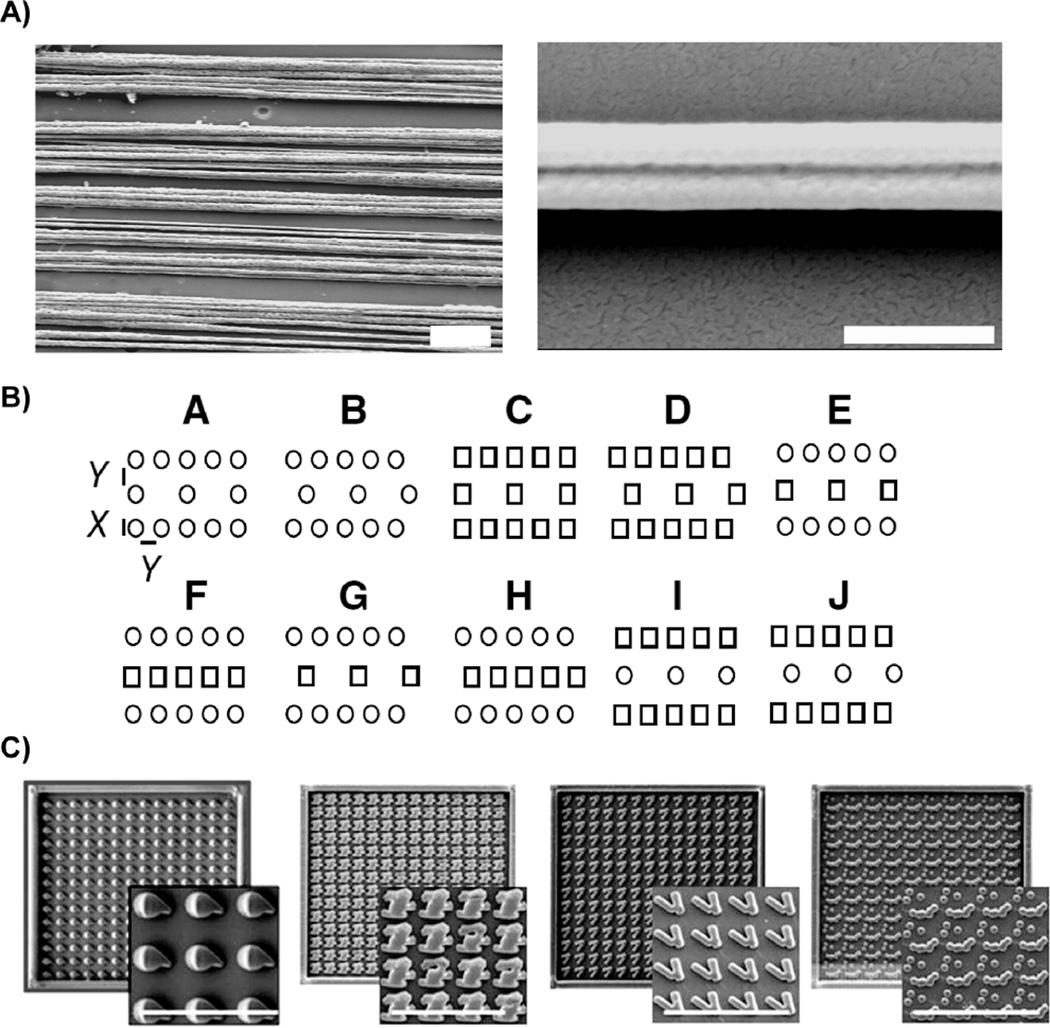
Figure 1.
Topographies which result in a given cellular outcome (increased proliferation) vary widely. Nanofibers similar to those shown in SEMs in (A) tend to favor reduced proliferation (Scale = 10 µm in left panel, 1 µm in higher magnification image in right panel). Markert et al. report that structures with narrow lateral dimensions (“X” = 1 micron) yielded the highest colony numbers for series “A-J” topographies, although the schematics illustrate a variety of feature patterns (B). SEM images of PLA surfaces with the greatest mesenchymal stem cell proliferation show a variety of surface features (C) (Scale = 50 µm). Part (B) is reproduced with permission from ref 78 Copyright 2009 Mary Ann Liebert. Part (C) is reproduced with permission from ref 82 Copyright 2011 National Academy of Sciences.

