Abstract
The lack of differentiation between viable and nonviable bacterial cells limits the implementation of PCR-based methods for routine diagnostic approaches. Recently, the combination of a quantitative real-time PCR (qPCR) and ethidium monoazide (EMA) or propidium monoazide (PMA) pretreatment has been described to circumvent this disadvantage. In regard to the suitability of this approach for Campylobacter spp., conflicting results have been reported. Thus, we compared the suitabilities of EMA and PMA in various concentrations for a Campylobacter viability qPCR method. The presence of either intercalating dye, EMA or PMA, leads to concentration-dependent shifts toward higher threshold cycle (CT) values, especially after EMA treatment. However, regression analysis resulted in high correlation coefficient (R2) values of 0.99 (EMA) and 0.98 (PMA) between Campylobacter counts determined by qPCR and culture-based enumeration. EMA (10 μg/ml) and PMA (51.10 μg/ml) removed DNA selectively from nonviable cells in mixed samples at viable/nonviable ratios of up to 1:1,000. The optimized EMA protocol was successfully applied to 16 Campylobacter jejuni and Campylobacter coli field isolates from poultry and indicated the applicability for field isolates as well. EMA-qPCR and culture-based enumeration of Campylobacter spiked chicken leg quarters resulted in comparable bacterial cell counts. The correlation coefficient between the two analytical methods was 0.95. Nevertheless, larger amounts of nonviable cells (>104) resulted in an incomplete qPCR signal reduction, representing a serious methodological limitation, but double staining with EMA considerably improved the signal inhibition. Hence, the proposed Campylobacter viability EMA-qPCR provides a promising rapid method for diagnostic applications, but further research is needed to circumvent the limitation.
INTRODUCTION
Campylobacter spp. are the most frequently reported cause of food-borne disease in the European Union and a major concern for public health (1). In 2010, more than 213,200 cases were reported in the European Union, and the Robert Koch Institute reported 48.56 confirmed cases per 100,000 inhabitants in Germany in 2011 (1, 2). Contaminated poultry meat and cross-contaminated food are known to be the major sources of infection and have been identified as significant risk factors (1–3). As the cultivation of Campylobacter spp. is time-consuming and unsuitable for detecting viable but nonculturable (VBNC) cells, PCR-based methods have been developed for the detection and quantification of thermophilic Campylobacter in food, feed, or fecal or water samples (4–8). However, the lack of differentiation between viable and nonviable cells (due to the persistence of DNA after cell death) is a crucial point that limits the implementation of these approaches for routine diagnostic applications, even if a rapid quantification method is urgently needed (9). To circumvent this disadvantage, intercalating dyes like ethidium monoazide (EMA) were applied to bacterial samples before PCR analysis, allowing a live/dead discrimination of some bacterial species (10). These dyes enter bacteria with damaged cell membranes and covalently bind to genomic DNA after photoactivation. As a consequence, the PCR amplification of DNA from dye-treated nonviable cells is inhibited and DNA is cleft or lost during the extraction process (10, 11). While satisfactory EMA-PCR results have been reported, e.g., for Escherichia coli and Salmonella enterica, inconsistent findings were obtained for Campylobacter jejuni, possibly depending on the strains or conditions tested (9, 11, 12). Since EMA is known to penetrate viable cells to some extent, the chemical substance propidium monoazide (PMA), which is more highly charged, was subsequently tested for its ability to differentiate between viable and nonviable cells. Results for various bacterial species, e.g., Listeria monocytogenes, Staphylococcus aureus, Salmonella enterica serovar Typhimurium, or Serratia marcescens, indicated an advantage of PMA over EMA, likely due to its reduced ability to penetrate live cells (13, 14). However, studies reporting the pretreatment of Campylobacter samples with intercalating dyes are rare (9, 15, 16) and do not include a direct comparison of EMA and PMA applications.
Therefore, the aim of the present study was to comparatively analyze the applicability of EMA and PMA at various concentrations to discriminate between viable and dead Campylobacter cells by quantitative real-time PCR (qPCR).
MATERIALS AND METHODS
Bacterial strains and species confirmation.
Reference strain C. jejuni DSM 4688 (Leibniz-Institut, Deutsche Sammlung von Mikroorganismen und Zellkulturen, Braunschweig, Germany) was used for the validation experiments. In addition, Campylobacter coli DSM 4689 (Leibniz-Institut) and 16 avian Campylobacter field isolates (7 of C. jejuni and 9 of C. coli), representing a part of the strain collection of the Institute for Food Quality and Food Safety, were recovered from −80°C storage and included in the study. Strains were cultivated for 24 h (or 48 h for a culture-based enumeration) on modified charcoal cefoperazone desoxycholate agar (CCDA) plates (Oxoid, Wesel, Germany) under microaerobic conditions (5% O2, 10% CO2, 85% N2). The incubation temperature was 41.5 ± 1°C. For species confirmation of the field isolates, a multiplex PCR assay targeting the 16S rRNA, mapA, and ceuE genes was performed (17).
Inactivation and culture-based enumeration of Campylobacter cells.
To determine the optimal temperature for heat inactivation, approximately 106 cells were suspended in 1 ml 0.9% NaCl and exposed to 60°C, 65°C, 70°C, and 75°C for 15 or 20 min in a water bath (GFL, Burgwedel, Germany), respectively. The killing efficiency was checked by plating 100-μl aliquots on at least 10 agar plates. Killing was assumed to be effective in the absence of visible growth after 48 h. Thus, a 15-min inactivation at 70°C was the best temperature-time combination completely inhibiting bacterial growth and was chosen for further experiments. Viable and nonviable cells were mixed subsequently in 1:1, 1:10, 1:100, and 1:1,000 ratios, as required. For the adjustment of Campylobacter cell concentrations and enumeration, four to five colonies were selected from an agar plate, transferred into a tube containing 0.9% saline solution, and adjusted to an 0.5 McFarland turbidity standard. The suspension was diluted in a 10-fold dilution series (up to 10−7), and ten 100-μl aliquots of each dilution step were streaked on CCDA plates, followed by 48 h of incubation at 41.5 ± 1.0°C under microaerobic conditions. CFU were counted from agar plates containing 1 to 300 colonies, and the weighted average was used for the calculation of cell counts.
EMA and PMA treatment of samples.
The intercalating dyes EMA (Invitrogen, Darmstadt, Germany) and PMA (VWR, Darmstadt, Germany) were dissolved in 20% dimethyl sulfoxide (DMSO), stored at −20°C until needed, and added to samples to final concentrations of 10 μg/ml (23.81 μmol/liter) EMA and 100 μg/ml (238.10 μmol/liter) EMA or 25.55 μg/ml (50 μmol/liter) PMA and 51.10 μg/ml (100 μmol/liter) PMA, respectively. These concentrations have previously been reported to be suitable for quantification of viable cells (9, 18–20). Samples were incubated for 15 min in the dark at 22 ± 1°C under frequent shaking before being placed in an iced cooling box. Subsequently, the tubes were exposed for 15 min to a 500-W halogen lamp light source (Düwi type R7s; REV Ritter, Mömbris, Germany) with 20-cm spacing from the lamp to photoinduce cross-linking of the intercalating dye.
DNA isolation and qPCR experiments.
Genomic DNA was extracted by using the DNeasy blood and tissue kit (Qiagen, Hilden, Germany) according to the manufacturer′s instructions. For quantitative real-time PCR (qPCR) detection of Campylobacter, the commercially available SureFood Pathogen Campylobacter Plus LC kit (Congen, Berlin, Germany) was used. This kit detects the three major food-borne species C. jejuni, C. coli, and Campylobacter lari by targeting the 16S rRNA gene and amplifying a 287-bp fragment. Each real-time PCR was performed in a 25-μl volume containing 18.6 μl Campylobacter Plus LC reaction mix, 1.1 μl fluorescence detection setup (FDE), 0.3 μl Taq polymerase, and 5 μl of template DNA. PCR conditions were 60 s at 95°C, followed by 45 cycles of 95°C for 10 s and 60°C for 15 s. All assays included positive, negative, extraction, and internal amplification controls. The qPCR experiments were carried out with a LightCycler 480 system (Roche Diagnostics, Mannheim, Germany), and the instrument software was used to define the threshold cycle (CT) values using the second derivative method. Three independent experiments were performed.
Determination of the signal reduction from nonviable cells.
Tenfold dilution series of heat-inactivated C. jejuni DSM 4688 starting from 2.34 × 10⁷ to 2.99 × 10⁷ cells were treated with 10 μg/ml EMA, 100 μg/ml EMA, 25.55 μg/ml PMA, and 51.10 μg/ml PMA, respectively, as described above. Subsequently, DNA was extracted and a qPCR detection was carried out. In addition, a double staining of heat-inactivated cells with EMA was performed. For this, aliquots of the serial dilutions were pretreated with EMA to a final concentration of 10 μg/ml, and after photoinduced cross-linking of the dye to DNA and accompanied inactivation of unbound EMA (10), the cell suspension was immediately subjected to a second EMA staining step using the final concentration of 10 μg/ml EMA. Further proceedings followed the standard protocol. For control purposes, nontreated aliquots of each serial dilution of heat-killed Campylobacter cells were used.
Chicken samples and spiking.
Chicken leg quarters were purchased from a local supermarket and stored at −20°C until processing. Samples were tested for Campylobacter prior to experiments and spiked with various amounts (CFU/ml) of viable, heat-killed, or mixed (1:10, 1:100, and 1:1,000 live/dead ratios) Campylobacter cells. Suspensions were spread on the surface of the chicken quarters and incubated for 20 min at room temperature. Bacteria were resuspended by shaking the chicken legs for 2 min in a sterile plastic bag containing 100 ml of 0.9% NaCl. Cell suspensions were subjected to qPCR and, after being diluted in a 10-fold dilution series, to culture-based enumeration as described above.
Statistical analyses.
The slope (S) of the standard curve, calculated from a 10-fold dilution series of C. jejuni, plotted against qPCR CT values was used to estimate the PCR efficiency (E) according to the formula E = 10(−1/S) − 1. The LightCycler software (Roche) was used for data analysis. To calculate a relation between cell numbers calculated from real-time PCR assay results and plate counts, the Pearson correlation analysis was performed. In addition, the Bland-Altman analysis was used for method comparisons as proposed by Grouven et al. (21). For a comparison of mathematically calculated values and experimentally obtained values, the two-way analysis of variance (ANOVA) Sidak multiple comparison test was used. All statistical analyses were performed using the software GraphPad Prism6 (GraphPad Software, San Diego, CA).
RESULTS
Campylobacter qPCR assay and effects of EMA and PMA treatment on qPCR amplification.
For the standard curve obtained from 10-fold serial dilutions of C. jejuni DSM 4688 without EMA or PMA pretreatment in relation to CT values, the linear regression slope was −3.3493 with a correlation coefficient (R2) value of 0.997. The PCR efficiency corresponded to 98.9%. Over a range of 1.85 × 10² to 1.85 × 10⁸ CFU/ml, the curve shape was linear and the limit of quantification for this method was set as 102 CFU/ml. To investigate a shift in CT values due to EMA or PMA sample treatment, amplification curves obtained from approximately 1.9 × 10⁵ to 2.6 × 10⁶ C. jejuni CFU/ml with and without the addition of EMA or PMA were compared, and results represented from three independent experiments. Control samples included DMSO at a final concentration of 2%. In the presence of either intercalating dyes or DMSO, the CT values increased compared to untreated cells and higher concentrations of EMA or PMA resulted in a more prominent shift (Fig. 1).
FIG 1.
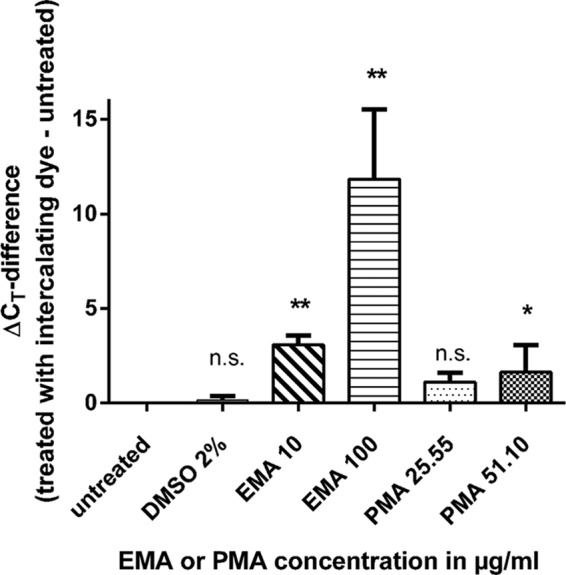
Differences in CT values between qPCR results from approximately 2 × 10⁶ Campylobacter cells pretreated with either an intercalating dye or the solvent DMSO, 2% (vol/vol), in relation to untreated cells. Results are shown as averages from three independent experiments. Significant differences compared with untreated cells are indicated by asterisks (ANOVA; *, P < 0.05; **, P < 0.005; n.s., not significant).
Differentiation between viable and heat-killed cells in mixed samples.
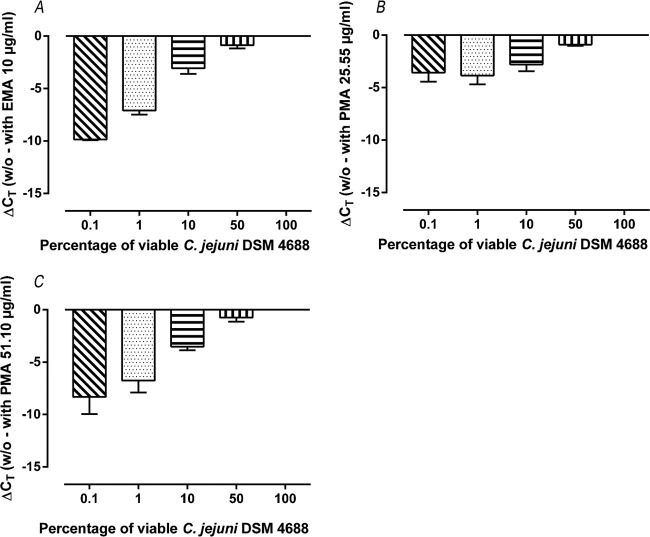
To compare the abilities of EMA and PMA to differentiate between viable and nonviable Campylobacter cells, different mixtures of live and heat-killed cells (1:1, 1:10, 1:100, and 1:1,000 ratios corresponding to 50%, 10%, 1%, and 0.1% viable cells, respectively) were subjected to qPCR analysis. For this, approximately 2.6 × 10⁴ CFU/ml viable cells or live/dead mixtures were either EMA or PMA treated or not. The difference between a CT value obtained from a nontreated sample and the CT value obtained from a pretreated sample was calculated and designated qPCR signal reduction as proposed by Nocker et al. (22). The signal reduction (negative value) is shown as an average of three independent qPCR runs in Fig. 2. The high shift of CT values after 100-μg/ml EMA sample treatment led to an exclusion of this EMA concentration from the further experimental setup. For all dyes and concentrations tested, an increasing amount of nonviable cells resulted in an increase in signal reduction, with the only exception being 25.55 μg/ml PMA. At this concentration, PMA did not lead to a signal reduction in mixing ratios below <10% viable cells (Fig. 2). A comparison between the experimentally determined signal reductions and the theoretical value (linear regression slope of −3.32) by Pearson regression analysis and two-way ANOVA Sidak multiple comparison test demonstrated similar equations after pretreatment with 10 μg/ml EMA (slope, −3.27) or 51.10 μg/ml PMA (slope, −2.97) without significant differences between the values, whereas the use of PMA at a concentration of 25.55 μg/ml resulted in a remarkable deviation (slope, −1.24) from the mathematically expected value.
FIG 2.
Signal reduction of qPCR experiments, defined as difference between CT values obtained from a sample without pretreatment with an intercalating dye (w/o) and the CT value derived from the respective sample pretreated with an intercalating dye. Results are shown as averages from three independent runs using 10 μg/ml EMA (A), 25.55 μg/ml PMA (B), or 51.10 μg/ml PMA (C). For all experiments, C. jejuni DSM 4688 was used and analyses were carried out using various percentages of viable cells.
Limits of the EMA or PMA signal reduction from nonviable cells.
Experiments using serial dilutions of approximately 107 to 102 heat-inactivated cells demonstrated a sufficient signal reduction (defined as rounded CT value of >35) for the dyes and concentrations tested (10 μg/ml EMA, 25.55 μg/ml PMA, and 51.10 μg/ml PMA) if a limit of approximately 104 nonviable cells was not exceeded (Fig. 3). Signals from samples containing 105 cells were adequately inhibited only by PMA, whereas larger amounts of heat-inactivated cells (>106) remained detectable independently of the dye and concentration used. However, the signals from all heat-inactivated samples were reduced considerably (on average, 5.51 to 9.85 CT values) compared to the nontreated controls. A double staining with EMA clearly improved the signal reduction and resulted in CT values above the defined detection limit of >35 (Fig. 3), if fewer than 106 inactivated cells were analyzed.
FIG 3.
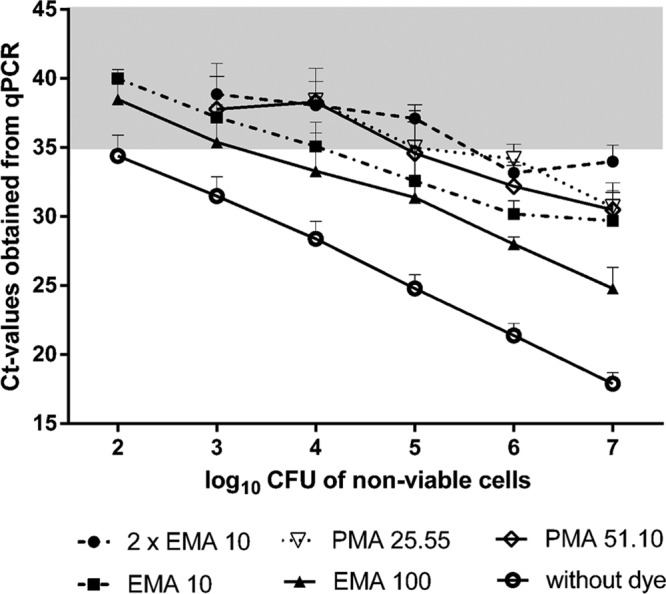
CT values obtained from qPCR experiments of 10-fold serial dilutions of heat-inactivated C. jejuni DSM 4688. Cells were pretreated with 10 μg/ml EMA, 100 μg/ml EMA, 25.55 μg/ml PMA, or 51.10 μg/ml PMA or double stained with 10 μg/ml EMA. Results are shown as averages from three independent experiments. The absence of symbols indicates a complete inhibition of qPCR signals. The gray background represents the defined detection limit of >35 CT values.
Standard curves using EMA and PMA.
Standard curves were repeated three times independently in the presence of either of the intercalating dyes EMA at 10 μg/ml and PMA at 51.10 μg/ml, to investigate the constancy and the linearity of the CT shift caused by the pretreatment of bacterial samples. In the presence of both EMA and PMA, the curves achieved high correlation coefficients (R2) of 0.997 (control, EMA) or 0.989 (PMA), respectively. As shown in Fig. 4, the CT shift remains constant in the presence of 10 μg/ml EMA, and linear plots were obtained when CT values were plotted against log10 numbers of viable CFU. In the case of 51.10 μg/ml PMA, the CT signal reduction depended on the concentration of CFU/ml and increasing amounts of cells/ml resulted in lower values. Although the correlation line was shifted, the slopes of the EMA and the control line were comparable (−3.346 and −3.349) and differed from that of PMA (−3.603). Therefore, EMA (10 μg/ml) was used for the subsequent experiments. However, to prevent incorrect results due to the CT shift of pretreated Campylobacter samples, an internal DNA standard was chosen from the EMA-treated cells and was used along with the adapted standard curve for the subsequent experiments in this study.
FIG 4.
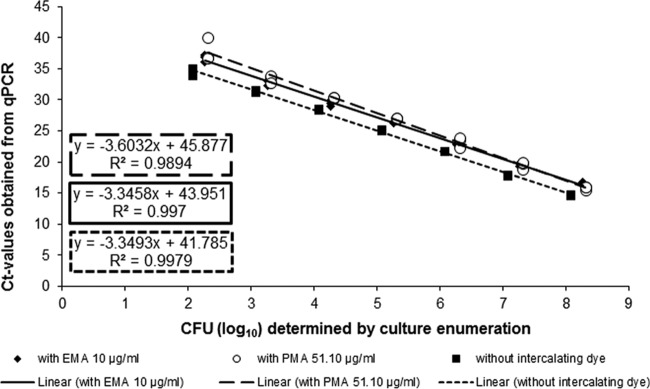
qPCR standard curves obtained from 10-fold dilution series of cell suspensions from Campylobacter jejuni DSM 4688 in the presence or absence of EMA at 10 μg/ml or PMA at 51.10 μg/ml. Experiments were repeated three times independently. The equation of the regression curves and the R2 values are indicated.
Relation between qPCR results and microbiological cell counts.
The amounts of viable Campylobacter cells were quantified in parallel by qPCR and by culture-based enumeration. For this, the reference strains C. jejuni DSM 4688 and C. coli DSM 4689 as well as 16 field isolates were used. The CT values obtained from qPCR analysis using the optimized protocol were plotted against the enumerated CFU (Fig. 5). A linear relationship (R2 = 0.947) was calculated, and the line had a slope of 1.029. Considering the Bland-Altman plot, the mean difference in log10 CFU was −0.047 with a standard deviation (SD) of 0.461. The 95% limits of agreement were 0.856 (upper limit) and −0.951 (lower limit) from overall mean differences. Except for one different point located outside the detection limit, all other points were within the 95% limit, indicating that there is generally agreement between the methods (Fig. 5). Subsequently, mixtures (up to 1:1,000 ratios) of viable and nonviable cells (C. jejuni DSM 4688) were also subjected to a comparative Bland-Altman analysis of the two quantification methods as described above. Similar to results from viable cells, there was a linear relationship between the results obtained from the two methods (R2 = 0.99; slope, 1.022). The mean difference calculated from a Bland-Altman plot was −0.136 ± 0.175 (SD) CFU (log10), and the 95% limit of agreement was 0.479 to −0.207 CFU (log10) (data not shown).
FIG 5.
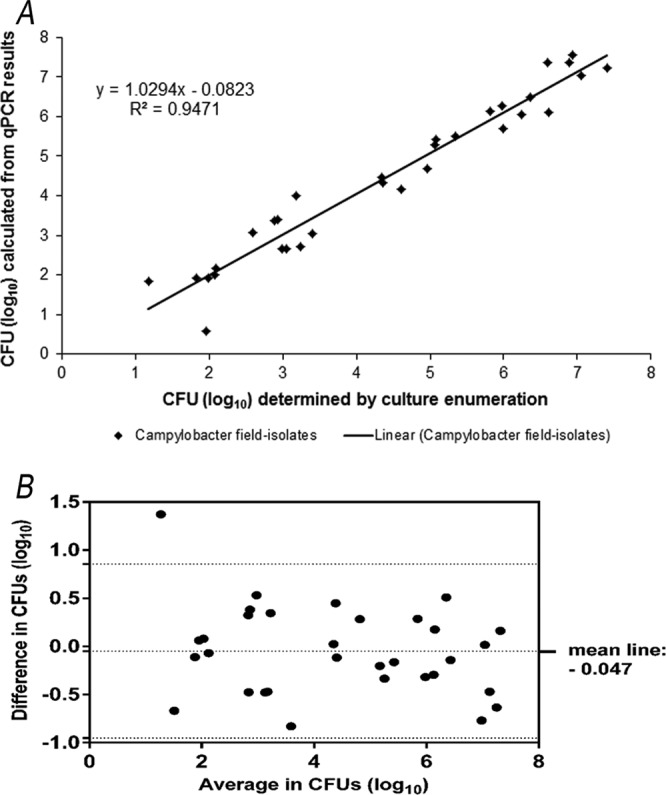
Correlation between Campylobacter cell counts of 16 field isolates plus reference strains C. jejuni DSM 4688 and C. coli DSM 4689 calculated from EMA-qPCR results and bacteriological enumeration and demonstrated by a scatter plot (A) and Bland-Altman plot for CFU determined by enumeration and qPCR results (B). In panel B, the middle line represents the mean difference of methods. Dotted lines above and below represent 95% limits of agreement.
Analysis of viable cells from spiked chicken samples.
Since poultry meat and cross-contamination in the kitchen are the major sources of human infection, the applicability of the EMA-qPCR was tested for the quantification of viable Campylobacter from poultry products. For this, chicken leg quarters were spiked with different quantities (range, 0 to 106 CFU/ml) of C. jejuni or C. coli field isolates or reference strains. Bacteria were rinsed out from chicken samples and investigated by EMA-qPCR and microbiological cell enumeration. It should be noted that chicken leg quarters used for these experiments were naturally contaminated with Campylobacter cells, ranging from 102 to 103 cells/chicken leg quarter (data not shown), and thus, a broader spectrum of cell injury and membrane damage was assumed to be present on the food samples after thawing.
For samples spiked only with viable cells, the results calculated from real-time PCR signals were in good accordance (R2 = 0.95; slope, 1.221) with the reference method (data not shown). Bland-Altman analysis revealed a high agreement between results from the two methods. (The mean difference was −0.648 ± 0.564 [SD] CFU [log10], and the 95% limit of agreement was 0.458 to −1.754 CFU [log10] [data not shown]).
In a next step, mixtures with defined ratios of viable and heat-killed DSM 4688 cells (approximately 105 CFU) were used for spiking experiments. The qPCR-based quantification of Campylobacter without EMA detected a relatively constant number of CFU isolated from the spiked samples (mean, 5.160 ± 0.117 [SD] log10 CFU), independent of the percentage of viable cells (Fig. 6). In contrast, the EMA-qPCR signals (CT values) increased as the ratio of heat-killed cells increased. This correlation is reflected in a high R2 value of 0.840 and a slope of 0.966 obtained from a plot of log10 cell counts determined by EMA-qPCR versus culture enumeration (Fig. 6). Results from a Bland-Altman plot showed a low variation between the methods. The mean difference in log10 CFU was 0.214. The lower and upper limits (±0.462 [SD] from the mean difference) of the plot were 1.119 and −0.691, respectively.
FIG 6.
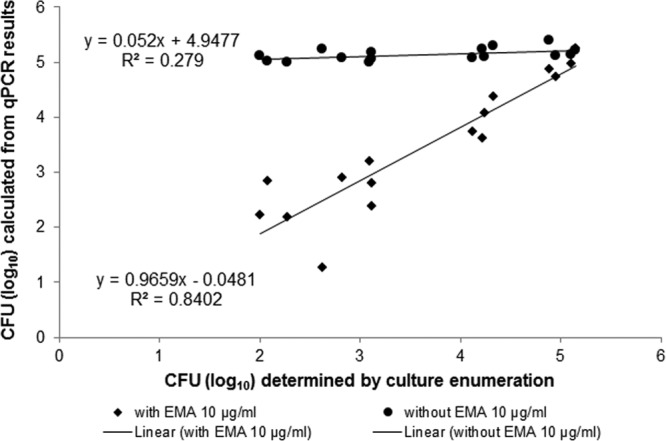
Scatter plot demonstrating the correlation and the difference between log10 numbers of Campylobacter CFU/ml determined either by viability EMA-qPCR or by qPCR without EMA versus the bacterial culture method. Bacteria were rinsed from spiked chicken leg quarters, whereby the total number of spiked Campylobacter organisms was kept at approximately 105 cells, independent of the ratio of viable/nonviable cells. Results were shown for C. jejuni reference strain DSM 4688.
DISCUSSION
The development of rapid methods for the detection and quantification of Campylobacter is of particular importance in food production and control and might be a step forward toward a reduction of human campylobacteriosis cases. Therefore, PCR, qPCR, or reverse transcription-PCR (RT-PCR) methods for the detection and/or quantification of Campylobacter have been developed and validated during recent years (5, 23–25). In addition, EMA or PMA pretreatment of bacterial samples was implemented to circumvent the amplification of DNA from nonviable cells (9, 15, 16, 26, 27).
In this study, the effects of the intercalating dyes EMA and PMA and their aptitude for a Campylobacter qPCR approach were comparatively analyzed. Any application of viable cells with these chemical substances or even the solvent DMSO at 2% (vol/vol) resulted in an increase of CT values compared to untreated cells. The extent of the CT shift depended on the concentrations tested (Fig. 1) and, as has been expected from previous studies, e.g., on E. coli O157:H7, Listeria monocytogenes, or Enterobacter sakazakii, was higher after EMA treatment (14, 19, 27). The characteristic of EMA of penetrating through intact cell membranes of viable cells is most likely the reason for this observation (28). Unlike some studies, e.g., on Enterobacter sakazakii, Staphylococcus aureus, Listeria monocytogenes, or E. coli O157:H7, showing no significant difference in PCR yields after PMA treatment compared to untreated cells (19, 27), we detected significantly higher CT values (P < 0.05) after 51.10-μg/ml PMA application, showing that PMA in an applicable concentration penetrates membranes of viable cells as well. However, this observation may apply only to Campylobacter and/or selected species.
Our results indicated that the capacities of EMA-qPCR (10 μg/ml) and PMA-qPCR (51.10 μg/ml) to amplify DNA exclusively from viable Campylobacter cells in defined live/dead mixed ratios were comparable. The live/dead differentiation of both dyes is based on the membrane integrity of cells, and in this study, the cultivability of the bacteria on agar plates was used as a viability control. Nevertheless, it has to be taken into account that other criteria for live/dead differentiation (e.g., energy status, metabolic activity, and RNA degradation) can be applied and other inactivation methods for cells can be used (e.g., UV exposure) and may lead to deviating findings (10, 11, 28, 29). The effective reduction of signals from dead cells was shown to be concentration dependent. More precisely, PMA at a concentration of 25.55 μg/ml did not generate satisfactory qPCR results if mixed ratios below 10% viable cells were tested (Fig. 2B). Hence, our findings are in good accordance with studies on Bacteroides (30) or protozoans (31) and underline the conclusions drawn by Fittipaldi et al. (28). They reported that higher PMA concentrations may be considered to improve the signal suppression from nonviable cells, whereas lower EMA concentrations may compensate for the inability of the dye to penetrate into viable bacterial cells. Due to the considerably lower cost of EMA than of PMA and the lack of a comparative advantage, EMA could be preferred for routine diagnostic approaches and was used for most aspects of the subsequent work.
As PCR standard curves in the presence of EMA or PMA shifted toward higher CT values, it was indicated to use a standard curve generated with EMA-pretreated cells for the purpose of a viability qPCR. Using this adapted standard curve, the EMA-qPCR provided results approximately equivalent to those of the culture-based technique as demonstrated by Bland-Altman and regression analyses, with only slight differences in assessed values depending on the strains and the live or dead/live cell mixtures that were investigated. This held true not only for C. jejuni and C. coli field isolates and reference strains from pure cultures but also for a quantitative analysis of Campylobacter from spiked chicken samples, implying that the two methods may be used interchangeably. It is important to mention that some chicken leg quarters, even if stored in a freezer, were naturally contaminated with approximately 102 to 103 Campylobacter cells (data not shown); however, this contamination and exposure of some cells to environmental stress, probably leading to a spectrum of cell injury, did not affect the correlation between culture-based enumeration and EMA-qPCR results. However, further studies on Campylobacter cells cultivated for longer times or exposed to environmental stresses would complete the validation of the method.
Nevertheless, experiments with serial dilutions of heat-inactivated Campylobacter cells demonstrated the limits of EMA or PMA pretreatment of cells. Both dyes failed to sufficiently (defined as CT value of >35) suppress signals from ≥105 nonviable cells and revealed the deficiencies of the method. These findings were in good accordance with observations recently made by Pacholewicz et al. (32), who detected an insufficient PMA effect in samples containing more than 104 dead cells. Whether an incomplete signal inhibition renders any application of an EMA- or PMA-qPCR assay impossible for routine diagnostic approaches may be interpreted in different ways. A comparison of qPCR results (genome copies) with culture-based enumeration of Campylobacter counts at several food processing steps in a slaughterhouse detected differences below 103, pointing toward a relatively small amount of dead or membrane-damaged cells present on naturally contaminated food samples (32). However, the use of longer amplicon target sizes, >1,500 bp, as recently proposed for a PMA-qPCR detection of Campylobacter (33), or a double staining with EMA, as shown in this study, is a possible option that may effectively reduce signals from membrane-damaged cells. To circumvent the disadvantages of EMA-qPCR, these options should be addressed in future Campylobacter qPCR research.
In conclusion, EMA as well as PMA seems to be useful for a viable/nonviable differentiation of Campylobacter cells from food samples containing fewer than 104 nonviable cells, but further studies are needed to overcome the limitations of these methods.
ACKNOWLEDGMENTS
We thank Sina Hoffmann for excellent technical assistance.
This study was supported by the Sanitätsamt der Bundeswehr (grant M/SAB X/9A006).
Footnotes
Published ahead of print 31 January 2014
REFERENCES
- 1.European Food Safety Authority and European Centre for Disease Prevention and Control. 2012. Scientific report of EFSA and ECDC: the European Union summary report on trends and sources of zoonoses, zoonotic agents and food-borne outbreaks in 2010. EFSA J. 10:2597 http://www.efsa.europa.eu/de/efsajournal/doc/2597.pdf [Google Scholar]
- 2.Robert Koch-Institut. 2012. Infektionsepidemiologisches Jahrbuch für 2011. http://www.rki.de/DE/Content/Infekt/Jahrbuch/Jahrbuch_2011.pdf?__blob=publicationFile. [Google Scholar]
- 3.Nielsen EM, Fussing V, Engberg J, Nielsen NL, Neimann J. 2006. Most Campylobacter subtypes from sporadic infections can be found in retail poultry products and food animals. Epidemiol. Infect. 134:758–767. 10.1017/S0950268805005509 [DOI] [PMC free article] [PubMed] [Google Scholar]
- 4.Mayr AM, Lick S, Bauer J, Thärigen D, Busch U, Huber I. 2010. Rapid detection and differentiation of Campylobacter jejuni, Campylobacter coli, and Campylobacter lari in food, using multiplex real-time PCR. J. Food Prot. 73:241–250 [DOI] [PubMed] [Google Scholar]
- 5.Toplak N, Kovač M, Piskernik S, Možina SS, Jeršek B. 2012. Detection and quantification of Campylobacter jejuni and Campylobacter coli using real-time multiplex PCR. J. Appl. Microbiol. 112:752–764. 10.1111/j.1365-2672.2012.05235.x [DOI] [PubMed] [Google Scholar]
- 6.Leblanc-Maridor M, Beaudeau F, Seegers H, Denis M, Belloc C. 2011. Rapid identification and quantification of Campylobacter coli and Campylobacter jejuni by real-time PCR in pure cultures and in complex samples. BMC Microbiol. 11:113. 10.1186/1471-2180-11-113 [DOI] [PMC free article] [PubMed] [Google Scholar]
- 7.Bui XT, Wolff A, Madsen M, Bang DD. 2012. Reverse transcriptase real-time PCR for detection and quantification of viable Campylobacter jejuni directly from poultry faecal samples. Res. Microbiol. 163:64–72. 10.1016/j.resmic.2011.10.007 [DOI] [PubMed] [Google Scholar]
- 8.Tissier A, Denis M, Hartemann P, Gassilloud B. 2012. Development of a rapid and sensitive method combining a cellulose ester microfilter and a real-time quantitative PCR assay to detect Campylobacter jejuni and Campylobacter coli in 20 liters of drinking water or low-turbidity waters. Appl. Environ. Microbiol. 78:839–845. 10.1128/AEM.06754-11 [DOI] [PMC free article] [PubMed] [Google Scholar]
- 9.Rudi K, Moen B, Drømtorp SM, Holck AL. 2005. Use of ethidium monoazide and PCR in combination for quantification of viable and dead cells in complex samples. Appl. Environ. Microbiol. 71:1018–1024. 10.1128/AEM.71.2.1018-1024.2005 [DOI] [PMC free article] [PubMed] [Google Scholar]
- 10.Cenciarini-Borde C, Courtois S, La Scola B. 2009. Nucleic acids as viability markers for bacteria detection using molecular tools. Future Microbiol. 4:45–64. 10.2217/17460913.4.1.45 [DOI] [PubMed] [Google Scholar]
- 11.Nocker A, Camper AK. 2006. Selective removal of DNA from dead cells of mixed bacterial communities by use of ethidium monoazide. Appl. Environ. Microbiol. 72:1997–2004. 10.1128/AEM.72.3.1997-2004.2006 [DOI] [PMC free article] [PubMed] [Google Scholar]
- 12.Flekna G, Stefanic P, Wagner M, Smulders FJ, Mozina SS, Hein I. 2007. Insufficient differentiation of live and dead Campylobacter jejuni and Listeria monocytogenes cells by ethidium monoazide (EMA) compromises EMA/real-time PCR. Res. Microbiol. 158:405–412. 10.1016/j.resmic.2007.02.008 [DOI] [PubMed] [Google Scholar]
- 13.Nocker A, Sossa KE, Camper AK. 2007. Molecular monitoring of disinfection efficacy using propidium monoazide in combination with quantitative PCR. J. Microbiol. Methods 70:252–260. 10.1016/j.mimet.2007.04.014 [DOI] [PubMed] [Google Scholar]
- 14.Pan Y, Breidt F., Jr 2007. Enumeration of viable Listeria monocytogenes cells by real-time PCR with propidium monoazide and ethidium monoazide in the presence of dead cells. Appl. Environ. Microbiol. 73:8028–8031. 10.1128/AEM.01198-07 [DOI] [PMC free article] [PubMed] [Google Scholar]
- 15.Josefsen MH, Löfström C, Hansen TB, Christensen LS, Olsen JE, Hoorfar J. 2010. Rapid quantification of viable Campylobacter bacteria on chicken carcasses, using real-time PCR and propidium monoazide treatment, as a tool for quantitative risk assessment. Appl. Environ. Microbiol. 76:5097–5104. 10.1128/AEM.00411-10 [DOI] [PMC free article] [PubMed] [Google Scholar]
- 16.He Y, Chen CY. 2010. Quantitative analysis of viable, stressed and dead cells of Campylobacter jejuni strain 81-176. Food Microbiol. 27:439–446. 10.1016/j.fm.2009.11.017 [DOI] [PubMed] [Google Scholar]
- 17.Denis M, Refrégier-Petton J, Laisney MJ, Ermel G, Salvat G. 2001. Campylobacter contamination in French chicken production from farm to consumers. Use of a PCR assay for detection and identification of Campylobacter jejuni and Camp. coli. J. Appl. Microbiol. 91:255–267. 10.1046/j.1365-2672.2001.01380.x [DOI] [PubMed] [Google Scholar]
- 18.Agustí G, Codony F, Fittipaldi M, Adrados B, Morató J. 2010. Viability determination of Helicobacter pylori using propidium monoazide quantitative PCR. Helicobacter 15:473–476. 10.1111/j.1523-5378.2010.00794.x [DOI] [PubMed] [Google Scholar]
- 19.Cawthorn DM, Witthuhn RC. 2008. Selective PCR detection of viable Enterobacter sakazakii cells utilizing propidium monoazide or ethidium bromide monoazide. J. Appl. Microbiol. 105:1178–1185. 10.1111/j.1365-2672.2008.03851.x [DOI] [PubMed] [Google Scholar]
- 20.Wang L, Mustapha A. 2010. EMA-real-time PCR as a reliable method for detection of viable Salmonella in chicken and eggs. J. Food Sci. 75:M134–M139. 10.1111/j.1750-3841.2010.01525.x [DOI] [PubMed] [Google Scholar]
- 21.Grouven U, Bender R, Ziegler A, Lange S. 2007. Comparing methods of measurement. Dtsch. Med. Wochenschr. 132(Suppl 1):e69–73. 10.1055/s-2007-959047 [DOI] [PubMed] [Google Scholar]
- 22.Nocker A, Sossa-Fernandez P, Burr MD, Camper AK. 2007. Use of propidium monoazide for live/dead distinction in microbial ecology. Appl. Environ. Microbiol. 73:5111–5117. 10.1128/AEM.02987-06 [DOI] [PMC free article] [PubMed] [Google Scholar]
- 23.Botteldoorn N, Van Coillie E, Piessens V, Rasschaert G, Debruyne L, Heyndrickx M, Herman L, Messens W. 2008. Quantification of Campylobacter spp. in chicken carcass rinse by real-time PCR. J. Appl. Microbiol. 105:1909–1918. 10.1111/j.1365-2672.2008.03943.x [DOI] [PubMed] [Google Scholar]
- 24.Best EL, Powell EJ, Swift C, Grant KA, Frost JA. 2003. Applicability of a rapid duplex real-time PCR assay for speciation of Campylobacter jejuni and Campylobacter coli directly from culture plates. FEMS Microbiol. Lett. 229:237–241. 10.1016/S0378-1097(03)00845-0 [DOI] [PubMed] [Google Scholar]
- 25.Rodgers JD, Lawes JR, Vidal AB, Ellis-Iversen J, Ridley A, Pleydell EJ, Powell LF, Toszeghy M, Stapleton K, Clifton-Hadley FA. 2012. Characteristics and comparative performance of direct culture, direct PCR and enumeration methods for detection and quantification of Campylobacter spp. in broiler caeca. Vet. Microbiol. 159:390–396. 10.1016/j.vetmic.2012.04.011 [DOI] [PubMed] [Google Scholar]
- 26.Chang B, Taguri T, Sugiyama K, Amemura-Maekawa J, Kura F, Watanabe H. 2010. Comparison of ethidium monoazide and propidium monoazide for the selective detection of viable Legionella cells. Jpn. J. Infect. Dis. 63:119–123 [PubMed] [Google Scholar]
- 27.Nocker A, Cheung CY, Camper AK. 2006. Comparison of propidium monoazide with ethidium monoazide for differentiation of live vs. dead bacteria by selective removal of DNA from dead cells. J. Microbiol. Methods 67:310–320. 10.1016/j.mimet.2006.04.015 [DOI] [PubMed] [Google Scholar]
- 28.Fittipaldi M, Nocker A, Codony F. 2012. Progress in understanding preferential detection of live cells using viability dyes in combination with DNA amplification. J. Microbiol. Methods 91:276–289. 10.1016/j.mimet.2012.08.007 [DOI] [PubMed] [Google Scholar]
- 29.Nocker A, Camper AK. 2009. Novel approaches toward preferential detection of viable cells using nucleic acid amplification techniques. FEMS Microbiol. Lett. 291:137–142. 10.1111/j.1574-6968.2008.01429.x [DOI] [PubMed] [Google Scholar]
- 30.Bae S, Wuertz S. 2009. Discrimination of viable and dead fecal Bacteroidales bacteria by quantitative PCR with propidium monoazide. Appl. Environ. Microbiol. 75:2940–2944. 10.1128/AEM.01333-08 [DOI] [PMC free article] [PubMed] [Google Scholar]
- 31.Brescia CC, Griffin SM, Ware MW, Varughese EA, Egorov AI, Villegas EN. 2009. Cryptosporidium propidium monoazide-PCR, a molecular biology-based technique for genotyping of viable Cryptosporidium oocysts. Appl. Environ. Microbiol. 75:6856–6863. 10.1128/AEM.00540-09 [DOI] [PMC free article] [PubMed] [Google Scholar]
- 32.Pacholewicz E, Swart A, Lipman LJ, Wagenaar JA, Havelaar AH, Duim B. 2013. Propidium monoazide does not fully inhibit the detection of dead Campylobacter on broiler chicken carcasses by qPCR. J. Microbiol. Methods 95:32–38. 10.1016/j.mimet.2013.06.003 [DOI] [PubMed] [Google Scholar]
- 33.Banihashemi A, Van Dyke MI, Huck PM. 2012. Long-amplicon propidium monoazide PCR enumeration assay to detect viable Campylobacter and Salmonella. J. Appl. Microbiol. 113:863–873. 10.1111/j.1365-2672.2012.05382.x [DOI] [PubMed] [Google Scholar]


