

Abstract
The harvesting of rainwater is gaining acceptance among many governmental authorities in countries such as Australia, Germany, and South Africa, among others. However, conflicting reports on the microbial quality of harvested rainwater have been published. To monitor the presence of potential pathogenic bacteria during high-rainfall periods, rainwater from 29 rainwater tanks was sampled on four occasions (during June and August 2012) in a sustainable housing project in Kleinmond, South Africa. This resulted in the collection of 116 harvested rainwater samples in total throughout the sampling period. The identities of the dominant, indigenous, presumptive pathogenic isolates obtained from the rainwater samples throughout the sampling period were confirmed through universal 16S rRNA PCR, and the results revealed that Pseudomonas (19% of samples) was the dominant genus isolated, followed by Aeromonas (16%), Klebsiella (11%), and Enterobacter (9%). PCR assays employing genus-specific primers also confirmed the presence of Aeromonas spp. (16%), Klebsiella spp. (47%), Legionella spp. (73%), Pseudomonas spp. (13%), Salmonella spp. (6%), Shigella spp. (27%), and Yersinia spp. (28%) in the harvested rainwater samples. In addition, on one sampling occasion, Giardia spp. were detected in 25% of the eight tank water samples analyzed. This study highlights the diverse array of pathogenic bacteria that persist in harvested rainwater during high-rainfall periods. The consumption of untreated harvested rainwater could thus pose a potential significant health threat to consumers, especially children and immunocompromised individuals, and it is recommended that harvested rainwater be treated for safe usage as an alternative water source.
INTRODUCTION
Rainwater harvesting (RWH) has been described as an alternative improved water source, as this technology could assist in the provision of water directly to households for drinking and domestic purposes (1). Communities are also able to capture and store rainwater for utilization in small-scale productive activities, such as vegetable gardening, which could make a positive contribution toward food security for individuals from lower socioeconomic groups (2). In addition, low economic growth and the effects of climate change have compelled many governments and water authorities worldwide to rely on the process of harvesting rainwater as an alternative source of water (3).
A limited number of qualitative studies (4) have been conducted on the usage of rainwater for domestic and potable purposes, and while some studies have determined that harvested rainwater is safe for drinking purposes without prior treatment (5, 6), a few studies have, however, shown that harvested rainwater is, in fact, not suitable for potable purposes (7, 8, 9, 10, 11). As rainwater is collected from roof surfaces, pathogenic organisms that are found in bird feces, insects, mammals, reptiles, and other debris may be flushed into the tanks via the gutters and the tank inlet systems. This phenomenon could pose serious human health risks (12), and between 1978 and 2006, six incidents of disease related to rainwater were reported (10, 13, 14).
Indicator organisms, such as fecal coliforms and Escherichia coli, are routinely used to monitor the microbial quality of water sources (6, 15, 16). However, studies have shown that there is a poor correlation between indicator organisms and pathogenic organisms in environmental water samples (17, 18, 19), and for this reason Ahmed et al. (9) questioned whether the detection of indicator organisms was sufficient in determining the quality of rainwater. This discrepancy is attributed to the facts that first, indicator organisms have been shown to have different survival rates from pathogens and second, fecal indicators may replicate in external environments (20, 21). PCR-based techniques have also been used in numerous studies to identify and quantify bacterial pathogens in environmental waters, as this technique offers a rapid, precise, and sensitive identification of bacterial pathogens. For example, Ahmed et al. (15) used PCR for the detection of Bacteroides spp. and detected the fecal indicator in 89% of the rainwater samples, while Savill et al. (22) detected Campylobacter spp. via PCR-based methods in 37.5% of the roof-collected water samples. Enteric pathogens such as Aeromonas hydrophila, Campylobacter jejuni, Campylobacter coli, and Salmonella spp. were also detected in harvested rainwater by use of PCR and were present in 7%, 19%, 1%, and 17% of the samples, respectively (9). Protozoan pathogens detected in rainwater included Giardia spp. and Cryptosporidium spp. (23, 24).
As South Africa is currently implementing strategies to utilize harvested rainwater as an alternative water source, the aims of this study were (i) to identify the dominant indigenous bacterial isolates cultured from harvested rainwater samples during a high-rainfall season by using 16S rRNA sequencing and (ii) to investigate the presence and the frequency distributions of pathogenic bacteria that are ubiquitous in harvested rainwater samples via the use of genus-specific PCR detection.
MATERIALS AND METHODS
Sample site and collection.
Sampling was conducted at a sustainable, low-income, subsidized housing project in Kleinmond, a coastal town situated in Western Cape, South Africa (25). Twenty-nine houses with vertical, polyethylene domestic rainwater harvesting tanks (capacity of 2,000 liters) installed were selected from a cluster of 411 houses established by the Council for Scientific and Industrial Research (CSIR) and the Department of Science and Technology in 2010. No first-flush diverters were installed above the tanks, which would have eliminated the first flush of debris from the roof surface into the tanks. Four sampling sessions were conducted, from June to August 2012, with sampling being conducted 1 to 4 days after a rain event. Rainfall data for the Kleinmond area were obtained from the South African Weather Services (Pretoria, South Africa). On each of the four sampling occasions, 2-liter rainwater samples were collected from each of the 29 domestic rainwater harvesting tanks, resulting in the collection of a total of 116 samples. Additional 5-liter rainwater samples were collected from eight domestic rainwater harvesting tanks for the detection of Giardia lamblia and Cryptosporidium parvum on one sampling occasion (the third sampling session). After collection, the samples were stored on ice to maintain the temperature below 4°C during transportation.
Culturing and isolation of the dominant indigenous bacteria from harvested rainwater samples.
In order to isolate Gram-negative enteric microorganisms from each rainwater tank sample collected during the four sampling sessions, 1 ml of the original sample was used for a serial dilution. Thereafter, 100-μl aliquots of undiluted and diluted (10−1) samples (processed within 36 h) were spread plated onto salmonella-shigella (SS) agar (Merck, Biolab, Wadeville, South Africa) and incubated at 35 ± 2°C for 18 to 24 h. The undiluted and diluted tank water samples were also spread plated onto legionella charcoal-yeast extract (CYE) agar base (glycine, vancomycin, polymyxin B, and cycloheximide [GVPC]; Oxoid, Hampshire, England) supplemented with GVPC vials SR0152 and SR0110 (Oxoid); samples were incubated at 35°C for 48 h in order to isolate Legionella spp. The selective detection was then increased by preincubating the agar plates at 50°C for 30 min before cultivation (26). In order to isolate Campylobacter species, an undiluted and a diluted (10−1) tank water sample was spread plated onto Campylobacter blood-free selective medium (Oxoid) with the selective supplement SR0155 (Oxoid) added according to the manufacturer's instructions. Plates were incubated under microaerophilic conditions with the use of an Anaeropack Anaero apparatus (Davies Diagnostics, Randburg, South Africa) in a sealed container. This container was incubated at 35°C for approximately 10 days.
Isolates were categorized based on morphological similarities, and representatives from each category were identified with the use of molecular techniques to identify the dominant, indigenous microorganisms that were able to grow on SS agar, legionella GVPC agar base, or campylobacter selective medium under microaerobic conditions.
Genomic DNA extractions from bacterial isolates and tank water samples.
The selected isolates were subcultured onto nutrient agar (NA; Merck, Biolab, Wadeville, South Africa) at least three times, and once pure colonies had been obtained, a single colony was inoculated into 5 ml nutrient broth (Merck) and incubated at 37°C overnight. Cells were harvested by centrifuging 2 ml of each culture for 10 min at 6,000 × g. The extraction of genomic DNA from each isolate was then performed using a soil microbe DNA miniprep kit (Zymo Research) according to the manufacturer's instructions.
For the PCR analysis of potentially pathogenic bacteria, total DNA extractions were also performed for each of the 116 tank water samples collected during sampling session one to four. In order to extract total genomic DNA from the tank water samples, a modified version of the boiling method was utilized (27). Each tank water sample (1.6 liters) was filtered through a sterile GN-6 Metricel S-pack membrane disc filter (Pall Life Sciences, Michigan) with a pore size of 0.45 μm and a diameter of 47 mm at a flow rate of approximately 65 ml/min/cm2 at 70 kPa. In the cases where the filters were saturated, more than one filter was used to filter the 1.6-liter volume of tank water. The filters were then processed for DNA extraction as outlined by Ndlovu et al. (28). Briefly, the filters for each rainwater sample were incubated in 2 ml Luria-Bertani (LB) broth (Merck, Biolab, Wadeville, South Africa) for 5 h at 37°C. The samples were vortexed for 15 min to detach the cells from the filters, and cells were harvested from 2 ml of the cell suspension via centrifugation at 12,500 × g for 10 min. The supernatant was discarded, and the pellet was resuspended in 100 μl sterile MilliQ water. The resuspended cells were then boiled at 95°C for 15 min, followed by cooling on ice for 10 min. The sample was subjected to centrifugation at 12,500 × g for 5 min, and the supernatant was transferred to a sterile Eppendorf tube. Genomic DNA and total DNA were then visualized on a 0.8% agarose gel stained with 0.5 μg/ml ethidium bromide.
Universal 16S rRNA identification and phylogenetic analysis of dominant bacterial isolates.
Once genomic DNA had been extracted from the various isolates, PCRs were used to amplify the 16S rRNA conserved sequences. The PCR mixtures consisted of a final volume of 50 μl and contained 10 μl of 5× Green GoTaq Flexi buffer (1× final concentration; Promega), 4 μl MgCl2 (2.0 mM), 0.5 μl of each deoxynucleoside triphosphate (dNTP; 0.1 mM; Thermo Scientific, Lithuania), 2.5 μl of each PCR primer (0.5 μM) (Table 1), and 0.3 μl (1.5 U) of GoTaq Flexi DNA polymerase (Promega, Madison, WI). Amplification was performed in a thermal cycler (Bio-Rad) as outlined in Table 1.
TABLE 1.
Primers and PCR cycling parameters for the detection of various potential bacterial pathogens
| Organism | Primer name | Primer sequence (5′–3′) | PCR cycling parameters | Gene (size [bp]) | Reference(s) |
|---|---|---|---|---|---|
| Universal | fDD2 | CCGGATCCGTCGACAGAGTTTGATCITGGCTCAG | 3 min at 94°C; 30 cycles of 94°C for 30 s, 53°C for 30 s, 72°C for 1.5 min | 16S rRNA (1,600) | 29 |
| rPP2 | CCAAGCTTCTAGACGGITACCTTGTTACGACTT | ||||
| Legionella spp. | JFP | AGGGTTGATAGGTTAAGAGC | 5 min at 95°C; 40 cycles of 94°C for 1 min, 57°C for 1.5 min, 72°C for 1 min | Attachment invasion locus gene (386) | 30 |
| JRP | CCAACAGCTAGTTGACATCG | ||||
| Aeromonas spp. | Aero-F | TGTCGGSGATGACATGGAYGTG | 2 min at 95°C; 35 cycles of 94°C for 1 min, 62°C for 1 min, 72°C for 2.5 min | Aerolysin (720) | 31 |
| Aero-R | CCAGTTCCAGTCCCACCACTTCA | ||||
| Shigella spp. | IpaH-F | CCTTGACCGCCTTTCCGATA | 2 min at 95°C; 35 cycles of 94°C for 1 min, 62°C for 1 min, 72°C for 2.5 min | Invasion plasmid antigen H (606) | 31 |
| IpaH-R | CAGCCACCCTCTGAGGTACT | ||||
| Salmonella spp. | IpaB-F | GGACTTTTTAAAAGCGGCGG | 2 min at 95°C; 35 cycles of 94°C for 1 min, 62°C for 1 min, 72°C for 2.5 min | Invasion plasmid antigen B (314) | 31 |
| IpaB-R | GCCTCTCCCAGAGCCGTCTGG | ||||
| Pseudomonas spp. | PA-GS-F | GACGGGTGAGTAATGCCTA | 2 min at 95°C; 25 cycles of 94°C for 20 s, 54°C for 20 s, 72°C for 40 s | 16S rRNA (618) | 32 |
| PA-GS-R | CACTGGTGTTCCTTCCTATA | ||||
| Campylobacter spp. | IC-F | CTAGAGTACAAACTAATAAGTCTC | 3 min at 95°C; 30 cycles of 94°C for 45 s, 52°C for 45 s, 72°C for 45 s | Flanking regions of ITS gene (700) | 33 |
| IC-R | ATTCTAAAACGCATCACTTCCTTG | ||||
| Yersinia spp. | 227Fmod | GTCTGGGCTTTGCTGGTC | 5 min at 95°C; 40 cycles of 94°C for 20 s, 60°C for 20 s, 72°C for 15 s | ompF (428–465) | 34 |
| 669R | GCGTCGTATTTAGCACCAACG | ||||
| Klebsiella spp. | gryA-F | CGCGTACTATACGCCATGAACGTA | 3 min at 95°C; 35 cycles of 94°C for 1 min, 50°C for 30 s, 72°C for 30 s | Gyrase A gene (383) | 35 |
| gyrA-C | ACCGTTGATCACTTCGGTCAGG | ||||
| C. parvum | ExCry1 | GCCAGTAGTCATATGCTTGTCTC | 5 min at 95°C; 10 min at 80°C; 45 cycles of 94°C for 45 s, 53°C for 1 min, 72°C for 45 s | 18S rRNA ribosomal unit (840) | 36 |
| ExCry 2 | ACTGTTAAATAGAAATGCCCCC | ||||
| C. parvum | NesCry3 | GCGAAAAAACTCGACTTTATGGAAGGG | 5 min at 95°C; 10 min at 80°C; 35 cycles of 94°C for 25 s, 65°C for 1 min, 72°C for 25 s | 18S rRNA ribosomal unit (590) | |
| NesCry4 | GGAGTATTCAAGGCATATGCCTGC | ||||
| G. lamblia | Gia2029 | AAGTGTGGTGCAGACGGACTC | 5 min at 94°C; 35 cycles of 94°C for 30s, 65°C for 30 s, 72°C for 1 min | 16S rRNA ribosomal unit (497) | 37, 38 |
| Gia2150c | CTGCTGCCGTCCTTGGATGT | ||||
| G. lamblia | RH11 | CATCCGGTCGATCCTGCC | 5 min at 94°C; 40 cycles of 94°C for 30s, 55°C for 30 s, 72°C for 1 min | 16S rRNA ribosomal unit (292) | |
| RH4 | AGTCGAACCCTGATTCTCCGCCAGG |
Phylogeny trees constructed from the results obtained for the 16S rRNA sequences were determined as outlined by Jackson et al. (39). The sequences of representative isolates that showed >97% similarity (<3% diversity) to organisms recorded in the international databases, such as GenBank, were used in the construction of the phylogenetic trees. The 16S rRNA sequences were aligned using the default settings and BLOSUM matrix (for the correction of multiple base changes) of ClustalX (version 1.81) (40). To calculate the distances of relatedness between each sequence, unrooted trees were assembled using the neighbor-joining method and maximum composite likelihood function (41). Phylogenetic analysis according to the methods described by Tamura et al. (42) was done using the program Molecular Evolutionary Genetics Analysis (MEGA, version 3.1), with bootstrap values set at 1,000. Positions that contained missing data were eliminated from the data set by using the complete deletion option.
Genus-specific PCRs from tank water samples.
Primers and PCR conditions as outlined in Table 1 were utilized in the current study for the identification of pathogenic and opportunistic bacterial pathogens that have previously been identified in rainwater tank samples. Each PCR mixture was performed in a final volume of 50 μl. For the detection of Shigella spp., Salmonella spp., and Aeromonas spp., the PCR mix consisted of 10 μl of 5× Green GoTaq Flexi buffer (1× final concentration; Promega), 4 μl MgCl2 (2.0 mM; Promega), 0.5 μl of each dNTP (0.1 mM; Thermo Scientific), 0.5 μl of the PCR primer (0.1 μM), 0.3 μl (1.5 U) of GoTaq Flexi DNA polymerase (Promega), and 10 μl of template DNA. For Campylobacter spp., Yersinia spp., and Klebsiella spp., the same PCR mix was used, with the exception that 1.5-μl volumes of the respective forward and reverse PCR primers (0.3 μM) were added. For Pseudomonas spp. and Legionella spp., again, the same reaction mixture was used, with 10 μl of template DNA; however, 2.0 or 2.5 μl of each PCR primer (0.4 or 0.5 μM final concentrations, respectively) was also used, respectively.
For each PCR, a negative control, consisting of sterile water, and a positive DNA control were included. The following strains were cultured as the positive controls from which genomic DNA was extracted: Legionella pneumophila ATCC 33152, Shigella sonnei ATCC 25931, Salmonella enterica serovar Tymphimurium ATCC 14028, Pseudomonas aeruginosa ATCC 27853, Campylobacter jejuni subsp. jejuni ATCC 33291, Aeromonas hydrophila (environmental strain), Klebsiella pneumoniae ATCC 13385, and Yersinia enterocolitica ATCC 27729. Unless indicated otherwise, all positive control organisms were obtained from Microbiologics. The specificity of each primer set was confirmed by using nontarget DNA extracted from all of the above-mentioned positive controls.
Genomic DNA extractions from tank water for the detection of G. lamblia and C. parvum.
For the detection of G. lamblia and C. parvum, rainwater samples were collected during the third sampling session from selected rainwater tanks in the Kleinmond housing project. The tank water samples were processed according to the methods described by Dungeni et al. (43) with a few modifications. To extract total genomic DNA from the tank water samples, 5 liters of each sample was filtered through a sterile GN-6 Metricel S-pack membrane disc filter (Pall Life Sciences) that had a pore size of 0.8 μm and a diameter of 47 mm. The filtration flow rate was approximately 65 ml/min/cm2 at 70 kPa. The filters were then washed using 2 ml 0.1% Tween 80. After the filters had been removed, the samples underwent centrifugation (1,000 × g) to pellet the (oo)cysts. DNA extractions were then performed on the pellets by using the QIAamp DNA stool minikit (Qiagen, Hilden, Germany) (44) with minor modifications. Briefly, the pellet was resuspended in 1.4 ml buffer ASL and incubated at 95°C for 5 min. Once the sample had undergone subsequent centrifugation (full speed for 1 min), an InhibitEX tablet was added to 1.2 ml of the supernatant and the mixture was vortexed for 1 min and then left at room temperature for 1 min. In order to remove the inhibitors bound to InhibitEX, the sample was centrifuged at full speed for 3 min. Into a microcentrifuge tube containing 30 μl of proteinase K, 400 μl of the supernatant was added. Before incubating the sample at 70°C for 15 min, 400 μl of buffer AL was added, and after incubation 400 μl of ethanol (96 to 100%) was added to each sample. In order to filter the complete lysate through the QIAamp spin column, approximately 600 μl of the lysate was added to the QIAamp spin column and centrifuged at full speed for 1 min. This process was then repeated until the full lysate had been filtered through the QIAamp spin column. The manufacturer's protocol was then followed.
Identification of G. lamblia and C. parvum.
The primers along with the PCRs utilized for the identification of Cryptosporidium parvum and Giardia lamblia have been previously described by Sturbaum et al. (36), Appelbee et al. (37), and Hopkins et al. (38). Primers used in this study are outlined in Table 1. The PCR mixture used to identify Cryptosporidium parvum consisted of a final volume of 50 μl. It included 10 μl of 5× Green GoTaq Flexi buffer (1× final concentration; Promega), 2.5 μl of each PCR primer (0.5 μM), and 0.3 μl (1.5 U) of GoTaq Flexi DNA polymerase (Promega). The PCR conditions for the external and nested PCR are outlined in Table 1; a nested PCR was performed using 5 μl of the primary PCR product.
For the detection of Giardia spp. in the tank water samples, a primary and seminested PCR was performed (Table 1). Again, the PCR mixture consisted of a final volume of 50 μl. It included 10 μl of 5× Green GoTaq Flexi buffer (1× final concentration; Promega), 4 μl MgCl2 (2.0 mM), 0.5 μl of each dNTP (0.1 mM; Thermo Scientific), 2.5 μl of each PCR primer (0.5 μM; see Table 1), and 0.3 μl (1.5 U) of GoTaq Flexi DNA polymerase (Promega). A secondary PCR mixture consisted of the same components except that 0.5 μl of the primary PCR product was used in place of genomic DNA. A 292-bp product was amplified using the primers RH11 and RH4 (Table 1). The conduct of the secondary PCR assay was identical to that for the initial PCR, with the exception that the annealing temperature was increased to 59°C.
The secondary PCR products for both C. parvum and G. lamblia were subsequently cloned into the pGEM T-easy vector system (Promega) according to the manufacturer's instructions and then transferred into E. coli DH5α cells and plated onto Luria-Bertani agar plates containing ampicillin and X-Gal (5-bromo-4-chloro-3-indolyl-β-d-thiogalactopyranoside) as recommended by the manufacturer. Plasmid DNA was extracted from the clones by using the PureYield plasmid miniprep system (Promega), and plasmids containing the correct-sized PCR product (in a 2% agarose gel in 1× Tris-borate-EDTA [TBE]) that correlated with the band of Giardia spp. (292 bp) or Cryptosporidium spp. (590 bp) were sent to the Central Analytical Facility (CAF) at Stellenbosch University for sequencing.
Analysis of PCR products.
All PCR products were analyzed by gel electrophoresis in either 0.8% (for 16S rRNA identification), 1.5% (for genus-specific analysis), or 2% (for PCR cloning) agarose (Bio-Rad) containing 0.5 μg/ml ethidium bromide in TBE buffer. Once the size and the concentration of the PCR products were confirmed, products of representatives of the bacteria detected in the tank water samples were cleaned and concentrated using the DNA Clean & Concentrator 5 kit (Zymo Research) as per the manufacturer's instruction. The cleaned products were then sent to the CAF for sequencing. Sequences were aligned and analyzed using DNAman version 4.1.2.1 software to form continuous sequences. Chromatograms of each sequence were examined using Finch TV v. 1.4.0 software and were aligned using DNAman version 4.1.2.1 software. Sequence identification was completed using the National Center for Biotechnology Information (NCBI) basic local alignment search tool (BLAST) (http://blast.ncbi.nlm.nih.gov/Blast.cgi) to find the closest match of local similarity between isolates and also using the international databases GenBank, EMBL, DDBJ, and PDB for sequence data (45). The sequences of representative isolates that showed >97% similarity (<3% diversity) to the organisms were recorded.
Statistical analysis.
The genus-specific PCR assays for each of the pathogenic bacteria (Shigella spp., Salmonella spp., Aeromonas spp., Klebsiella spp., Legionella spp., Pseudomonas spp., and Yersinia spp.) were analyzed to determine relations between the detection specifics of each organism. PCR results obtained from the Campylobacter PCR assays were not included, as no PCR assays showed positive results for Campylobacter spp. To analyze the data obtained from the genus-specific PCR assays, a positive PCR product was assigned a value of 1, and when no PCR product was observed, it was assigned a value of 0. Binary logistic regression has previously been used to investigate water samples, as this model can be applied to binary (presence/absence) results (46). In order to validate the cooccurrence and noncooccurrence results, the odds ratio, specificity, and sensitivity of each PCR assay to detect the corresponding PCR assay were determined according to the methods of Gawler et al. (47).
RESULTS
Identification of dominant indigenous pathogenic bacteria based on 16S rRNA analysis.
From the 29 rainwater tanks that were sampled four times (1 to 4 days after a rain event) throughout the study period during a higher rainfall period (74.7 mm in June to 198.1 mm in August), 85 isolates were selected from a larger number of colonies based on morphological characterization. All the organisms isolated throughout this study were predominantly Gram negative, except for Enterococcus faecium (GenBank accession no. AMBN01000001.1), which was isolated during sampling session four and is a Gram-positive organism. The organisms identified as well as the frequency of detection throughout the sampling period are summarized in Table 2.
TABLE 2.
Genera of bacteria isolated and their frequencies throughout the sampling period
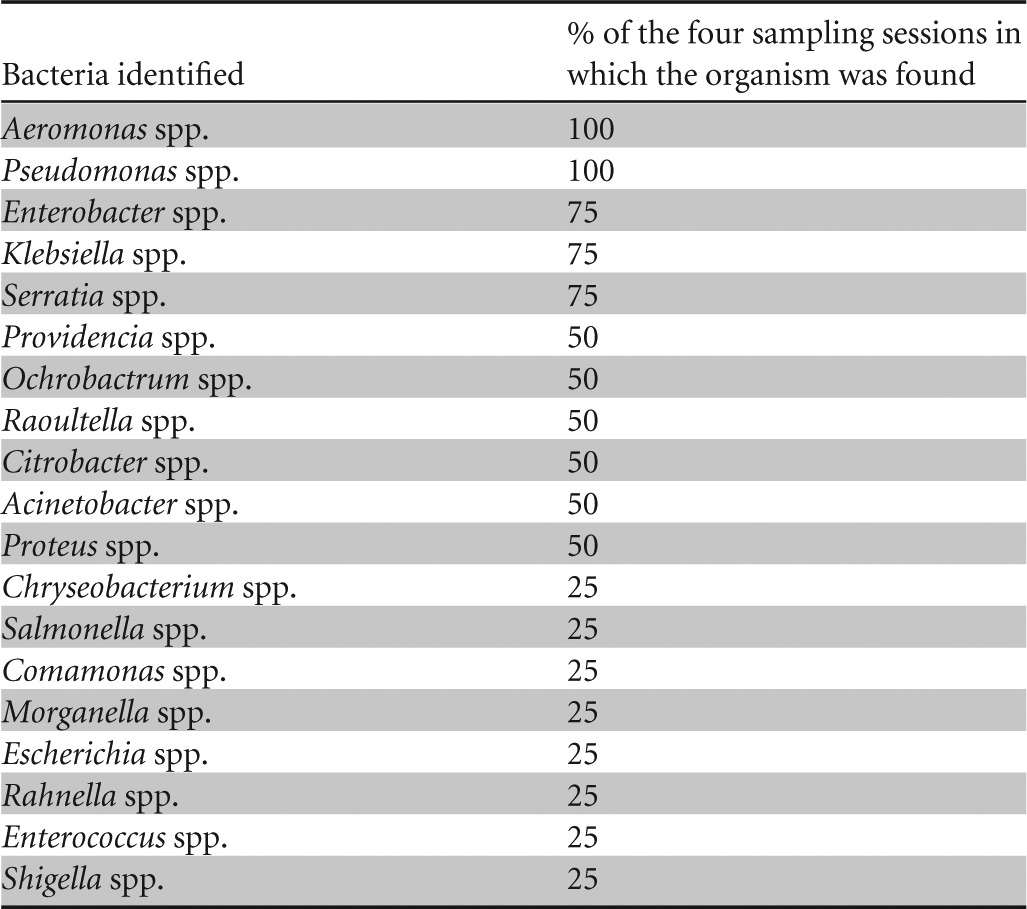
Aeromonas spp. and Pseudomonas spp. were isolated throughout the high-rainfall period (sampling occasions one to four). Enterobacter spp., Klebsiella spp., and Serratia spp. were also commonly identified species; these genera were identified in three of the four (75%) sampling occasions. During two of the four sampling occasions, Providencia spp., Ochrobactrum spp., Raoultella spp., Citrobacter spp., and Acinetobacter spp. were isolated and identified. Chryseobacterium spp., Salmonella spp., Proteus spp., Comamonas spp., Morganella spp., Escherichia spp., Rahnella spp., Enterococcus spp., and Shigella spp. were only isolated and identified on one sampling occasion and represented the least prevalent genera.
During sampling one, 51% of the total 85 isolates were obtained, and during this sampling the most diverse array of Gram-negative bacteria was also isolated (Fig. 1). Isolates present from the first clade, belonging to the Enterobacteriales order and the Enterobacteriaceae family, represented the largest order found in sampling session one. In contrast, the order Aeromonadales was represented by one family, Aeromonadaceae. Two families were observed in the third clade of Pseudomonadales, namely, Moraxellaceae and Pseudomonadaceae. The order of Rhizobiales contained one genus of Ochrobactrum, which belongs to the Brucellaceae family. The families of Comamonadaceae and Flavobacteriaceae formed clades five and six, respectively.
FIG 1.

Phylogenetic tree illustrating the evolutionary history of bacteria, constructed during sampling session one by means of the maximum composite likelihood function (evolutionary history) and neighbor-joining method within the program MEGA 5. The numbers found adjacent to the nodes represent the data (percentages) from 1,000 exploratory bootstrap trials. Bar, 0.05 changes per site. Six distinct orders are clustered together, representing the Enterobacteriales, Aeromonadales, Pseudomonadales, Rhizobiales, Burkholderiales, and Flavobacteriales. The increased amount in bacterial diversity may be attributed to the fact that obtained isolates were cultured on two different selective media.
The cladogram depicted in Fig. 2 represents the range of organisms (27% of total isolates) identified during the second sampling session. First, the Enterobacteriales, encompassing the dominant family Enterobacteriaceae, were clustered together in the first clade. Aeromonadales formed the second clade, and these organisms included the family Aeromonadaceae, with one Aeromonas sp. found. The third clade, with Pseudomonadales, included two families of bacteria, Moraxellaceae and Pseudomonadaceae, including one Acinetobacter sp. and Pseudomonas spp., respectively. The Enterobacteriaceae represented the largest family during sampling session two, although the widest range of species diversity was seen among the Pseudomonas genus.
FIG 2.

Phylogenetic tree illustrating the evolutionary history of bacteria, constructed during sampling session two by means of the maximum composite likelihood function (evolutionary history) and neighbor-joining method in the MEGA 5 program. The numbers adjacent to the nodes represent the results (percentages) from 1,000 exploratory bootstrap trials. Bar, 0.05 changes per site. The tree was drawn to scale. Three distinct clades, Enterobacteriales, Aeromonadales, and Pseudomonadales, encompassing the families Enterobacteriaceae, Aeromonadaceae, Moraxellaceae, and Pseudomonadaceae, were identified.
During the third and fourth sampling sessions, low diversity among the bacteria was observed, with 11 and 12% of the total isolates recovered, respectively (data not shown). During the third sampling, Aeromonas spp., Pseudomonas spp., Enterobacter spp., and Klebsiella spp. were isolated and identified, while the following species were isolated and identified during sampling session four: Aeromonas spp., Pseudomonas spp., Serratia spp., Enterococcus spp., and Shigella spp.
Presence of potential pathogenic bacteria in tank water samples.
Genus-specific PCR results are provided in Table 3 for sampling sessions one to four. Legionella spp. sequences (GenBank accession numbers KC209478.1 and FJ588216.1) were dominant in this study as, on average, this genus was detected in 73% of the tank water samples. The lowest number of positive samples for Legionella spp. was detected during sampling three (41%), while the highest number of positive samples was identified in sampling four (86%). Salmonella enterica subsp. enterica serovar Gallinarum (biovars Gallinarum and Pullorum) were the least dominant species, as on average only 6% of the samples tested positive as Salmonella spp. (GenBank accession number CP003786.1). The highest number of positive results for Salmonella spp. was observed during sampling two (17%), while no Salmonella spp. were detected during samplings one and three. An average of 47% of all samples tested were positive for Klebsiella pneumoniae and Klebsiella oxytoca sequences (GenBank accession numbers X16817.1 and FM199942.1), with the highest value recorded in sampling two (75%) and the lowest value recorded in sampling three (24%). Shigella and Yersinia genus-specific PCRs showed average positive results of 27% and 28%, respectively. The highest number of positive results was recorded in sampling four (45%) for Shigella sonnei sequences (GenBank accession numbers HE616529.1 and HE616528.1) and sampling two (48%) for Yersinia enterocolitica (GenBank accession number HM142628.1). In addition, the lowest number of Shigella spp. and Yersinia spp. positive results were detected in sampling three (10%) and sampling one (14%), respectively. Averages of 16% and 13% were recorded for Aeromonas hydrophila (GenBank accession number EF189591.1) and Pseudomonas syringae (GenBank accession numbers KC920926.1 and KF500097.1), respectively. No Campylobacter spp. were detected throughout the sampling period.
TABLE 3.
Frequency of samples from sessions 1 to 4 that contained specific genes linked to the genera analyzeda
| Sampling session | No. (%) of samples positive by genus-specific PCR |
|||||||
|---|---|---|---|---|---|---|---|---|
| Aeromonas spp. | Campylobacter spp. | Klebsiella spp. | Legionella spp. | Pseudomonas spp. | Salmonella spp. | Shigella spp. | Yersinia spp. | |
| 1 | 4 (14) | 0 (0) | 11 (38) | 24 (83) | 0 (0) | 0 (0) | 11 (38) | 4 (14) |
| 2 | 7 (24) | 0 (0) | 22 (75) | 24 (83) | 12 (41) | 5 (17) | 4 (14) | 14 (48) |
| 3 | 2 (7) | 0 (0) | 7 (24) | 12 (41) | 2 (7) | 0 (0) | 3 (10) | 6 (21) |
| 4 | 5 (17) | 0 (0) | 14 (48) | 25 (86) | 1 (3) | 2 (7) | 13 (45) | 9 (31) |
Samples were obtained from a total of 29 rainwater tanks and at four sampling sessions (i.e., 116 total samples for analysis of bacteria genera).
Presence of G. lamblia and C. parvum in harvested rainwater samples.
During the third sampling session, randomly selected tanks were sampled in order to detect the protozoan species Giardia and Cryptosporidium. A nested PCR assay confirmed that during the third sampling session, two out of the eight tanks sampled contained Giardia intestinalis (GenBank accession number KC556751.1). No Cryptosporidium spp. were detected during the current study.
Levels of agreement, disagreement, odds ratio, specificity, and sensitivity between genus-specific PCR assays.
The occurrences of frequently identified pathogens from the genus-specific PCR assays were analyzed by using pairwise comparisons for all the tank water samples. The pairwise comparisons that were significant (P < 0.05) are indicated in Table 4. The total percent agreement was calculated by adding the percentage of cooccurrence and noncooccurrence for each pairwise comparison. Legionella spp. and the Shigella spp. had the highest percentage (24%) of cooccurrence agreement, while Aeromonas spp. and Salmonella spp. had the lowest percentage (3%) of cooccurrence agreement. Salmonella spp. also had cooccurrence agreement with Klebsiella spp. (5%), while Pseudomonas spp. had cooccurrence agreement with Klebsiella spp. (10%) and Yersinia spp. (7%).
TABLE 4.
Total agreement and total disagreement on cooccurrence and noncooccurrence among bacterial genes detected in rainwater samplesa by using genus-specific PCR assays and the sensitivities, specificities, and odds ratios of the PCR assays
| Pairwise comparison | Cooccurrence agreement (%) | Noncooccurrence agreement (%) | Total agreement (%) | Total disagreement (%) | P value | Sensitivity | Specificity | Odds ratio |
|---|---|---|---|---|---|---|---|---|
| Klebsiella spp. vs Pseudomonas spp. | 10 | 50 | 60 | 40 | 0.024 | 0.73 | 0.57 | 0.98 |
| Klebsiella spp. vs Salmonella spp. | 5 | 52 | 57 | 43 | 0.026 | 0.86 | 0.56 | 0.99 |
| Aeromonas spp. vs Salmonella spp. | 3 | 82 | 85 | 15 | 0.008 | 0.57 | 0.87 | 0.99 |
| Legionella spp. vs Shigella spp. | 24 | 24 | 48 | 52 | 0.007 | 0.90 | 0.33 | 0.95 |
| Pseudomonas spp. vs Yersinia spp. | 7 | 66 | 73 | 27 | 0.029 | 0.24 | 0.92 | 0.62 |
Samples were obtained from a total of 29 rainwater tanks and at four sampling sessions (i.e., 116 total samples for analysis of bacteria genera).
The noncooccurrence percentages were generally higher than the cooccurrence agreements for most pairwise comparisons. However, Legionella spp. and Shigella spp. showed equal (24%) cooccurrence and noncooccurrence agreement levels. Aeromonas spp. and Salmonella spp. had the highest (82%) noncooccurrence agreement, while Legionella spp. and Shigella spp. had the lowest noncooccurrence agreement. Klebsiella spp. had noncooccurrence agreement with Pseudomonas spp. (50%) and Salmonella spp. (52%), while the noncooccurrence agreement between Pseudomonas spp. and Yersinia spp. was 66%.
To validate the results for one PCR assay indicating a positive or negative result of another PCR assay, the sensitivity and specificity of each PCR assay were determined for all the PCR assays showing the most significant cooccurrence and noncooccurrence rates between samples (Table 4). To determine the level of association or nonindependence of the PCR assays for each bacteria pair, an odds ratio was included in this study. The highest overall sensitivity value was recorded for the Legionella spp. versus Shigella spp. comparison of PCR assays, at 0.90 (odds ratio, 0.95), followed by Klebsiella spp. versus Salmonella spp. (sensitivity, 0.86; odds ratio, 0.99). The highest specificity for the PCR assays was also recorded for Pseudomonas spp. versus Yersinia spp., at 0.92 (odds ratio, 0.62), followed by Aeromonas spp. versus Salmonella spp. (specificity, 0.87; odds ratio, 0.99).
DISCUSSION
Based on 16S rRNA analysis, the majority of Pseudomonas isolates were obtained during sampling session two, while the lowest number were obtained during sampling session four. These results correlated well with the genus-specific PCR results, which revealed that most of the tank water samples tested positive for the presence of Pseudomonas spp. during sampling two (40%). However, no Pseudomonas spp. were detected by using genus-specific primers in sampling one, with Pseudomomas spp. identified in 3% of samples during sampling four. Pseudomonas spp. have previously been identified in rainwater samples; for example, Uba and Aghogho (11) found that 83% of rainwater samples tested were positive for Pseudomonas spp.
Pseudomonas spp. represent the most diverse array of species and were isolated (via 16S rRNA PCR) throughout the sampling period, including presumptive P. poae (sampling one), P. fluorescens (samplings one, two, and three), P. fragi (sampling one), P. putida (samplings two and four), P. reactans (sampling eight), P. rhodesiae (samplings one and four), P. cedrina (sampling two), and P. psychrophila (sampling two). This was not surprising, as Pseudomonas spp. have been shown to be abundant in water and soil ecosystems (48). This genus has, however, been associated with significant plant, human, and animal diseases, and it has a well-documented role in the spoilage of food products, such as meats, even under refrigeration conditions (49, 50).
Aeromonas hydrophila was detected in every sampling session, based on 16S rRNA analysis. Various other Aeromonas spp., for example, A. caviae (sampling three) and A. salmonicida (sampling four), were also identified during the sampling period. Based on genus-specific PCR analysis, Aeromonas spp. were also present in all of the sampling sessions. The majority of the Aeromonas isolates (based on 16S rRNA analysis) were obtained during sampling four, while genus-specific PCR revealed that the highest number of rainwater samples contaminated with Aeromonas species was found during sampling two (24%). Both 16S rRNA and genus-specific PCR revealed that the lowest frequency of Aeromonas spp. was identified during sampling three (7%). In the current study, presumptive A. hydrophila and A. caviae, which are of clinical significance (51), were identified. Aeromonas spp. cause a wide range of diseases, including gastrointestinal infections as well as extraintestinal infections, such as cellulitis, wound infections, septicemia, urinary tract infections, hepato-biliary infections, and ear infections (52). The Aeromonas species most commonly associated with gastrointestinal infections is A. hydrophila (53). Aeromonas spp. have also been identified in previous studies that monitored the microbial quality of harvested rainwater (9, 10, 54).
Along with Aeromonas, Klebsiella spp. (including presumptive K. oxytoca [samplings one and two], K. cryocrescens [sampling three], and K. intermedia [sampling four]) were also isolated and identified in the current study by using 16S rRNA PCR. Klebsiella spp. were predominantly identified in sampling session one based on 16S rRNA PCR, while genus-specific PCR showed that this genus was present at higher frequencies during sampling two (75%). No Klebsiella isolates (based on 16S rRNA PCR) were obtained during sampling four, while the fewest positive samples (based on genus-specific PCR) were observed during sampling three (24%). Klebsiella oxytoca has been isolated on numerous occasions from Australian drinking water sources (55). Kaushik et al. (56) also reported recently that, of the 50 rainwater samples they tested in Singapore, 12% were positive for Klebsiella spp. People that are at added risk of acquiring Klebsiella-associated diseases are, among others, those with compromised defense mechanisms, people with serious wounds, those with AIDS, and immunocompromised HIV-infected adults (57).
Salmonella sp. isolates were only positively identified in sampling one (S. enterica) based on 16S rRNA, while most of the samples yielded positive results for Salmonella spp. during sampling two based on genus-specific PCR. No Salmonella isolates (based on 16S rRNA) were obtained from samplings two to four, while no samples showed positive results for Salmonella during samplings one and three (based on genus-specific PCR). Salmonellosis waterborne outbreaks are usually the result of the consumption of water that has been contaminated by the feces of livestock and wild animals or by wastewater discharges that have been inadequately treated. Koplan et al. (58) found that there was an outbreak of salmonellosis among a church group after the ingestion of harvested rainwater contaminated with S. arechevalata. It was also hypothesized that this outbreak was as a result of the catchment area (roof) being covered with bird feces.
No Yersinia spp. were identified throughout the study period when we used 16S rRNA analysis; however, Yersinia spp. were identified in all the sampling sessions in which we used genus-specific PCR. This could be attributed to the use of PCR-based assays, whereby the detection of bacteria in a viable but nonculturable state is possible (59). Moreover, genus-specific PCR indicated that the highest amount of samples (48%) tested positive for Yersinia enterocolitica during sampling two, while sampling one yielded the lowest percentage of positive samples (14%). Yersinia enterocolitica is predominantly isolated from domestic and wild animals, which are considered possible reservoirs. Transmission of this bacterium to humans is generally through meat products (60); however, Y. enterocolitica has been isolated from a number of environmental samples, particularly from water, but the serotypes are different from those that cause disease in humans.
Legionella spp. were predominant throughout the sampling sessions when we used genus-specific PCR assays. However, no Legionella spp. were isolated and identified with the use of culturing techniques or 16S rRNA sequencing. While an alternative to the serial dilution method (employed in the current study) would be to filter larger volumes of tank water through a membrane filter, research has shown that Legionella spp. are difficult to isolate using culture-based techniques (3), especially from low-nutrient environments (61). A high incidence of Legionella was detected during samplings four (86.2%), one (82.8%), and two (82.8%), while the lowest percentage of positive results was obtained during sampling three. The use of quantitative PCR has also enabled researchers in other studies to observe and quantify the estimated numbers of Legionella pneumophila in harvested rainwater samples (9, 16).
Of the isolates obtained, Enterobacter spp., including E. hormaechei (sampling one), E. cloacae (sampling three), and E. ludwigii (samplings two and four), were isolated throughout the sampling period. Enterobacter spp. represent the fourth most dominant genera of isolates obtained in this study, after Pseudomonas, Aeromonas, and Klebsiella.
During this study, of the eight tank water samples analyzed, Giardia spp. were detected in 25% of the rainwater tanks sampled; however, no Cryptosporidium spp. were detected in rainwater samples from the same tanks. Giardia and Cryptosporidium are protozoan parasites. In a previous study, Ahmed et al. (16) did not detect Cryptosporidium spp. via PCR-based assays; however, in a later publication (24), with the use of quantitative PCR (qPCR) they were able to establish that Cryptosporidium parvum and Giardia lamblia were present in 13% and 30% of the possum fecal samples tested, respectively, and G. lamblia was present in 13% of the rainwater samples analyzed.
Our statistical analyses revealed that the Klebsiella spp. versus Pseudomonas spp. comparison had a total agreement of 60%, while Klebsiella spp. versus Salmonella spp. had a total agreement of 57%. Klebsiella and Pseudomonas are not associated with the gastrointestinal system, and Klebsiella is known to propagate in the environment. Neither of these genera (Klebsiella and Pseudomonas) serves as an indicator of fecal contamination, while Salmonella does (62). As there is not much variation among the total agreement values, the presence of Klebsiella, and possibly Pseudomonas, could serve as indicators for the presence of Salmonella and fecal contamination. However, further analysis revealed that these results could be misleading, as the specificities of the test were only 0.57 (for Klebsiella spp. versus Pseudomonas spp.) and 0.56 (for Klebsiella spp. versus Salmonella spp.). A similar scenario was mimicked with the Legionella spp. versus Shigella spp. comparison, where a total agreement of 48% was obtained. As the total agreement (48%) and total disagreement (52%) values were similar, it is hypothesized that Legionella spp. could not serve as an indicator for the presence of Shigella spp. contamination, as the specificity of the assay was 0.33. However, Legionella is not associated with the gastrointestinal system, while Shigella spp. serve as an indication of fecal pollution in water samples and may pose a significant health risk (62).
However, Aeromonas spp. versus Salmonella spp. had a high total agreement and a lower total disagreement, 85% and 15%, respectively; Pseudomonas versus Yersinia also had a high total agreement and a lower total disagreement, 73% and 27%, respectively. Aeromonas and Pseudomonas are normal inhabitants of freshwater, whereas the presence of Salmonella in a water sample is an indicator of fecal contamination, and the presence of Yersinia indicates the presence of domestic or wild animal fecal contamination (62). Based on PCR assays, Aeromonas spp. versus Salmonella spp. and Pseudomonas spp. versus Yersinia spp. for monitoring fecal pollution would pose a lower chance of misleading results, as the specificities of both tests were high, 0.87 and 0.92, respectively, and above the U.S. Environmental Protection Agency's recommended value of 0.80 (63).
Although PCR results do not indicate the pathogenicity of a particular bacterial species, the results of the PCR assays in this study showed that a particular PCR assay can be used to detect the presence or absence of another organism; for example, the PCR assay for Salmonella spp. could determine the presence or absence of Aeromonas spp., as the specificity value (0.87) and the odds ratio for this pair of organisms was high (0.99). Further research is, however, essential to determine the prevalence and concentrations of each genus-specific gene, preferably in a quantitative manner. As previously noted by Ahmed et al. (46), the consequences of inadequate and misleading analyses for the detection of bacterial pathogens could lead to expensive treatment methods that may not be assessed efficiently, rendering the quality of the water inadequate or, as in the case of observing false-positive results, the water could wrongfully be deemed inadequate, leading to overly restricted access to a water source.
A range of dominant and indigenous, predominantly Gram-negative, potential pathogenic bacteria, for example, E. aerogenes and S. enterica, were isolated and identified with the use of 16S rRNA analysis of harvested rainwater sampled throughout the study period. Moreover, PCR assays utilizing genus-specific primers confirmed the presence of bacterial and protozoan groups that have been detected internationally in harvested rainwater samples, such as Aeromonas spp., Salmonella spp., Legionella spp., Yersinia spp., and Giardia spp. It was also important that the diversity and frequency of distribution of the pathogenic species detected differed significantly among the 29 rainwater tanks sampled, with no correlation observed over the four sampling occasions. Results obtained in the current study then correlate with those of previous studies, where it has been noted that the method of catchment of harvesting rainwater from rooftops, courtyards, or low-frequented streets could allow pathogens from animal droppings and other organic debris to be flushed into the tanks via the gutters and inlet tank system. At the Kleinmond sampling site, the houses are also surrounded by gardens and a dirt road that runs along the top of the settlement, which could allow pathogens from the environment (soil and water) or fecal matter to enter the tank reservoir. This is a matter of concern, because in a study conducted by P. H. Dobrowksy, D. Mannel, M. De Kwaadsteniet, H. Prozesky, W. Khan, and T. E. Cloete (unpublished data) in the same Kleinmond project, total coliforms and Escherichia coli counts enumerated in rainwater samples significantly exceeded (P < 0.05) the stipulated drinking water guidelines during every sampling session. Moreover, that study also included a social perception analysis, and it was noted that, generally, the harvested rainwater was used for washing clothes and for cleaning inside and outside the houses, although 24% of the respondents used the water for drinking. The results of these studies as well as the confirmed presence of pathogenic bacteria and protozoa then reinforce the opinion of the WHO (64), which recognizes that rainwater should be pretreated before using it as a potable source, especially if the rainwater is to be used by immunocompromised individuals.
ACKNOWLEDGMENTS
We thank the Water Research Commission and the National Research Foundation for funding this project.
We also thank Joseph Smith and the Kleinmond Municipality for their assistance in the selection of sampling houses included in this study. The South African Weather Services is thanked for providing rainfall data.
Footnotes
Published ahead of print 31 January 2014
REFERENCES
- 1.Amin MT, Alazba AA. 2011. Probable sources of rainwater contamination in a rainwater harvesting system and remedial options. Aust. J. Basic Appl. Sci. 5:1054–1064 http://awc-ksu.com/wp-content/uploads/2013/12/13.pdf [Google Scholar]
- 2.Mwenge Kahinda J-M, Taigbenu AE, Boroto RJ. 2010. Domestic rainwater harvesting as an adaptation measure to climate change in South Africa. Phys. Chem. Earth 35:742–751. 10.1016/j.pce.2010.07.004 [DOI] [Google Scholar]
- 3.Despins C, Farahbakhsh K, Leidl C. 2009. Assessment of rainwater quality from rainwater harvesting systems in Ontario, Canada. J. Water Supply Res. Technol. AQUA 58:117–134. 10.2166/aqua.2009.013 [DOI] [Google Scholar]
- 4.Heyworth JS, Glonek G, Maynard EJ, Baghurst PA, Finlay-Jones J. 2006. Consumption of untreated tank rainwater and gastroenteritis among young children in South Australia. Int. J. Epidemiol. 35:1051–1058. 10.1097/ije/dyl105 [DOI] [PubMed] [Google Scholar]
- 5.Holländer R, Bullermann M, Grob C, Hartung H, König K, Lücke F-K, Nolde E. 1996. Microbiological and hygienic aspects of the use of rainwater as process water for toilet flushing, garden irrigation and laundering. Gesundheitswesen 58:288–293 (In German.) [PubMed] [Google Scholar]
- 6.Dillaha TA, Zolan WJ. 1985. Rainwater catchment water quality in Micronesia. Water Res. 19:741–746 [Google Scholar]
- 7.Sazakli E, Alexopoulos A, Leotsinidis M. 2007. Rainwater harvesting, quality assessment and utilization in Kefalonia Island, Greece. Water Res. 41:2039–2047. 10.1016/j.watres.2007.01.03 [DOI] [PubMed] [Google Scholar]
- 8.Zhu K, Zhang L, Hart W, Liu M, Chen H. 2004. Quality issues in harvested rainwater in arid and semi-arid Loess Plateau of northern China. J. Arid Environ. 57:487–505. 10.1016/S0140-1963(03)00118-6 [DOI] [Google Scholar]
- 9.Ahmed W, Vieritz A, Goonetilleke A, Gardner T. 2010. Health risk from the use of roof-harvested rainwater in southeast Queensland, Australia, as potable or nonpotable water, determined using quantitative microbial risk assessment. Appl. Environ. Microbiol. 76:7382–7391. 10.1128/AEM.00944010 [DOI] [PMC free article] [PubMed] [Google Scholar]
- 10.Simmons G, Hope V, Lewis G, Whitmore J, Gao W. 2001. Contamination of potable roof-collected rainwater in Auckland, New Zealand. Water Res. 35:1518–1524. 10.1016/S0043-1354(00)00420-6 [DOI] [PubMed] [Google Scholar]
- 11.Uba BN, Aghogho O. 2000. Rainwater quality from different roof-catchments in the Port Harcourt District, Rivers State, Nigeria. J. Water Supply Res. Technol. AQUA 49:281–288 http://www.iwaponline.com/jws/049/jws0490281.htm [Google Scholar]
- 12.Ahmed W, Sidhu JPS, Toze S. 2012. An attempt to identify the likely sources of Escherichia coli harbouring toxin genes in rainwater tanks. Environ. Sci. Technol. 46:5193–5197. 10.1021/es300292y [DOI] [PubMed] [Google Scholar]
- 13.Brodribb R, Webster P, Farrell D. 1995. Recurrent Campylobacter fetus subspecies bacteraemia in a febrile neutropaenic patient linked to tank water. Commun. Dis. Intell. 19:312–313 [Google Scholar]
- 14.Merritt A, Miles R, Bates J. 1999. An outbreak of Campylobacter enteritis on an island resort, north Queensland. Commun. Dis. Intell. 23:215–219 [PubMed] [Google Scholar]
- 15.Ahmed W, Huygens F, Goonetilleke A, Gardner T. 2008. Real-time PCR detection of pathogenic microorganisms in roof-harvested rainwater in southeast Queensland, Australia. Appl. Environ. Microbiol. 74:5490–5496. 10.1128/AEM.00331-08 [DOI] [PMC free article] [PubMed] [Google Scholar]
- 16.Ahmed W, Goonetilleke A, Gardner T. 2010. Implications of faecal indicator bacteria for the microbiological assessment of roof-harvested rainwater quality in southeast Queensland, Australia. Can. J. Microbiol. 56:471–479. 10.1139/W10-037 [DOI] [PubMed] [Google Scholar]
- 17.Hörman A, Rimhanen-Finne R, Maunula L, von Bonsdorff C-H, Torvela N, Heikinheimo A, Hänninen M-L 2004. Campylobacter spp., Giardia spp., Cryptosporidium spp., noroviruses, and indicator organisms in surface water in southwestern Finland, 2000–2001. Appl. Environ. Microbiol. 70:87–95. 10.1128/AEM.70.1.87-95.2004 [DOI] [PMC free article] [PubMed] [Google Scholar]
- 18.McQuaig SM, Scott TM, Harwood VJ, Farrah SR, Lukasik JO. 2006. Detection of human-derived fecal pollution in environmental waters by use of a PCR-based human polyomavirus assay. Appl. Environ. Microbiol. 72:7567–7574. 10.1128/AEM.01317-06 [DOI] [PMC free article] [PubMed] [Google Scholar]
- 19.Ahmed W, Sawant S, Huygens F, Goonetilleke A, Gardner T. 2009. Prevalence and occurrence of zoonotic bacterial pathogens in surface waters determined by quantitative PCR. Water Res. 43:4918–4928. 10.1016/j.watres.2009.03.041 [DOI] [PubMed] [Google Scholar]
- 20.Anderson KL, Whitlock JE, Harwood VJ. 2005. Persistence and differential survival of fecal indicator bacteria in subtropical waters and sediments. Appl. Environ. Microbiol. 71:3041–3048. 10.1128/AEM.71.6.3041-3048.2005 [DOI] [PMC free article] [PubMed] [Google Scholar]
- 21.Byappanahalli MN, Whitman RL, Shively DA, Sadowsky MJ, Ishii S. 2006. Population structure, persistence, and seasonality of autochthonous Escherichia coli in temperate, coastal forest soil from a Great Lakes watershed. Environ. Microbiol. 8:504–513. 10.1111/j.1462-2920.2005.00916.x [DOI] [PubMed] [Google Scholar]
- 22.Savill MG, Hudson JA, Ball A, Klena JD, Scholes P, Whyte RJ, McCormick RE, Jankovic D. 2001. Enumeration of Campylobacter in New Zealand recreational and drinking waters. J. Appl. Microbiol. 91:38–46. 10.1046/j.1365-2672.2001.01337.x [DOI] [PubMed] [Google Scholar]
- 23.Abo-Shehada M, Hindyia M, Saiah A. 2004. Prevalence of Cryptosporidium parvum in private drinking water cisterns in Bani-Kenanah district, northern Jordan. Int. J. Environ. Health Res. 14:351–358. 10.1080/09603120400004030 [DOI] [PubMed] [Google Scholar]
- 24.Ahmed W, Hodgers L, Sidhu JPS, Toze S. 2012. Fecal indicators and zoonotic pathogens in household drinking water taps fed from rainwater tanks in southeast Queensland, Australia. Appl. Environ. Microbiol. 78:219–226. 10.1128/AEM.06554-11 [DOI] [PMC free article] [PubMed] [Google Scholar]
- 25.Anonymous. 2010. Low income housing. Built Environment CSIR, Pretoria, South Africa: http://www.csir.co.za/Built_environment/pdfs/low-income_housing_July2010.pdf Accessed 7 September 2012 [Google Scholar]
- 26.Feeley JC, Gibson RJ, Gorman GW, Langford NC, Rasheed JK, Mackel DC, Baine WB. 1979. Charcoal-yeast extract agar: primary isolation medium for Legionella pneumophila. J. Clin. Microbiol. 10:437–441 [DOI] [PMC free article] [PubMed] [Google Scholar]
- 27.Watterworth L, Topp E, Schraft H, Leung K. 2005. Multiplex PCR-DNA probe assay for the detection of pathogenic Escherichia coli. J. Microbiol. Methods 60:93–105. 10.1016/j.mimet.2004.08.016 [DOI] [PubMed] [Google Scholar]
- 28.Ndlovu T, Le Roux M, Khan W, Khan S. 2013. Comparison of diagnostic tools and molecular based techniques for the rapid identification of Escherichia coli and coliforms in contaminated river water. M.S. thesis Cape Peninsula University of Technology, Cape Town, South Africa [Google Scholar]
- 29.Rawlings DE. 1995. Restriction enzyme analysis of 16S rRNA genes for the rapid identification of Thiobacillus ferooxidans, Thiobacillus thiooxidans, Leptospirillum ferooxidans strains in leaching environments, p 9–17 In Jerez CA, Vargas T, Toledo H, Wiertz JV. (ed), International biohydrometallurgical symposium, University of Chile Press, Santiago, Chile. [Google Scholar]
- 30.Jonas D, Rosenbaum A, Weyrich S, Bhakdi S. 1995. Enzyme-linked immunoassay for detection of PCR-amplified DNA of Legionellae in bronchoalveolar fluid. J. Clin. Microbiol. 33:1247–1252 [DOI] [PMC free article] [PubMed] [Google Scholar]
- 31.Kong RYC, Lee SKY, Law TWF, Law SHW, Wu RSS. 2002. Rapid detection of six types of bacterial pathogens in marine waters by multiplex PCR. Water Res. 36:2802–2812. 10.1016/S0043-1354(01)00503-6 [DOI] [PubMed] [Google Scholar]
- 32.Spilker T, Coenye T, Vandamme P, LiPuma JJ. 2004. PCR-based assay for differentiation of Pseudomonas aeruginosa from other Pseudomonas species recovered from cystic fibrosis patients. J. Clin. Microbiol. 42:2074–2079. 10.1128/JCM.42.5.2074-2079.2004 [DOI] [PMC free article] [PubMed] [Google Scholar]
- 33.Khan IUH, Edge TA. 2007. Development of a novel triplex PCR assay for the detection and differentiation of thermophilic species of Campylobacter using 16S-23S rDNA internal transcribed spacer (ITS) region. J. Appl. Microbiol. 103:2561–2569. 10.1111/j.1365-2672.2007.03511.x [DOI] [PubMed] [Google Scholar]
- 34.Stenkova AM, Isaeva MP, Rasskazov VA. 2008. Development of a multiplex PCR procedure for detection of Yersinia genus with identification of pathogenic species (Y. pestis, Y. pseudotuberculosis and Y. enterocolitica). Mol. Genet. Microbiol. Virol. 23:119–125. 10.3103/S0891416808030038 [DOI] [PubMed] [Google Scholar]
- 35.Brisse S, Verhoef J. 2001. Phylogenetic diversity of Klebsiella pneumoniae and Klebsiella oxytoca clinical isolates revealed by randomly amplified polymorphic DNA, gyrA and parC genes sequencing and automated ribotyping. Int. J. Syst. Evol. Microbiol. 51:915–924. 10.1099/00207713-51-3-915 [DOI] [PubMed] [Google Scholar]
- 36.Sturbaum GD, Reed C, Hoover PJ, Jost BH, Marshall MM, Sterling CR. 2001. Species-specific, nested PCR-restriction fragment length polymorphism detection of single Cryptosporidium parvum oocysts. Appl. Environ. Microbiol. 67:2665–2668. 10.1128/AEM.67.6.2665-2668.2001 [DOI] [PMC free article] [PubMed] [Google Scholar]
- 37.Appelbee AJ, Frederick LM, Heitman TL, Olson ME. 2003. Prevalence and genotyping of Giardia duodenalis from beef calves in Alberta, Canada. Vet. Parasitol. 112:289–294. 10.1016/S0304-4017(02)00422-3 [DOI] [PubMed] [Google Scholar]
- 38.Hopkins RM, Meloni BP, Groth DM, Wetherall JD, Reynoldson JA, Thompson RC. 1997. Ribosomal RNA sequencing reveals differences between genotypes of Giardia isolates recovered from humans and dogs living in the same locality. J. Parasitol. 83:44–51 [PubMed] [Google Scholar]
- 39.Jackson VA, Paulse AN, Bester AA, Neethling JH, Khan S, Khan W. 2009. Bioremediation of metal contamination in the Plankenburg River, Western Cape, South Africa. Int. Biodeter. Biodegr. 63:559–568. 10.1016/j.ibiod.2009.03.007 [DOI] [Google Scholar]
- 40.Higgins DG, Sharpe PM. 1988. CLUSTAL: a package for performing multiple sequence alignment on a microcomputer. Gene 73:237–244 [DOI] [PubMed] [Google Scholar]
- 41.Saitou N, Nei M. 1987. The neighbor-joining method: a new method for reconstructing phylogenetic trees. Mol. Biol. Evol. 4:406–425 [DOI] [PubMed] [Google Scholar]
- 42.Tamura K, Nei M, Kumar S. 2004. Prospects for inferring very large phylogenies by using the neighbor-joining method. Proc. Natl. Acad. Sci. U. S. A. 101:11030–11035. 10.1073/pnas.0404206101 [DOI] [PMC free article] [PubMed] [Google Scholar]
- 43.Dungeni M, Momba MNB. 2010. The abundance of Cryptosporidium and Giardia spp. in treated effluents produced by four wastewater treatment plants in the Gauteng Province of South Africa. Water SA 36:425–431 http://www.scielo.org.za/scielo.php?script=sci_arttext&pid=S1816-79502010000400006&lng=en&nrm=iso [Google Scholar]
- 44.Xiao L, Sulaiman IM, Ryan UM, Zhou L, Atwill ER, Tischler ML, Zhang X, Fayer R, Lal AA. 2002. Host adaptation and host-parasite co-evolution in Cryptosporidium: implications for taxonomy and public health. Int. J. Parasitol. 32:1773–1785. 10.1016/S0020-7519(02)00197-2 [DOI] [PubMed] [Google Scholar]
- 45.Altschul SF, Gish W, Miller W, Myers EW, Lipman DJ. 1990. Basic local alignment search tool. J. Mol. Biol. 215:403–410 [DOI] [PubMed] [Google Scholar]
- 46.Ahmed W, Sritharan T, Palmer A, Sidhu JPS, Toze S. 2013. Evaluation of bovine feces-associated microbial source tracking markers and their correlations with fecal indicators and zoonotic pathogens in a Brisbane, Australia, reservoir. Appl. Environ. Microbiol. 79:2682–2691. 10.1128/AEM.03234-12 [DOI] [PMC free article] [PubMed] [Google Scholar]
- 47.Gawler AH, Beecher JE, Brandão J, Carroll NM, Gourmelon M, Masterson B, Nunes B, Porter J, Rincé A, Rodrigues R, Thorp M, Walters JM, Meijer WG. 2007. Validation of host-specific Bacteroidales 16S rRNA genes as markers to determine the origin of fecal pollution in Atlantic Rim countries of the European Union. Water Res. 41:3780–3784. 10.1016/j.watres.2007.01.028 [DOI] [PubMed] [Google Scholar]
- 48.Palleroni NJ. 1992. Present situation of the taxonomy of aerobic pseudomonads, p 105–115 In Galli E, Silver S, Witholt B. (ed), Pseudomonas: molecular biology and biotechnology. ASM Press, Washington, DC [Google Scholar]
- 49.Schroth M, Hildebrand DC, Panopoulos N. 1992. Phytopathogenic pseudomonads and plant-associated pseudomonads, p 3104–3131 In Balows A, Trüper HG, Dworkin M, Harder W, Schleifer K-H. (ed), The prokaryotes, 2nd ed, vol 3 Springer-Verlag, New York, NY [Google Scholar]
- 50.Barrett EL, Solanes RE, Tang JS, Palleroni NJ. 1986. Pseudomonas fluorescens biovarf V: its resolution into distinct component groups and the relationship of these groups to other P. fluorescens biovars, to P. putida, and to psychrotrophic pseudomonads associated with food spoilage. J. Gen. Microbiol. 132:2709–2721 [DOI] [PubMed] [Google Scholar]
- 51.Janda JM, Abbott SL. 1998. Evolving concepts regarding the genus Aeromonas: an expanding panorama of species, disease presentations, and unanswered questions. Clin. Infect. Dis. 27:332–344 [DOI] [PubMed] [Google Scholar]
- 52.Janda JM, Abbott SL, Morris JG., Jr 1995. Aeromonas, Plesiomonas, and Edwardsiella, p 905–917 In Blaser MJ, Smith PD, Ravdin JI, Greenberg HB, Guerrant RL. (ed), Infections of the gastrointestinal tract. Raven Press, New York, NY [Google Scholar]
- 53.Kühn I, Allestam G, Huys G, Janssen P, Kersters K, Krovacek K, Stenström TA. 1997. Diversity, persistence, and virulence of Aeromonas strains isolated from drinking water distribution systems in Sweden. Appl. Environ. Microbiol. 63:2708–2715 [DOI] [PMC free article] [PubMed] [Google Scholar]
- 54.Albrechtsen HJ. 2002. Microbiological investigations of rainwater and graywater collected for toilet flushing. Water Sci. Technol. 46:311–316 http://www.iwaponline.com/wst/04606/wst046060311.htm [PubMed] [Google Scholar]
- 55.Power KN, Nagy LA. 1999. Relationship between bacterial regrowth and some physical and chemical parameters within Sydney's drinking water distribution system. Water Res. 33:741–750 [Google Scholar]
- 56.Kaushik R, Balasubramanian R, De La Cruz AA. 2012. Influence of air quality on the composition of microbial pathogens in fresh rainwater. Appl. Environ. Microbiol. 78:2813–2818. 10.1128/AEM.07695-11 [DOI] [PMC free article] [PubMed] [Google Scholar]
- 57.Gassama A, Sow PS, Fall F, Camara P, Philippe H, Guèye-N′Diay A, Seng R, Samb B, M'Boup S, Germani Y, Aidara-Kane A. 2001. Ordinary and opportunistic enteropathogens associated with diarrhea in Senegalese adults in relation to human immunodeficiency virus serostatus. Int. J. Infect. Dis. 5:192–198. 10.1016/S1201-9712(01)90069-4 [DOI] [PMC free article] [PubMed] [Google Scholar]
- 58.Koplan JP, Deen RD, Swanston WH, Tota B. 1978. Contaminated roof-collected rainwater as a possible cause of an outbreak of salmonellosis. J. Hyg. (Cambr.) 81:303–309 [DOI] [PMC free article] [PubMed] [Google Scholar]
- 59.Zandri G, Pasquaroli S, Vignaroli C, Talevi S, Manso E, Donelli G, Biavasco F. 2012. Detection of viable but non-culturable staphylococci in biofilms from central venous catheters negative on standard microbiological assays. Clin. Microbiol. Infec. 18:E259–E261. 10.1111/j.1469-0691.2012.03893.x [DOI] [PubMed] [Google Scholar]
- 60.Lloyd B. 1983. Yersinia and yersiniosis, p 327–330 In Feachem RG, Bradley DJ, Garelick H, Mara DD. (ed), Sanitation and disease: health aspects of excreta and wastewater management. John Wiley and Sons, Chichester, United Kingdom [Google Scholar]
- 61.Delgado-Viscogliosi P, Solignac L, Delattre JM. 2009. Viability PCR, a culture-independent method for rapid and selective quantification of viable Legionella pneumophila cells in environmental water samples. Appl. Environ. Microbiol. 75:3502–3512. 10.1128/AEM.02878-08 [DOI] [PMC free article] [PubMed] [Google Scholar]
- 62.NHMRC, NRMMC. 2011. Australian drinking water guidelines. Paper 6, national water quality management strategy. National Health and Medical Research Council, National Resource Management Ministerial Council, Commonwealth of Australia, Canberra, Australia [Google Scholar]
- 63.U.S. Environmental Protection Agency. 2005. Microbial source tracking guide. EPA/600/R-05/064. U.S. Environmental Protection Agency, Washington, DC [Google Scholar]
- 64.WHO. 2004. Guidelines for drinking water quality, 3rd ed. World Health Organization, Geneva, Switzerland [Google Scholar]