

Abstract
Piperacillin-tazobactam is often given to infants with severe infection in spite of limited pharmacokinetics (PK) data. We evaluated piperacillin-tazobactam PK in premature and term infants of ages <61 days with suspected systemic infection. Infants received intravenous piperacillin-tazobactam (80 to 100 mg/kg of body weight every 8 h [q 8 h]) based on gestational and postnatal age. Sparse plasma samples were obtained after first and multiple doses. Drug concentrations were measured by tandem mass spectrometry. PK data were analyzed using population nonlinear mixed-effect modeling. Target attainment rates for the time unbound piperacillin concentrations remained above the MIC for 50% and 75% of the dosing interval at steady state were evaluated. Bias in population PK parameter estimates was assessed for dried blood spot (DBS) samples, and a comparability analysis was performed for DBS and plasma drug concentrations using linear regression. We obtained 128 plasma samples from 32 infants, median gestational age of 30 weeks (range, 23 to 40 weeks) and postnatal age of 8 days (range, 1 to 60). Piperacillin and tazobactam PK models included body weight (WT) and postmenstrual age (PMA) as covariates for clearance and WT for volume of distribution and were used to optimize dosing in infants. DBS drug concentrations were 50 to 60% lower than those in plasma, but when combined with plasma concentrations and a matrix effect, the data generated PK model parameters similar to those for plasma alone. With PMA-based dosing (100 mg/kg q 8 h, 80 mg/kg q 6 h, and 80 mg/kg q 4 h for PMA of ≤30, 30 to 35, and 35 to 49 weeks, respectively), 90% of simulated infants achieved the surrogate therapeutic target of time above the MIC (≤32 mg/liter) for 75% of the dosing interval.
INTRODUCTION
Piperacillin-tazobactam is approved by the U.S. Food and Drug Administration for the treatment of adults and children of >2 months of age with infections due to susceptible bacteria; however, the drug is not approved for use in younger infants, including those born prematurely. In spite of this, piperacillin-tazobactam is extensively used “off-label” in young infants for treatment of systemic infections, including bacteremia and complicated intra-abdominal infections, such as necrotizing enterocolitis (1). Because these infections in premature infants are associated with devastating outcomes, such as death and neurodevelopmental impairment (2, 3), appropriate dosing recommendations for agents such as piperacillin-tazobactam are needed. Recommended piperacillin-tazobactam dosing for young infants in sources like Neofax (4) and The Harriet Lane Handbook (5) rely on combinations of birth weight, gestational age, postmenstrual age (PMA), and postnatal age (PNA), which are cumbersome to implement clinically and more importantly are supported by very small and limited clinical trials in this population.
The pharmacokinetics (PK) of piperacillin-tazobactam has not been well characterized for premature infants. The drug is primarily renally eliminated by glomerular filtration and tubular secretion (6); therefore, physiologic changes in renal function during infant development are expected to affect drug elimination, resulting in dosing modifications. This is evidenced by an effect of PMA, body weight, and PNA on piperacillin-tazobactam clearance observed in a recent study evaluating the PK of this drug in infants of <2 months of age (7).
PK studies in young infants are exceedingly scarce, due in large part to the difficulty in obtaining repeated blood samples in numbers sufficient to accurately estimate both individual and population-specific PK parameters. To overcome this challenge, the use of ultra-low-volume sampling techniques, such as dried blood spots (DBS), to evaluate the PK of drugs is increasing. DBS sampling requires only 20 to 30 μl of whole blood for PK sampling—an approximately 20-times-lower sample volume than in traditional venous or arterial samples—and allows collection via heal stick. The advantages of DBS extend beyond favorable PK sample volumes; DBS does not require centrifugation or freezing of the sample prior to analysis. Despite the attributes of DBS and the fact that the technology has been used for decades in pediatrics for screening of inborn errors of metabolism, its use to support pediatric PK studies is limited to two published reports that evaluated the PK of metronidazole with DBS samples (8, 9). The utility of DBS, however, can be drug dependent based on drug partitioning into red blood cells, as well as drug stability, on blotting paper. To address this information gap, we conducted a PK study of piperacillin-tazobactam in young infants using plasma and DBS samples.
MATERIALS AND METHODS
Study design.
This was an open-label, prospective, early-phase, multicenter (n = 4) PK and safety study of piperacillin-tazobactam conducted in 2010-2011 in young infants of <61 days PNA with suspected systemic infection. Enrollment was stratified by gestational age (GA) at birth and PNA, as follows: cohort 1, <32 weeks GA, <14 days PNA; cohort 2, <32 weeks GA, ≥14 days PNA; cohort 3, ≥32 weeks GA, <14 days PNA; and cohort 4, ≥32 weeks GA, ≥14 days PNA. Infants were excluded if they had a history of anaphylaxis to piperacillin-tazobactam, urine output of <0.5 ml/kg/h, and serum creatinine (SCR) level of >1.2 mg/dl. Piperacillin-tazobactam was administered intravenously over 30 min at a dose of 80 mg/kg of body weight every 8 h (q 8 h) for all infants except those in cohort 4, who received 100 mg/kg every 8 h. Clinical data were collected through an electronic data capture system and included demographic information (e.g., GA, PNA, birth weight, current weight, race, sex, and ethnicity), laboratory values (e.g., SCR, total bilirubin, alanine aminotransferase [ALT], and albumin) if obtained with routine medical care, concomitant medications of interest (all antimicrobials and vasopressors), and microbiological cultures from sterile sites. The study was approved by the institutional review boards at each center, and informed consent was obtained from a parent or guardian prior to enrollment.
PK sample collection.
Sparse PK samples (200 μl) were collected around the first dose and after a minimum of three doses at the following times: within 60 min prior to infusion of study drug and within 15 to 45 min, 3 to 4 h, and 5 to 7 h after the end of the infusion. Due to the critically ill nature of the subjects, deviation from the planned sampling scheme occurred. Blood samples were collected in EDTA tubes, refrigerated or placed on ice immediately after collection, and then centrifuged (4°C) for 10 min. Plasma was transferred into cryovials prior to storage at −70°C. DBS samples (∼30 μl) were collected at the same time as plasma PK samples by directly placing (spotting) whole blood into DMPK FTA type C cards (Whatman, GE Healthcare, Maidstone, Kent, United Kingdom); two spots were collected at each time point on the same card and were stored at −70°C prior to analysis. Samples from all participating sites were shipped on dry ice to a central laboratory, where they were stored at −70°C for a maximum of 11 months prior to analysis.
Bioanalytical assay.
A high-performance liquid chromatography-tandem mass spectrometry (HPLC/MS/MS) assay for piperacillin and tazobactam detection in human plasma suitable for small plasma volumes was developed and validated (10). Sample analysis was performed using a triple-quadrupole mass spectrometer, API 4000 (Applied Biosystems-ABSciex, Foster City, CA, USA), operated with electrospray ionization (TurboV source using a TurboIonSpray probe). Instrument parameters were optimized for piperacillin (518.2 → 143.2 m/z) and tazobactam (299.0 → 137.9 m/z) transitions. Piperacillin and tazobactam were extracted from plasma via protein precipitation and from DBS (6.0-mm punch; Harris Uni-Core, Fisher Scientific, Norcross, GA, USA) using a methanol solvent (75% methanol-water). HPLC separation was achieved using a reverse-phase C18 Aquasil column (Thermo Fisher, Waltham, MA, USA) with a flow rate of 0.75 ml/min using a gradient mobile phase. Total run time was 6 min. The lower limits of quantitation of piperacillin and tazobactam in plasma and DBS were 0.30 mg/liter and 0.15 mg/liter, respectively. Intraday and interday coefficients of variation for both compounds in plasma and DBS were <11% at concentrations ranging from 0.15 to 150 mg/liter. Two independent reviewers inspected all DBS samples for appropriate spotting. DBS samples with blood spotting outside of the predefined spotting area or samples contaminating adjacent spots were labeled invalid and excluded from the analysis.
Population PK analysis.
PK data were analyzed with nonlinear mixed-effect modeling in the software program NONMEM (version 7.2) in conjunction with WINGS for NONMEM, version 7.03 (Auckland, New Zealand). Plasma samples were used in the model-building process. Output was summarized using the software program STATA 12 (College Station, TX, USA). The first-order conditional estimation method with interaction was used for all model runs. One- and two-compartment structural PK models were evaluated. Interindividual (IIV) random effects were evaluated for the clearance (CL) and volume (V) parameters. An exponential model for IIV variance was used, and a proportional plus additive error model was deemed appropriate to describe residual variability. The potential impact of clinical covariates on PK parameters was explored if a relationship was suggested by visual inspection of scatter and box plots (continuous and categorical variables, respectively) of the individual deviations from the population-typical value for CL and V (ETAs) against covariates. Body weight was assumed to be a significant covariate for CL and V and was included in the base model prior to assessment of other potential covariates. The following covariates were evaluated: GA (weeks), PNA (days), PMA (defined as GA plus PNA in weeks [PNA/7]), SCR, urine creatinine, total protein, albumin, blood urea nitrogen, race, sex, and concomitant medication use (gentamicin, dopamine, and epinephrine). Once covariates were identified by visual inspection and physiologic plausibility, incorporation of covariates into the model was planned via standard forward-addition, backward-elimination methods. Covariates that reduced the objective function by more than 3.84 (P < ∼0.05) during univariable analysis were included in a subsequent multivariable analysis. In the multivariable step, a reduction of 6.64 (P < ∼0.01) was required for retention of a covariate in the final model. Continuous covariates were scaled to their median values. Covariates that exhibited time-dependent changes (e.g., weight and PNA) were permitted to change with time. Missing body weights and laboratory values were imputed to be the closest value carried forward or back filled for up to 7 days. Missing SCR values were imputed based on an exponential model of SCR and PMA derived from the data (11). Empirical Bayesian estimates of individual infant PK parameters were generated from the final model using the post hoc subroutine and were summarized by cohort.
Model evaluation.
Models were evaluated based on successful minimization, goodness-of-fit plots, precision of parameter estimates, bootstrap procedures, and visual predictive check. The precision of the final population PK model parameter estimates were evaluated using nonparametric bootstrapping (1,000 replicates) to generate the 95% confidence intervals for parameter estimates. For the visual predictive check, the final model was used to generate 1,000 Monte Carlo simulation replicates per time point of piperacillin-tazobactam exposure, and simulated results were compared with those observed in the study. The number of observed concentrations outside of the 90% prediction interval for each time point was quantified. The dosing and covariate values used to generate the simulations in the visual predictive check were the same as those used in the study population.
Assessment of dose-exposure relationship.
The piperacillin model was used to evaluate the dose-exposure relationship because the piperacillin component of piperacillin-tazobactam is used for dosing (5). For a target efficacy exposure, we used the time above MICs of 0.5 to 32 mg/liter as the surrogate pharmacodynamic (PD) endpoint (12–15). This range of MICs is consistent with MICs found in causative agents of infections in premature infants and includes the susceptibility breakpoints for the Enterobacteriaceae (16 mg/liter) and for Pseudomonas aeruginosa (32 mg/liter) (16–18). We used unbound (30% protein-binding [19]) piperacillin concentrations at 50% and 75% of the dosing interval as the surrogate PD target. We included the more stringent surrogate PD endpoint (75% of the dosing interval) due to the immunocompromised state of premature infants and the need to achieve effective drug concentrations for a longer period of time to achieve bacterial killing (20). We used the individual empirical Bayesian estimates from the final model and the dosing evaluated in this study to predict steady-state drug concentrations and calculate the proportion of subjects who met the surrogate PD targets.
The final piperacillin population PK model was also used to explore dose-exposure relationships of commonly used piperacillin-tazobactam dosing recommendations listed in Neofax (4) and The Harriet Lane Handbook (5). Monte Carlo simulations were used to simulate piperacillin exposures for 1,000 subjects randomly selected from a large deidentified administrative database (21). This administrative database contains information for all infants (n = ∼800,000) discharged from 322 U.S. neonatal intensive care units from 1997 to 2011. The analysis was approved by the Duke University Institutional Review Board without the need for written informed consent since the data were collected without patient identifiers. Demographic ranges for GA, PNA, PMA, and SCR were included when generating the random sample to match demographic distribution of study subjects. Subjects were randomly selected from all infants with suspected infection, defined as having a blood culture obtained and receiving ampicillin, gentamicin, or both on the day of the culture. Random numbers were generated from the uniform distribution using the pseudorandom number generator from the STATA 12 software program (StataCorp, College Station, TX, USA). The proportion of simulated subject profiles that met the surrogate PD target was calculated for each dosing recommendation guideline and for various MICs. We also compared piperacillin exposures in the study population with exposures achieved in adults treated with piperacillin for highly resistant (MIC ≥ 16 mg/liter) infections (22).
DBS analysis.
Differences in drug concentrations between plasma and DBS specimens were evaluated in the random-effects error model of the final population model using a fixed-effect parameter (θDBS), as well as separate residual variability estimates for plasma and DBS samples in the NONMEM program. In addition, population PK parameters were estimated using plasma samples alone as well as both plasma and DBS samples (NONMEM). In addition, weighted linear regression was used to evaluate the correlation between plasma and DBS piperacillin-tazobactam concentrations in paired plasma-DBS samples, as well as the correlation between the DBS-to-plasma concentration ratio and plasma concentrations using STATA 12 (StataCorp, College Station, TX, USA).
RESULTS
Study population.
Thirty-two subjects from four centers were enrolled (Table 1). The cohort represented a sample of critically ill patients who required medical treatment with piperacillin-tazobactam based either on microbiologic culture results or signs of systemic infection. At baseline, 63% of subjects had a history of hyperbilirubinemia, 53% had neonatal respiratory distress syndrome, and 25% had thrombocytopenia. A history of anemia, hypoglycemia, neonatal apnea, respiratory failure, and hypotension was each reported in 22% of the participants.
TABLE 1.
Demographics and clinical data
| Characteristic | Value or identifier for groupa |
||||
|---|---|---|---|---|---|
| GA < 32 wks |
GA ≥ 32 wks |
Total | |||
| PNA < 14 days | PNA ≥14 days | PNA < 14 day | PNA ≥14 days | ||
| Cohort no. | 1 | 2 | 3 | 4 | |
| No. of subjects | 12 | 9 | 8 | 3 | 32 |
| Doseb (mg/kg) | 80 (50–101) | 80 (54–98) | 80 (75–81) | 79 (72–105) | 80 (50–105) |
| GA (wks) | 28 (26–32) | 28 (23–32) | 38 (32–40) | 37 (33–40) | 30 (23–40) |
| PNA (days) | 2 (1–14) | 28 (15–60) | 1 (1–12) | 43 (30–59) | 8 (1–60) |
| PMA (wks) | 29 (27–32) | 33 (25–37) | 39 (32–41) | 43 (37–48) | 32 (25–48) |
| Wt (g) | 1,109 (727–1,580) | 1,397 (473–1,855) | 3,248 (1,480–3,990) | 3,050 (2,300, 3,050) | 1,439 (473–3,990) |
| SCR (mg/dl) | 0.8 (0.6–2.0) | 0.8 (0.4–1.9) | 0.8 (0.3–1.1) | 0.6 (0.3–0.7) | 0.8 (0.3–2.0) |
| % with: | |||||
| Gentamicin use | 33 | 100 | 75 | 33 | 63 |
| Dopamine use | 17 | 11 | 13 | 0 | 13 |
| Epinephrine use | 8 | 0 | 13 | 0 | 6 |
| % Male | 67 | 78 | 38 | 67 | 63 |
Data are median (range), unless otherwise indicated.
Piperacillin component (piperacillin-tazobactam were given in combination at a fixed ratio of 8:1).
PK specimens.
Of 136 plasma PK samples collected, 8 (6%) were excluded from the population PK analysis: 1 was an extreme outlier concentration (>10-fold difference from the predicted concentration), 5 had sampling errors or potential contamination that could not be confirmed, and 2 were drawn during catheter flush. After exclusion of these samples, 128 timed plasma samples were used in the population PK modeling process. Sample collection was evenly distributed in the following sampling windows: 0 to 2 h (24%), 2 to 4.5 h (29%), 4.5 to 6.5 h (22%), and 6.5 to 9 h (25%) after dose. The median piperacillin and tazobactam concentrations were 103.5 (9.1 to 454.0) mg/l and 11.2 (0.9 to 36.2) mg/l, respectively. A median (range) of 4 (2 to 7) plasma samples were collected per infant. Fifty-five DBS samples (47 concurrent with plasma) from 32 subjects were collected; 10 were invalidated.
Population PK model building.
Application of standard goodness-of-fit criteria revealed that a one-compartment structural PK model and a proportional plus additive error model provided the best fit of the drug concentration-versus-time data (Fig. 1 and 2). Body weight was included in the base CL and V models using a power function with a fixed exponent of 1 (Table 2). Estimation of the body size exponent (weightθ) and allometric scaling (weight3/4) of CL were explored as potential body size models for CL; however, they were rejected due to lack of improvement in model fit. Inclusion of weight as a covariate on V resulted in a between-subject variability of V estimate close to 0 (boundary value). Consequently, between-subject variability of V was fixed to 0 for subsequent model-building steps. PMA, SCR, and concurrent gentamicin administration showed correlation with individual deviations from the typical CL value (ETA1) and resulted in a significant decrease in the objective function value (OFV) for both piperacillin and tazobactam (Table 2). The largest drop in OFV occurred when SCR and gentamicin use (GENT) were added to the piperacillin model and when SCR, GENT, and PMA were added to the tazobactam model (Table 2). However, a piperacillin model incorporating only PMA performed well and was selected as the final model to optimize dosing. This decision was made because PMA-based dosing is more clinically applicable, and SCR values in the first week of life are unreliable (23, 24). In addition, the concurrent gentamicin therapy covariate was confounded by age differences between infants who received gentamicin and those who did not (median [range] PMA, 33.6 [25.6, 43.4] weeks, and PNA, 14.5 [1, 60] days, versus PMA, 29.4 [27.4, 48] weeks, and PNA, 2 [1, 59] days, respectively). The tazobactam model incorporating SCR, GENT, and PMA was chosen as the final tazobactam model based on goodness-of-fit criteria; however, empirical Bayesian estimates for CL did not differ between this final tazobactam model and the intermediate PMA on CL tazobactam model. SCR and GENT were kept in the final model for tazobactam because it was the most “appropriate” model, since it related to statistical considerations of goodness of fit and decrease in the objective function value; however, the tazobactam model was not used for dosing simulations or recommendations.
FIG 1.

Final piperacillin population PK model diagnostic plots: observed versus individual predictions (A), visual predictive check (B), and conditional weighted residuals (CWRES) versus population predictions (C), or time (D). For panel A, the line of identity is included as a reference. For panel B, solid black circles represent observed concentrations, the shaded gray area represents the 90% prediction interval, and solid and dashed black lines represent observed and predicted median concentrations, respectively. For panels C and D, a solid line at y = 0 is included as a reference.
FIG 2.

Final tazobactam population PK model diagnostic plots: observed versus individual predictions (A), visual predictive check (B), and conditional weighted residuals versus population predictions (C), or time (D). For panel A, the line of identity is included as a reference. For panel B, solid black circles represent observed concentrations, the shaded gray area represents the 90% prediction interval, and solid and dashed black lines represent observed and predicted median concentrations, respectively. For panels C and D, a solid line at y = 0 is included as a reference.
TABLE 2.
Significant steps in piperacillin-tazobactam population plasma PK model-building processa
| Population model | OFV | ΔOFVb |
|---|---|---|
| Piperacillin | ||
| V = θV · WT | 1,125 | |
| CL = θCL · WT | 1,125 | |
| CL = θCL · WT · (PMA/33)COVPMA | 1,113 | −12 |
| CL = θCL · WT · (SCR/0.5)COVSCR | 1,106 | −19 |
| CL = θCL · WT · (SCR/0.5)COVSCR · COVGENTGENT | 1,093 | −13 |
| CL = θCL · WT · (SCR/0.5)COVSCR · COVGENTGENT · (PMA/33)COVPMA | 1,092 | −1 |
| Tazobactam | ||
| V = θV · WT | 509 | |
| CL = θCL · WT | 509 | |
| CL = θCL · WT · (PMA/33)COVPMA | 491 | −18 |
| CL = θCL · WT · (SCR/0.5)COVSCR | 491 | −18 |
| CL = θCL · WT · (SCR/0.5)COVSCR · COVGENTGENT | 480 | −11 |
| CL = θCL · WT · (SCR/0.5)COVSCR · COVGENTGENT · (PMA/33)COVPMA | 470 | −10 |
WT, actual body weight (kg); SCR, serum creatinine (mg/dl); GENT = 1 if gentamicin was given concurrently with piperacillin-tazobactam, and GENT = 0 if there was no concurrent therapy; PMA, postmenstrual age (weeks); OFV, objective function value.
For multivariable models, the change in OFV is relative to the prior model.
Population PK model evaluation.
The piperacillin (PMA on CL) and tazobactam (PMA, GENT, and SCR on CL) models had good precision as evidenced by relative standard errors around the CL and V parameter point estimates of 8 to 10% and by 95% confidence intervals generated by bootstrapping (n = 1,000 simulated trials) (Tables 3 and 4). Goodness-of-fit diagnostic plots for the final models are shown in Fig. 1 and 2; 13% (17/128) and 10% (13/128) of observed concentrations were outside the 90% prediction intervals for piperacillin and tazobactam, respectively.
TABLE 3.
Piperacillin PMA-based final model parameters, bootstrap results, and DBS estimatesa
| Parameter | Point estimate | % RSE | Bootstrap CI |
Point estimate with DBS | ||
|---|---|---|---|---|---|---|
| 2.5% | Median | 97.5% | ||||
| Typical CL value (liters/kg/h) | 0.080 | 7.9 | 0.068 | 0.080 | 0.093 | 0.079 |
| Typical V value (liters/kg) | 0.42 | 9.6 | 0.36 | 0.42 | 0.51 | 0.43 |
| PMA covariate | 1.76 | 33.6 | 0.68 | 1.76 | 2.97 | 1.72 |
| DBS matrix factor | 0.38 | |||||
| CL interindividual variability (CV [%]) | 37 | 27.5 | 25 | 36 | 48 | 36 |
| Proportional residual error (CV [%]) | 33 | 9.9 | 23 | 31 | 38 | 30 |
| Plasma additive residual error (mg/liter) | 6.90 | 42.6 | 2.22 | 7.41 | 17.84 | 10.1 |
| DBS additive residual error (mg/liter) | NA | NA | NA | NA | NA | 0.95 |
| DBS correction factor | NA | NA | NA | NA | NA | 0.38 |
CI, confidence interval; CV, coefficient of variation; RSE, relative standard error; NA, not analyzed.
TABLE 4.
Tazobactam final irreducible model parameters, bootstrap results, and DBS estimatesa
| Parameter | Point estimate | % RSE | Bootstrap CI |
Point estimate with DBS | ||
|---|---|---|---|---|---|---|
| 2.5% | Median | 97.5% | ||||
| Typical CL value (liters/kg/h) | 0.088 | 8.9 | 0.072 | 0.088 | 0.105 | 0.085 |
| Typical V value (liters/kg) | 0.57 | 5.4 | 0.52 | 0.57 | 0.64 | 0.59 |
| PMA covariate | 1.35 | 27.3 | 0.53 | 1.32 | 2.31 | 1.47 |
| SCR covariate | −0.35 | 37.0 | −0.70 | −0.35 | −0.07 | −0.31 |
| GENT covariate | 1.52 | 10.1 | 1.26 | 1.53 | 1.91 | 1.56 |
| DBS matrix factor | 0.48 | |||||
| CL interindividual variability (CV [%]) | 23 | 34.0 | 12 | 21 | 30 | 24 |
| Proportional residual error (CV [%]) | 24 | 19.8 | 11 | 23 | 30 | 27 |
| Plasma additive residual error (mg/liter) | 1.43 | 51.2 | 11.0 | 22.7 | 30.2 | 1.26 |
| DBS additive residual error (mg/liter) | NA | NA | NA | NA | NA | 0.13 |
GENT is concurrent gentamicin administration (GENT = 1). Abbreviations are as defined in footnote a of Table 3.
Bayesian estimates of CL, V, and half-life.
The median individual empirical Bayesian estimates for piperacillin CL, V, and apparent elimination half-life, as well as predicted concentrations at the end, 75%, and 50% of the dosing interval at steady state, are summarized by age cohort (Table 5). Empirical Bayesian estimates of piperacillin CL were similar and highly correlated with those from the final and intermediate PMA tazobactam models (r2 = 0.95, slope = 0.83 [95% confidence interval, 0.76, 0.90], P < 0.001; and r2 = 0.94, slope = 0.82 [0.74, 0.89], P < 0.001, respectively); the relationship between empirical Bayesian piperacillin estimates and PMA is depicted in Fig. 3. There was a trend toward increasing median piperacillin weight-normalized CL and decreasing half-life between cohort 1 and cohorts 2 and 3. In spite of important differences in PMA, infants in cohort 4 had median CL similar to that for infants in the youngest age cohort (Table 5). Similar trends were observed for tazobactam (data not shown). Cohort 4 had limited enrollment (n = 3). Of the three infants enrolled in this study, two had low estimated CL (0.062 and 0.065 liters/h/kg, respectively) as well as renal and hepatic dysfunction. The remaining infant in this cohort did not have organ dysfunction, and CL was much higher (0.177 liters/h/kg).
TABLE 5.
Piperacillin individual empirical Bayesian post hoc parameter estimatesa
| Cohort | CL (liters/h/kg) | V (liters/kg)b | Half-life (h) | Cmin ss (mg/liter) | C75 ss (mg/liter) | C50 ss (mg/liter) |
|---|---|---|---|---|---|---|
| 1 | 0.055 (0.034, 0.137) | 0.42 | 5.3 (2.1, 8.6) | 38.3 (7.4, 48.4) | 51.9 (16.9, 58.9) | 71.1 (38.6, 75.6) |
| 2 | 0.116 (0.033, 0.142) | 0.42 | 2.5 (2.1, 8.9) | 34.6 (5.5, 48.4) | 48.5 (13.5, 58.9) | 69.1 (33.6, 75.6) |
| 3 | 0.104 (0.063, 0.142) | 0.42 | 2.8 (2.1, 4.6) | 28.0 (1.3, 48.4) | 41.9 (4.7, 58.9) | 64.3 (17, 75.6) |
| 4 | 0.065 (0.062, 0.177) | 0.42 | 4.5 (1.7, 4.7) | 31.1 (1.5, 60.2) | 48.2 (5.7, 73.4) | 76.6 (20.7, 94.5) |
| Overall | 0.085 (0.033, 0.177) | 0.42 | 3.5 (1.7, 8.9) | 30.1 (1.3, 60.2) | 44.1 (4.7, 73.4) | 66.2 (17.0, 94.5) |
Data are median (range) values. C75 ss, C50 ss, and Cmin ss are predicted concentrations at 75%, 50%, and the end of the dosing interval at steady state, respectively, using individual empirical Bayesian estimates.
No between-subject variability for V; empirical Bayesian post hoc parameter estimate is the same as the population parameter estimate.
FIG 3.
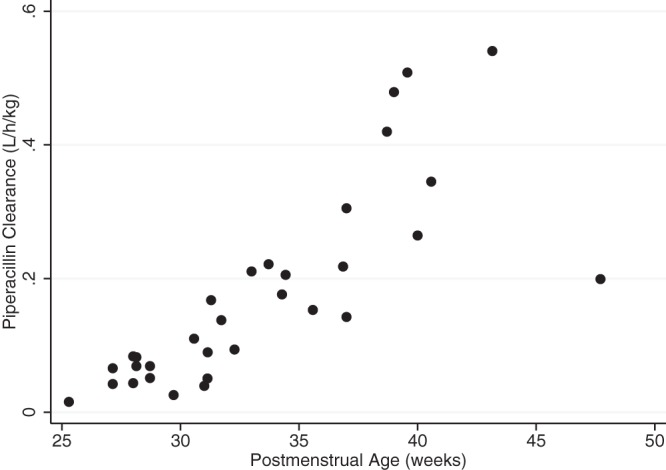
Individual Bayesian piperacillin clearance estimates from the final model versus postmenstrual age.
Dose-exposure relationship.
When using doses prescribed in the study, 94% and 53% of infants achieved predicted unbound piperacillin concentrations above 16 mg/liter and 32 mg/liter, respectively, for 75% of the dosing interval and 100% and 94%, respectively, for 50% of the dosing interval (Table 5). When using the PMA-based dosing scheme, >90% of subjects enrolled in the study achieved the surrogate PD target (unbound piperacillin concentrations of 32 mg/liter for 75% of dosing interval). Monte Carlo simulations performed with virtual subjects randomly selected from a clinical care database showed that the PMA-based dosing regimen (Table 6) achieved the surrogate PD target (unbound piperacillin concentrations of 32 mg/liter for 75% of the dosing interval) in >90% of simulated infants for all evaluated MICs (Fig. 4). This target was also achieved in about 80% of simulated infants in the oldest PMA group (35 to 49 weeks) when the dosing interval was extended to 6 h. In addition, this dosing regimen achieved exposures comparable to those seen in adult patients receiving piperacillin-tazobactam for highly resistant infections (predicted drug concentration at the end of the dosing interval at steady state [Cmin ss], 27.6 mg/liter following a dose of 4.5g q 8 h infused over 4 h) (22). The PMA-dosing regimen also compared favorably with dosing regimens recommended in Neofax and The Harriet Lane Handbook that use multiple PMA-PNA and GA-PNA categories, respectively (Table 6 and Fig. 4). The simulation results indicate that the Neofax and Harriet Lane regimens achieved high target attainment rates (>90% of patients with predicted concentrations at 75% at steady state [C75 ss] greater than the MIC) for a MIC of ≤8 mg/liter. As the MIC increased beyond 8 mg/liter, however, overall target attainment rates of the Neofax and Harriet Lane regimens dropped to 75% and 37% and to 78% and 28% for MICs of 16 and 32 mg/liter, respectively. A PMA-based dosing regimen with prolonged infusion (2 to 4 h) achieved >90% target attainment rates for a MIC of ≤32 mg/liter overall and for each study group; however, no clear advantage was observed over the short (30-min) infusion (Fig. 4). The overall predicted maximum and minimum concentrations [mean (range)] of piperacillin at steady state for the PMA dosing regimen with short infusion were 116.9 (42.5, 197.6) mg/liter and 43.5 (12.9, 60.5) mg/liter, respectively, while those for the PMA dosing regimen with extended infusion were 94.2 (40.5, 130.5) mg/liter and 54.3 (24.5, 72.3) mg/liter, respectively.
TABLE 6.
Dosing schemes evaluated
| Regimen | GA (wks) | PMA (wks) | PNA (days) | Dose (mg/kg) | Dosing interval (h) | Infusion (h) |
|---|---|---|---|---|---|---|
| Protocol | <32 | <14 | 80 | 8 | 0.5 | |
| <32 | ≥14 | 80 | 8 | 0.5 | ||
| ≥32 | <14 | 80 | 8 | 0.5 | ||
| ≥32 | ≥14 | 100 | 8 | 0.5 | ||
| Neofax | ≤29 | 0–28 | 100 | 12 | 0.5 | |
| ≤29 | >28 | 100 | 8 | 0.5 | ||
| 30–36 | 0–14 | 100 | 12 | 0.5 | ||
| 30–36 | >14 | 100 | 8 | 0.5 | ||
| 37–44 | 0–7 | 100 | 12 | 0.5 | ||
| 37–44 | >7 | 100 | 8 | 0.5 | ||
| >45 | (All) | 100 | 8 | 0.5 | ||
| Harriet Lane | ≤36 | ≤7 | 75 | 12 | 0.5 | |
| >36 | ≤7 | 75 | 8 | 0.5 | ||
| ≤36 | >7 | 75 | 8 | 0.5 | ||
| >36 | >7 | 75 | 6 | 0.5 | ||
| PMA-based (extended infusion) | ≤30 | 100 | 8 | 4 | ||
| 30–35 | 80 | 6 | 3 | |||
| 35–49 | 80 | 4 | 2 | |||
| PMA-based (short infusion) | ≤30 | 100 | 8 | 0.5 | ||
| 30–35 | 80 | 6 | 0.5 | |||
| 35–49 | 80 | 4 | 0.5 |
FIG 4.

Target attainment rates by MIC for concentrations at 75% (A) or 50% (B) of the dosing interval in 1,000 subjects randomly selected from the database. PMA, postmenstrual age dosing regimen. The solid red line represents 90%.
DBS analysis.
There were 37 DBS-plasma concentration pairs included in the NONMEM and linear regression analysis. On average, piperacillin and tazobactam concentrations in DBS samples were 62% and 52% lower than those measured from plasma, respectively (Tables 3 and 4). Addition of DBS samples to the final NONMEM model (PMA on CL) did not introduce significant bias in population PK parameter estimates (Tables 3 and 4). The median (5th, 95th percentile) piperacillin concentrations in paired plasma and DBS were 107 (15.4, 249) mg/liter and 49.0 (11.9, 103) mg/liter, respectively, and tazobactam concentrations were 12.2 (1.9, 26.4) mg/liter and 5.8 (1.0, 13.3) mg/liter, respectively. A strong correlation between piperacillin (r2 = 0.81; slope = 0.34 [95% confidence interval, 0.19, 0.46]; P < 0.001) and tazobactam (r2 = 0.80; slope = 0.38 [0.22, 0.54]; P < 0.001) DBS and plasma concentrations was observed (Fig. 5). The DBS-versus-plasma drug concentration relationship was maintained throughout the plasma drug concentration range for both piperacillin (r2 = 0.10; slope = −0.048 [−0.002, 0.001]; P = 0.56) and tazobactam (r2 = 0.03; slope = −0.032 [−0.020, 0.013]; P = 0.71), as evidenced by regression slopes not significantly different from zero (Fig. 5).
FIG 5.

Relationship between plasma and dried blood spot piperacillin (A and B) or tazobactam (C and D) concentrations. The dashed line represents the line of unity, and the solid line represents weighted linear regression.
DISCUSSION
This study showed that sparse plasma or plasma plus DBS samples can be used to characterize the PK of piperacillin-tazobactam in infants. On average, piperacillin-tazobactam concentrations in DBS samples were lower (50 to 60%) than those in plasma. This ratio suggests that piperacillin and tazobactam do not partition into red blood cells, and these cells serve as a diluent of whole blood (DBS) concentrations (6). There are no published in vitro data to confirm this inference, and we did not collect paired DBS and hematocrit data to relate the DBS/plasma ratio to the cell count. The difference in plasma and DBS concentrations, however, did not influence the accuracy and precision of population CL and V estimates when DBS concentrations were added to plasma PK analysis. A wide range in the DBS-to-plasma ratio was observed, especially at lower concentrations. It is possible that DBS measurements had measurement errors related to inconsistency in sample collection techniques across sites and use of multiple blood sources (i.e., with and without anticoagulant) before spotting on the card. The presence of EDTA in clinical samples has been shown to produce ion enhancement of certain compounds. While PK parameter estimates were not affected in the current study, DBS sampling at lower concentrations may provide less-reliable estimates and limit the utility of DBS for therapeutic drug monitoring of trough concentrations. However, in the setting of the clinical trial with sampling throughout the dosing interval, the use of DBS samples not only provided a more feasible approach to PK studies in infants but also provided in vivo information on the whole-blood and plasma drug concentration relationship for piperacillin and tazobactam. Assessment of plasma versus DBS differences in drug concentrations in vivo are critical because these can affect dosing recommendations, often targeted to achieve surrogate PD endpoints that are based on plasma (as opposed to whole-blood) drug concentrations. The PK of piperacillin-tazobactam from the current study supports the finding that development has a significant impact on the disposition of these drugs. Piperacillin-tazobactam CL was significantly associated and increased with surrogate covariates of maturation, including body weight, PMA, PNA, and SCR. This finding is consistent with prior investigations of piperacillin-tazobactam PK in infants and was expected given that the kidneys are the primary route of elimination for this drug (7, 19, 25).
In our population, piperacillin-tazobactam CL increased rapidly (on average, by 100%) after the first 2 weeks of life. In spite of this change, the population CL of piperacillin in the present study was ∼60% lower than that reported for older infants (full term, 2 to 5 months of age; 0.198 liter/kg/h) (19), >75% lower than that for children (9 months to 12 years of age, 0.338 liter/h/kg) (26), and ∼60% lower than that for adults (18 to 82 years of age, 0.183 liter/h/kg) (27). In a recent study of piperacillin-tazobactam in infants, including those born prematurely, piperacillin CL estimates were comparable with those in our study (0.092 liter/kg/h versus 0.080 liter/k/h for an infant with 8 days' PNA) (7). Our slightly lower CL may reflect the lower GA at birth in our study population. Overall, differences in piperacillin-tazobactam CL across ages can be attributed to the maturation of renal function during childhood (19). Similarly, population V estimates in our study were not clinically different (within 15%) from reported V estimates for older children (19). This study is limited, however, by confounding variables and a limited number of infants enrolled in the oldest age group.
A PMA-based piperacillin dosing regimen performed well and compared favorably to commonly used dosing references in a sample of the population of interest with true representation of the clinically important covariate distribution. This suggests that piperacillin-tazobactam dosing guidelines for premature infants must consider developmental differences in the drugs' CL similar to what has been successfully achieved using PMA-based dosing for other therapeutics (e.g., metronidazole [9, 28], amikacin [29], vancomycin [30], and acetaminophen [31]). Other piperacillin dosing regimens using an array of body weight and PNA have been recently developed for infants (7); however, these target lower MICs and are challenging to implement clinically. In addition, we did not observe additional therapeutic benefit from prolonging the duration of drug infusion in this population, likely because of the observed slow drug elimination that resulted in therapeutic concentrations for most of the dosing interval. This is in contrast to adult studies that support a prolonged infusion for treatment of highly resistant infections (32–34). This is an important finding because adult dosing recommendations of anti-infectives are often extrapolated to children and infants without data for this unique patient population. Prolonging the drug infusion has important clinical implications in the nursery, when intravascular access is frequently limited and is often required for multiple drugs.
In summary, the population PK of piperacillin-tazobactam in infants in this study showed that DBS can be used to evaluate the PK of piperacillin-tazobactam. A dosing strategy based on PMA (Table 6) accounts for developmental changes in piperacillin-tazobactam disposition, achieves the surrogate therapeutic targets in >90% of infants regardless of the organism MIC, and is clinically applicable. Prolonging the dosing interval to 6 h in infants with a PMA of >35 weeks only reduces the target attainment rate to 80% and is a reasonable dosing strategy for older infants without culture-proven infection. Prolonging the duration of the piperacillin-tazobactam infusion does not improve target attainment rates in infants and therefore is not supported for this population. The proposed dosing regimen also provides drug exposures comparable with those seen for adult patients with highly resistant infections receiving piperacillin-tazobactam (22).
ACKNOWLEDGMENTS
We are indebted to the study coordinators at the sites that agreed to take part in this study.
The project described here was supported by award number 3UL1RR024128-04S5 from the National Center for Research Resources. Research described in this publication was also supported by the National Center for Advancing Translational Sciences of the National Institutes of Health under award number UL1TR001117.
M.C.-W. receives support for research from the National Institutes of Health (NIH) (1K23HD064814), the National Center for Advancing Translational Sciences of the NIH (UL1TR001117), the Food and Drug Administration (1U01FD004858-01), the Biomedical Advanced Research and Development Authority (BARDA) (HHSO100201300009C), the nonprofit organization Thrasher Research Fund (www.thrasherresearch.org), and from industry for drug development in adults and children (www.dcri.duke.edu/research/coi.jsp). K.M.W. receives support from NIGMS (1T32GM086330-01A1) and the Thrasher Research Fund (see above URL) for his work in pediatric clinical pharmacology. E.V.C. receives salary support from the U.S. government (U54 HD071600-01) and research support from Trius, Cerexa Pharmaceuticals, Abbott, and Theravance. D.K.B. receives support from the U.S. government for his work in pediatric and neonatal clinical pharmacology (1R01HD057956-05, 1K24HD058735-05, UL1TR001117, and NICHD contract HHSN275201000003I) and the nonprofit organization Thrasher Research Fund for his work with neonatal candidiasis (see above URL); he also receives research support from industry for neonatal and pediatric drug development (www.dcri.duke.edu/research/coi.jsp). P.B.S. receives salary support for research from the National Institutes of Health (NIH), the U.S. Department of Health and Human Services, and the National Center for Advancing Translational Sciences of the NIH (DHHS-1R18AE000028-01, HHSN267200700051C, HHSN275201000003I, and UL1TR001117); he also receives research support from industry for neonatal and pediatric drug development (www.dcri.duke.edu/research/coi.jsp). The remaining authors have no relevant conflicts to disclose.
The content is solely the responsibility of the authors and does not necessarily represent the official views of the National Center for Research Resources or the National Institutes of Health.
Footnotes
Published ahead of print 10 March 2014
REFERENCES
- 1.Berger A, Kretzer V, Apfalter P, Rohrmeister K, Zaknun D, Pollak A. 2004. Safety evaluation of piperacillin/tazobactam in very low birth weight infants. J. Chemother. 16:166–171. 10.1179/joc.2004.16.2.166 [DOI] [PubMed] [Google Scholar]
- 2.Vohr BR, Wright LL, Dusick AM, Mele L, Verter J, Steichen JJ, Simon NP, Wilson DC, Broyles S, Bauer CR, Delaney-Black V, Yolton KA, Fleisher BE, Papile LA, Kaplan MD. 2000. Neurodevelopmental and functional outcomes of extremely low birth weight infants in the National Institute of Child Health and Human Development Neonatal Research Network, 1993–1994. Pediatrics 105:1216–1226. 10.1542/peds.105.6.1216 [DOI] [PubMed] [Google Scholar]
- 3.Yeh TC, Chang JH, Kao HA, Hsu CH, Hung HY, Peng CC. 2004. Necrotizing enterocolitis in infants: clinical outcome and influence on growth and neurodevelopment. J. Formos. Med. Assoc. 103:761–766 [PubMed] [Google Scholar]
- 4.Thomson Reuters clinical editorial staff. 2011. Neofax 2011, 24th ed. Thomson Reuters, Montvale, NJ [Google Scholar]
- 5.Tschudy M, Arcara K. 2011. The Harriet Lane handbook: a manual for pediatric house officers, 19th ed, p 1035 Mosby, Philadelphia, PA [Google Scholar]
- 6.Sorgel F, Kinzig M. 1993. The chemistry, pharmacokinetics and tissue distribution of piperacillin/tazobactam. J. Antimicrob. Chemother. 31(Suppl A):39–60. 10.1093/jac/31.suppl_A.39 [DOI] [PubMed] [Google Scholar]
- 7.Li Z, Chen Y, Li Q, Cao D, Shi W, Cao Y, Wu D, Zhu Y, Wang Y, Chen C. 2013. Population pharmacokinetics of piperacillin/tazobactam in neonates and young infants. Eur. J. Clin. Pharmacol. 69:1223–1233. 10.1007/s00228-012-1413-4 [DOI] [PubMed] [Google Scholar]
- 8.Suyagh MF, Iheagwaram G, Kole PL, Millership J, Collier P, Halliday H, McElnay JC. 2010. Development and validation of a dried blood spot-HPLC assay for the determination of metronidazole in neonatal whole blood samples. Anal. Bioanal. Chem. 397:687–693. 10.1007/s00216-010-3571-5 [DOI] [PubMed] [Google Scholar]
- 9.Cohen-Wolkowiez M, Sampson M, Bloom BT, Arrieta A, Wynn JL, Martz K, Harper B, Kearns GL, Capparelli EV, Siegel D, Benjamin DK, Jr, Smith PB; on behalf of the Best Pharmaceuticals for Children Act—Pediatric Trials Network. 2013. Determining population and developmental pharmacokinetics of metronidazole using plasma and dried blood spot samples from premature infants. Pediatr. Infect. Dis. J. 32:956–961. 10.1097/INF.0b013e3182947cf8 [DOI] [PMC free article] [PubMed] [Google Scholar]
- 10.Cohen-Wolkowiez M, White NR, Bridges A, Benjamin DK, Jr, Kashuba AD. 2011. Development of a liquid chromatography-tandem mass spectrometry assay of six antimicrobials in plasma for pharmacokinetic studies in premature infants. J. Chromatogr. B Analyt. Technol. Biomed. Life Sci. 879:3497–3506. 10.1016/j.jchromb.2011.09.031 [DOI] [PMC free article] [PubMed] [Google Scholar]
- 11.Smith PB, Cohen-Wolkowiez M, Castro LM, Poindexter B, Bidegain M, Weitkamp JH, Schelonka RL, Ward RM, Wade K, Valencia G, Burchfield D, Arrieta A, Bhatt-Mehta V, Walsh M, Kantak A, Rasmussen M, Sullivan JE, Finer N, Brozanski BS, Sanchez P, van den Anker J, Blumer J, Kearns GL, Capparelli EV, Anand R, Benjamin DK, Jr; Meropenem Study Team. 2011. Population pharmacokinetics of meropenem in plasma and cerebrospinal fluid of infants with suspected or complicated intra-abdominal infections. Pediatr. Infect. Dis. J. 30:844–849. 10.1097/INF.0b013e31822e8b0b [DOI] [PMC free article] [PubMed] [Google Scholar]
- 12.Frei CR, Wiederhold NP, Burgess DS. 2008. Antimicrobial breakpoints for gram-negative aerobic bacteria based on pharmacokinetic-pharmacodynamic models with Monte Carlo simulation. J. Antimicrob. Chemother. 61:621–628. 10.1093/jac/dkm536 [DOI] [PMC free article] [PubMed] [Google Scholar]
- 13.Lodise TP, Lomaestro BM, Drusano GL. 2006. Application of antimicrobial pharmacodynamic concepts into clinical practice: focus on beta-lactam antibiotics: insights from the Society of Infectious Diseases Pharmacists. Pharmacotherapy 26:1320–1332. 10.1592/phco.26.9.1320 [DOI] [PubMed] [Google Scholar]
- 14.Vogelman B, Gudmundsson S, Leggett J, Turnidge J, Ebert S, Craig WA. 1988. Correlation of antimicrobial pharmacokinetic parameters with therapeutic efficacy in an animal model. J. Infect. Dis. 158:831–847. 10.1093/infdis/158.4.831 [DOI] [PubMed] [Google Scholar]
- 15.Leggett JE, Fantin B, Ebert S, Totsuka K, Vogelman B, Calame W, Mattie H, Craig WA. 1989. Comparative antibiotic dose-effect relations at several dosing intervals in murine pneumonitis and thigh-infection models. J. Infect. Dis. 159:281–292. 10.1093/infdis/159.2.281 [DOI] [PubMed] [Google Scholar]
- 16.Joly-Guillou ML, Kempf M, Cavallo JD, Chomarat M, Dubreuil L, Maugein J, Muller-Serieys C, Roussel-Delvallez M. 2010. Comparative in vitro activity of meropenem, imipenem and piperacillin/tazobactam against 1071 clinical isolates using 2 different methods: a French multicentre study. BMC Infect. Dis. 10:72. 10.1186/1471-2334-10-72 [DOI] [PMC free article] [PubMed] [Google Scholar]
- 17.EUCAST. 2011. Clinical breakpoints. EUCAST. http://www.eucast.org/clinical_breakpoints/ Accessed 26 July 2013
- 18.Tamma PD, Turnbull AE, Milstone AM, Hsu AJ, Carroll KC, Cosgrove SE. 2012. Does the piperacillin minimum inhibitory concentration for Pseudomonas aeruginosa influence clinical outcomes of children with pseudomonal bacteremia? Clin. Infect. Dis. 55:799–806. 10.1093/cid/cis545 [DOI] [PMC free article] [PubMed] [Google Scholar]
- 19.Reed MD, Goldfarb J, Yamashita TS, Lemon E, Blumer JL. 1994. Single-dose pharmacokinetics of piperacillin and tazobactam in infants and children. Antimicrob. Agents Chemother. 38:2817–2826. 10.1128/AAC.38.12.2817 [DOI] [PMC free article] [PubMed] [Google Scholar]
- 20.Pea F, Viale P, Cojutti P, Furlanut M. 2012. Dosing nomograms for attaining optimum concentrations of meropenem by continuous infusion in critically ill patients for severe Gram-negative infections: a pharmacokinetics/pharmacodynamics-based approach. Antimicrob. Agents Chemother. 56:6343–6348. 10.1128/AAC.01291-12 [DOI] [PMC free article] [PubMed] [Google Scholar]
- 21.Hornik CP, Benjamin DK, Becker KC, Benjamin DK, Jr, Li J, Clark RH, Cohen-Wolkowiez M, Smith PB. 2012. Use of the complete blood cell count in early-onset neonatal sepsis. Pediatr. Infect. Dis. J. 31:799–802. 10.1097/INF.0b013e318256905c [DOI] [PMC free article] [PubMed] [Google Scholar]
- 22.Shea KM, Cheatham SC, Wack MF, Smith DW, Sowinski KM, Kays MB. 2009. Steady-state pharmacokinetics and pharmacodynamics of piperacillin/tazobactam administered by prolonged infusion in hospitalised patients. Int. J. Antimicrob. Agents. 34:429–433. 10.1016/j.ijantimicag.2009.07.004 [DOI] [PubMed] [Google Scholar]
- 23.Guignard JP, Drukker A. 1999. Why do newborn infants have a high plasma creatinine? Pediatrics 103:e49. 10.1542/peds.103.4.e49 [DOI] [PubMed] [Google Scholar]
- 24.Miall LS, Henderson MJ, Turner AJ, Brownlee KG, Brocklebank JT, Newell SJ, Allgar VL. 1999. Plasma creatinine rises dramatically in the first 48 hours of life in preterm infants. Pediatrics 104:e76. 10.1542/peds.104.6.e76 [DOI] [PubMed] [Google Scholar]
- 25.Kacet N, Roussel-Delvallez M, Gremillet C, Dubos JP, Storme L, Lequien P. 1992. Pharmacokinetic study of piperacillin in newborns relating to gestational and postnatal age. Pediatr. Infect. Dis. J. 11:365–369. 10.1097/00006454-199205000-00005 [DOI] [PubMed] [Google Scholar]
- 26.AuroMedics Pharma LLC. 2012. Piperacillin and tazobactam (piperacillin sodium and tazobactam sodium) injection, powder, for solution. National Library of Medicine, Bethesda, MD: http://dailymed.nlm.nih.gov/dailymed/lookup.cfm?setid=39e19789-de4b-4fd1-ab1c-92f59496f496 Accessed 26 July 2013 [Google Scholar]
- 27.Li C, Kuti JL, Nightingale CH, Mansfield DL, Dana A, Nicolau DP. 2005. Population pharmacokinetics and pharmacodynamics of piperacillin/tazobactam in patients with complicated intra-abdominal infection. J. Antimicrob. Chemother. 56:388–395. 10.1093/jac/dki243 [DOI] [PubMed] [Google Scholar]
- 28.Cohen-Wolkowiez M, Ouellet D, Smith PB, James LP, Ross A, Sullivan JE, Walsh MC, Zadell A, Newman N, White NR, Kashuba AD, Benjamin DK., Jr 2012. Population pharmacokinetics of metronidazole evaluated using scavenged samples from preterm infants. Antimicrob. Agents Chemother. 56:1828–1837. 10.1128/AAC.06071-11 [DOI] [PMC free article] [PubMed] [Google Scholar]
- 29.Sherwin CM, Broadbent RS, Medlicott NJ, Reith DM. 2009. Individualised dosing of amikacin in neonates. Eur. J. Clin. Pharmacol. 65:1267–1268. 10.1007/s00228-009-0691-y [DOI] [PubMed] [Google Scholar]
- 30.Marques-Minana MR, Saadeddin A, Peris JE. 2010. Population pharmacokinetic analysis of vancomycin in neonates. A new proposal of initial dosage guideline. Br. J. Clin. Pharmacol. 70:713–720. 10.1111/j.1365-2125.2010.03736.x [DOI] [PMC free article] [PubMed] [Google Scholar]
- 31.Palmer GM, Atkins M, Anderson BJ, Smith KR, Culnane TJ, McNally CM, Perkins EJ, Chalkiadis GA, Hunt RW. 2008. I.V. acetaminophen pharmacokinetics in neonates after multiple doses. Br. J. Anaesth. 101:523–530. 10.1093/bja/aen208 [DOI] [PubMed] [Google Scholar]
- 32.Felton TW, Hope WW, Lomaestro BM, Butterfield JM, Kwa AL, Drusano GL, Lodise TP. 2012. Population pharmacokinetics of extended-infusion piperacillin-tazobactam in hospitalized patients with nosocomial infections. Antimicrob. Agents Chemother. 56:4087–4094. 10.1128/AAC.00521-12 [DOI] [PMC free article] [PubMed] [Google Scholar]
- 33.Roberts JA, Kirkpatrick CM, Roberts MS, Dalley AJ, Lipman J. 2010. First-dose and steady-state population pharmacokinetics and pharmacodynamics of piperacillin by continuous or intermittent dosing in critically ill patients with sepsis. Int. J. Antimicrob. Agents. 35:156–163. 10.1016/j.ijantimicag.2009.10.008 [DOI] [PubMed] [Google Scholar]
- 34.Shea KM, Cheatham SC, Smith DW, Wack MF, Sowinski KM, Kays MB. 2009. Comparative pharmacodynamics of intermittent and prolonged infusions of piperacillin/tazobactam using Monte Carlo simulations and steady-state pharmacokinetic data from hospitalized patients. Ann. Pharmacother. 43:1747–1754. 10.1345/aph.1M304 [DOI] [PubMed] [Google Scholar]