Abstract
In this study, we performed in vitro and in vivo activity assays of polyhydroxyalkanoate (PHA) synthases (PhaCs) in the presence of phasin proteins (PhaPs), which revealed that PhaPs are activators of PhaC derived from Aeromonas caviae (PhaCAc). In in vitro assays, among the three PhaCs tested, PhaCAc was significantly activated when PhaPs were added at the beginning of polymerization (prepolymerization PhaCAc), whereas the prepolymerization PhaCRe (derived from Ralstonia eutropha) and PhaCDa (Delftia acidovorans) showed reduced activity with PhaPs. The PhaP-activated PhaCAc showed a slight shift of substrate preference toward 3-hydroxyhexanoyl-CoA (C6). PhaPAc also activated PhaCAc when it was added during polymerization (polymer-elongating PhaCAc), while this effect was not observed for PhaCRe. In an in vivo assay using Escherichia coli TOP10 as the host strain, the effect of PhaPAc expression on PHA synthesis by PhaCAc or PhaCRe was examined. As PhaPAc expression increased, PHA production was increased by up to 2.3-fold in the PhaCAc-expressing strain, whereas it was slightly increased in the PhaCRe-expressing strain. Taken together, this study provides evidence that PhaPs function as activators for PhaCAc both in vitro and in vivo but do not activate PhaCRe. This activating effect may be attributed to the new role of PhaPs in the polymerization reaction by PhaCAc.
INTRODUCTION
Polyhydroxyalkanoates (PHAs) are aliphatic polyesters that are synthesized and accumulated by a wide range of microorganisms as their carbon- and energy-storage materials (1, 2). PHAs have attracted attention as biodegradable thermoplastics for industrial applications. A key enzyme in PHA biosynthesis is PHA synthase (PhaC), which is classified into four groups (classes I to IV) based on substrate specificity and subunit composition (see the review by Rehm [1] for a detailed classification of PHA synthases).
Class I PhaCs are homomeric enzymes comprised of PhaC subunits with molecular mass of 60 to 70 kDa; these enzymes prefer to polymerize monomers with a short acyl chain length (C3 to C5). As a typical class I enzyme, Ralstonia eutropha PHA synthase (PhaCRe) has been well studied and characterized. Delftia acidovorans synthase (PhaCDa) is also a class I synthase but has a unique insertion sequence of 40 amino acids located at the C terminus of the active center cysteine at position 322 (3). PhaC derived from Aeromonas caviae (PhaCAc) is not a typical class I enzyme because it is able to polymerize not only the C4 and C5 substrates but also C6 substrates. PhaCAc shows a relatively low amino acid sequence identity to PhaCRe (37.4%) and PhaCDa (31.1%), whereas PhaCRe and PhaCDa are relatively similar (50.7%).
A number of enzymes and nonenzymatic proteins are involved in PHA biosynthesis. Phasin proteins (PhaPs), which are PHA granule-associated proteins localized on the surfaces of the PHA granules in bacterial cells (4, 5), are well known PHA synthesis-related proteins. The primary function of PhaPs is control of the surface properties of PHA granules. PhaPs bind strongly to the hydrophobic surfaces of growing PHA granules to block the binding of other proteins. Accordingly, PhaP expression levels in bacterial cells affect the hydrophobicity of the surface of PHA granules, thereby influencing granule development via hydrophobic aggregation of small granules (4, 6).
Most phasins, including R. eutropha phasin (PhaP1Re), have a molecular mass of approximately 20 kDa (5). The A. caviae phasin (PhaPAc) is a small protein having a molecular mass of 13 kDa and low identity to PhaP1Re (13.1%) (7). Several interesting observations suggested a second function of PhaPAc. These observations include PhaPAc expression leading to enhanced accumulation of PHA and/or altering the copolymer composition, likely by influencing the activity and substrate specificity of PhaCAc (8, 9). The same phenomenon was observed in recombinant bacteria between the PhaC and PhaP derived from Aeromonas hydrophila (10). However, these in vivo studies have not focused on the role of PhaP at the molecular level.
The aim of our study was to investigate the role of PhaP in the modulation of PhaC activity. For this purpose, we used purified proteins to assess the in vitro activity of PhaCs derived from A. caviae, R. eutropha, and D. acidovorans in the presence of PhaPs derived from A. caviae and R. eutropha. In vivo PHA production was also conducted using PhaCs from A. caviae and R. eutropha with or without the expression of PhaPAc. Based on the in vivo and in vitro results, we propose a new physiological role of PhaPs in the polymerization reaction catalyzed by PhaCAc.
MATERIALS AND METHODS
Plasmid construction.
Plasmids to express His-tagged PhaCAc, PhaPAc, and PhaP1Re were constructed based on the pColdI vector (TaKaRa Bio, Inc., Otsu, Japan) to obtain purified proteins. For construction of pColdI::phaCAc and pColdI::phaPAc, phaCAc and phaPAc genes were obtained by PCR with pBBR1phaPCJAcABRe (11) as the template. The following PCR primers were used: forward for phaCAc, 5′-GGGTGAAGGAGAGCATATGAGCCAACCATCTTATGG-3′, reverse for phaCAc, 5′-GACCACGGATCCTGCGCTCA-3′, forward for phaPAc 5′-TGGAGACCGCATATGAATATGGACGTGATC-3′, and reverse for phaPAc, 5′-CAGGGATCCTCAGGCCTTGCCCGTGCTTTT-3′ (underlined sequences indicate the NdeI and BamHI sites, respectively). These gene fragments were digested by NdeI and BamHI and were introduced into the same sites of the pColdI vector. For pColdI::phaP1Re, genomic DNA of R. eutropha H16 was used as the template. The following PCR primers were used: forward, 5′-ACTGGAGACCACATATGATCCTCACCCCGG-3′, and reverse, 5′-GGATCCTCAGGCAGCCGTCGTCTTCTTTGC-3′ (underlined sequences indicate the NdeI and BamHI sites, respectively). The amplified DNA fragment carrying the phaP1Re gene was digested by NdeI and BamHI and was introduced into the same sites of the pColdI vector. Three plasmids, named pBAD::TEE+phaPAc, pBBR1::phaCAcABRe, and pBBR1::phaCABRe, were newly constructed for in vivo PHA production experiments. Maps of the plasmids used for in vivo experiments are shown in Fig. 1. In the construction of pBAD::TEE+phaPAc, the phaPAc gene fragment, which includes the Shine-Dalgarno sequence, translation-enhancing element (TEE) sequence, and His tag sequence of pColdI::phaPAc, was amplified by PCR using pColdI::phaPAc as the template. The following PCR primers were used: forward, 5′-TTAGAGCTCAAGAGGTAATACACCATGAAT-3′, and reverse, 5′-TTCGGTACCTCAGGCCTTGCCCGTGCTTTT-3′ (underlined sequences indicate the SacI and KpnI sites, respectively). For pBBR1::phaCAcABRe and pBBR1::phaCABRe, the BamHI-digested fragments from pGEM′-phbCABRe (12) and pGEM-phaCAcAB (13), respectively, were ligated with BamHI-digested pBBR1-MCS2 (14). These PHA biosynthesis genes were located downstream from the promoter of the PHA biosynthesis operon (phaCABRe) from R. eutropha, and they were directionally opposite from the lac promoter present in pBBR1-MCS2.
FIG 1.
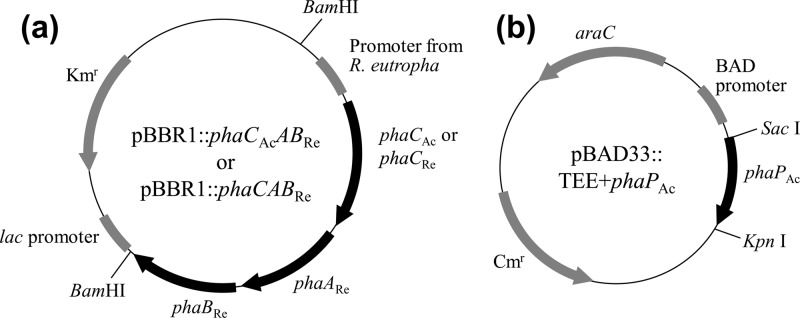
Map of plasmids used for in vivo experiments. (a) pBBR1-MCS2-derived plasmid for PHA biosynthesis. (b) pBAD33-derived plasmid for PhaPAc expression.
Preparation of PhaCs and PhaPs.
PhaCAc with the His tag removed was prepared by using cell-free protein enzymes as reported previously (15). PhaCAc was eluted with 20 mM Tris-HCl buffer (pH 7.5) containing 150 mM NaCl. His-tagged PhaCRe and PhaCDa were expressed in the recombinant Escherichia coli BL21(DE3) strain (Novagen, Madison, WI) with the pET-15b::phaCRe and pET-15b::phaCDa vectors, respectively (16, 17). PhaCRe and PhaCDa were purified from the cells using a HisTrap HP column (GE Healthcare), followed by desalting using a HiTrap desalting column with desalting buffer [20 mM Tris-HCl, 150 mM NaCl, 5% (vol) glycerol, and 0.05% (wt) 6-O-(N-heptylcarbamoyl)methyl α-d-glucopyranoside (Hecameg), pH 7.5]. All processes were conducted at 4°C. Aliquots of purified PhaCs were frozen in liquid nitrogen and stored at −80°C.
His-tagged PhaCAc, PhaPAc, and PhaP1Re were expressed in the recombinant E. coli BL21(DE3) strain with pColdI::phaCAc, pColdI::phaPAc, and pColdI::phaP1Re vectors, respectively. All strains were grown in Luria-Bertani (LB) broth (1% Bacto-tryptone, 0.5% yeast extract, and 1% NaCl, pH 7.0) with 100 μg/ml ampicillin. These expression strains were grown at 37°C to an optical density at 600 nm (OD600) of ≈0.6 with shaking. The cells were incubated at 16°C for 30 min without shaking, and 0.1 mM isopropyl-β-d-thiogalactopyranoside (IPTG) was added. After the addition of IPTG, the cells were cultivated at 16°C for 24 h with shaking. Proteins were purified using a HisTrap HP column (GE Healthcare). Finally, purified PhaCAc was desalted using desalting buffer, as described for PhaCRe and PhaCDa; PhaPs were desalted using ultrapure water. These purified and desalted proteins were frozen in liquid nitrogen and stored at −80°C. All proteins were purified to near homogeneity (see Fig. S1 in the supplemental material). Protein concentrations were determined using a Quant-iT protein assay kit (Invitrogen, Carlsbad, CA).
Monomer preparation.
To assay PhaC activity, (R)-3-hydroxybutyryl-coenzyme A (R-3HB-CoA) and (R)-3-hydroxyhexanoyl-CoA (R-3HHx-CoA) were prepared as substrates. R-3HB-CoA was chemically synthesized and purified as previously described (18). R-3HHx-CoA was synthesized from hexenoyl-CoA using A. caviae (R)-specific enoyl-CoA hydratase as previously reported (19) and purified using high-performance liquid chromatography (HPLC) in the same manner as for R-3HB-CoA. Substrate concentrations were quantified relative to an HPLC standard curve of racemic 3HB-CoA (Sigma; St. Louis, MO).
Activity assay of PhaCs in the presence of PhaPs.
For the PhaC activity assay, a decrease in the absorbance at 236 nm, which occurs due to the cleavage of the thioester bond in R-3HB-CoA (ε236 = 4,500 [M−1 · cm−1]), was measured (20). The assay was carried out for the three PhaCs in the presence or absence of the PhaPs at 30°C in 50 mM sodium phosphate buffer (pH 7.0) with R-3HB-CoA or R-3HHx-CoA. Detailed assay conditions are described below. Specific activities were determined using the maximum velocities of each reaction.
PHA biosynthesis in vivo.
For poly[(R)-3-hydroxybutylate] [P(3HB)] synthesis, E. coli TOP10 cells (Invitrogen, Carlsbad, CA) harboring a pBBR1-MCS2-derived plasmid (pBBR1::phaCAcABRe or pBBR1::phaCABRe) and pBAD::TEE+phaPAc (or the pBAD33 empty vector as a control) were cultivated as described below. These strains were inoculated into LB medium (containing 50 μg/ml kanamycin and 30 μg/ml chloramphenicol) in test tubes and cultured at 37°C for 15 h. These cultures (1 ml) were inoculated into 500-ml shake flasks containing 100 ml LB medium, 50 μg/ml kanamycin, 30 μg/ml chloramphenicol, 20 g/liter d-glucose, and 0 to 1% (wt/vol) l-arabinose. These flasks were cultivated at 37°C for 72 h using a reciprocal shaker (130 strokes/min). After cultivation, cells were centrifuged, washed with pure water, and lyophilized.
Analyses of PHA produced in vivo.
The PHA content in the cells was determined by gas chromatography (GC) after methanolysis in the presence of 15% (vol/vol) sulfuric acid, as described previously (21). Synthesized PHA was extracted from cells by stirring with chloroform for 72 h at room temperature, followed by filtration of cell debris. The extracted PHA solutions were precipitated into methanol.
The molecular weights and their distribution were determined by gel permeation chromatography (GPC) at 40°C using a Shimadzu 10A GPC system equipped with a 10A refractive index detector with two Shodex K-806 M joint columns. Chloroform was used as the eluent, with a flow rate of 0.8 ml/min; the sample concentrations were 1.0 mg/ml. Low polydispersity polystyrenes were used as the molecular-weight standard. All PHA samples for molecular-weight measurements were obtained from cultivations with 1.0% (wt/vol) l-arabinose.
Western blotting of PhaCs.
The amounts of PhaCAc and PhaCRe in cells were analyzed by Western blotting as described previously (17). Briefly, E. coli cells were cultivated in the LB-plus-glucose medium described above (containing 1.0% [wt/vol] l-arabinose), and the cells were harvested after 6 h of cultivation and disrupted by sonication. The disrupted cells were centrifuged at low speed (1,500 × g for 5 min at 4°C) to separate the soluble cell extract containing PHA granules and an insoluble precipitate. The protein concentrations in the soluble/insoluble fractions were determined using the Quant-iT protein assay kit (Invitrogen). Sodium dodecyl sulfate-polyacrylamide gel electrophoresis (SDS-PAGE) was performed using 8 μg of protein in each soluble/insoluble sample. The detection of PhaCAc and PhaCRe was carried out with specific rabbit antisera to PhaCAc (22) and PhaCRe (23), respectively. Protein bands were visualized using goat anti-rabbit antibodies conjugated with horseradish peroxidase (HRP) (Santa Cruz Biotechnology, CA, USA) as a secondary antibody and an ECL (enhanced chemiluminescence) plus Western blotting detection reagent (GE Healthcare).
RESULTS
Activity assay of PhaCs in the presence of PhaPs in vitro.
In vitro polymerization activity assays using purified PhaCs and PhaPs were conducted. The results of the activity assay are shown in Table 1. In the PhaP-free assay, PhaCAc without a His tag showed the lowest activity (0.76 U/mg PhaC) toward R-3HB-CoA among the PhaCs examined, while PhaCRe showed the highest activity (3.51 U/mg PhaC). Interestingly, the addition of 1 μM PhaPAc into the reaction mixture exhibited two different effects on PhaC activity; the activity of PhaCAc increased to 2.31 U/mg PhaC in the presence of PhaPAc, which was 3.0-fold higher than that in the PhaP-free assay. In contrast, the addition of 1 μM PhaPAc decreased the activities of PhaCRe and PhaCDa by approximately 10-fold; the calculated activities of PhaCRe and PhaCDa were 0.36 U/mg PhaC and 0.15 U/mg PhaC, respectively, in the presence of PhaPAc.
TABLE 1.
PhaC activity assay toward R-3HB-CoA in the presence of PhaPa
| Assay conditions | Sp act (mean U/mg PhaC ± SE) (fold activation by PhaP) of: |
|||
|---|---|---|---|---|
| PhaCAc |
PhaCRe | PhaCDa | ||
| Without His tag | With His tag | |||
| PhaP free | 0.76 ± 0.08 (1.0) | 0.72 ± 0.03 (1.0) | 3.51 ± 0.21 (1.0) | 1.40 ± 0.14 (1.0) |
| +PhaPAc | 2.31 ± 0.07 (3.0) | 2.24 ± 0.11 (3.1) | 0.36 ± 0.07 (0.1) | 0.15 ± 0.03 (0.1) |
| +PhaP1Re | 1.82 ± 0.10 (2.4) | 1.76 ± 0.03 (2.4) | 0.39 ± 0.02 (0.1) | 0.64 ± 0.06 (0.5) |
Assay conditions: PhaCs, 350 nM (PhaCAc with/without His tag) or 200 nM (PhaCRe and PhaCDa with a His tag); R-3HB-CoA, 100 μM; PhaP, 0 or 1 μM. n = 3 replicates.
Furthermore, a similar effect was observed by adding another phasin, PhaP1Re. In the presence of 1 μM PhaP1Re, PhaCAc activity increased to 1.82 U/mg PhaC, whereas PhaCRe and PhaCDa activities decreased to 0.39 U/mg PhaC and 0.64 U/mg PhaC, respectively. These results suggest that PhaPs function as modulators of PhaC activity but that the modulatory action (activating or inhibiting) is PhaC dependent. Namely, PhaPs enhance the activity of PhaCAc but inhibit the activity of PhaCRe and PhaCDa. This trend was also observed in the parallel assay using His-tagged PhaCAc purified from E. coli BL21(DE3) cells harboring pColdI::phaCAc (Table 1).
Effect of PhaP concentration on PhaCAc activation in vitro.
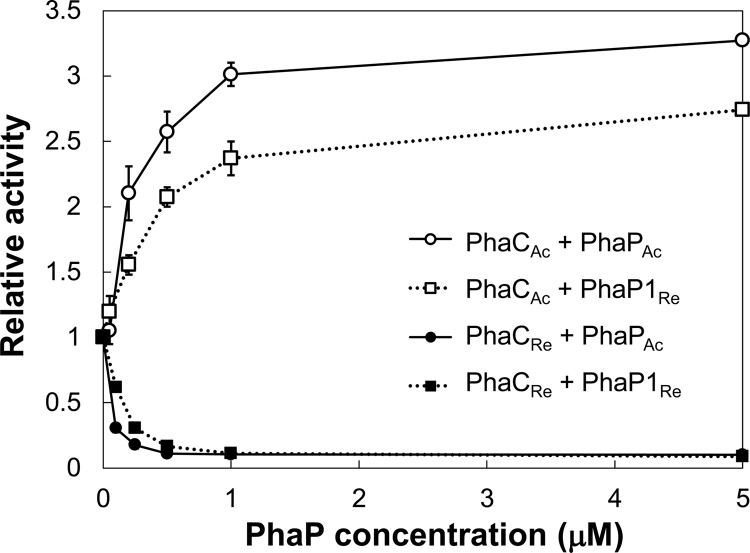
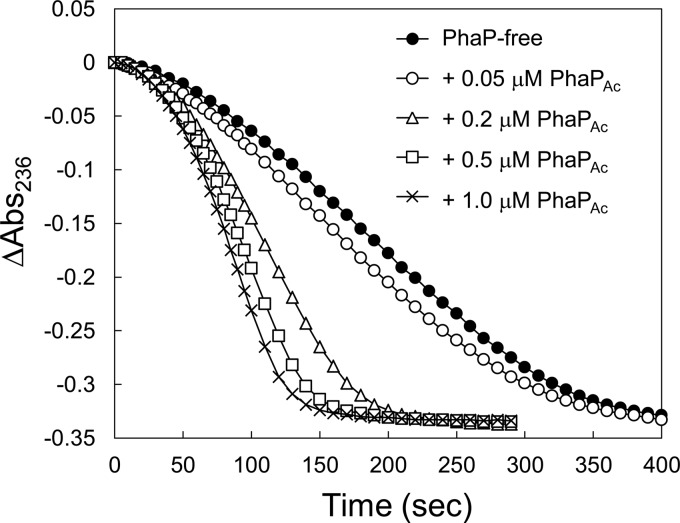
We assayed the activity of PhaCAc relative to its activity under the PhaP-free condition by varying the concentrations of PhaPs added into the reaction mixture (Fig. 2; reaction progress curves are shown in Fig. 3). PhaCAc activity increased 3.0-fold with increasing PhaPAc concentration up to 1 μM; a further increase in the activity of PhaCAc was not observed with the addition of 5 μM PhaPAc. These data suggest that the activating effect of PhaPAc reached a plateau around a concentration of 1 μM, where the molar ratio of PhaPAc to PhaCAc was 2.9 (mol/mol).
FIG 2.
Relative activities of PhaCAc and PhaCRe for the R-3HB-CoA substrate at different concentrations of PhaPAc and PhaP1Re. Relative activities were determined using the change in absorbance at 236 nm at maximum velocity. Reaction mixtures containing PhaC (350 nM PhaCAc without a His tag or 200 nM PhaCRe), 100 μM R-3HB-CoA, and 0 to 5 μM PhaP (PhaPAc or PhaR1Re) were used. Results are expressed as the means ± standard errors (n = 3), except for results with 5 μM PhaP (n = 2).
FIG 3.
Effects of PhaPAc on the PhaCAc reaction rate for the R-3HB-CoA substrate. The assay was carried out by monitoring the changes in absorbance at 236 nm of reaction mixtures containing 100 μM R-3HB-CoA, 350 nM PhaCAc without a His tag, and the indicated concentrations of PhaPAc.
The effect of another phasin, PhaP1Re, on the activity of PhaCAc was also investigated (Fig. 2). PhaP1Re increased PhaCAc activity up to 2.7-fold compared to its activity in the absence of PhaP; however, the activating effect was slightly lower than that of PhaPAc. The enhancing effect reached a plateau at around 1 μM PhaP1Re (the molar ratio of PhaP1Re to PhaCAc was 2.9 [mol/mol]), which is identical to that of PhaPAc, regardless of the molecular mass of the PhaP. At the initial stage of polymerization, the maximum polymerization activity may be achieved at a PhaP/PhaCAc molar ratio of 3:1.
Reactivity of activated PhaCAc toward 3HHx in vitro.
PhaCAc that was activated by 2.5 μM PhaPAc was spectrophotometrically assayed using R-3HHx-CoA (C6 substrate) and R-3HB-CoA (C4 substrate). Table 2 shows the specific activities of PhaCAc with a high concentration (150 μM) of C4 and C6 substrates, which clearly show a weak activity toward the C6 substrate. The activities for the C4 and C6 substrates were increased by the addition of 2.5 μM PhaPAc. The specific activities of the C6 substrate in the presence and absence of PhaPAc were 0.69 U/mg PhaC and 0.16 U/mg PhaC, respectively. This activation fold increase was calculated to be 4.3, which was higher than that of the C4 substrate (2.5-fold), and it resulted in a higher C6/C4 activity ratio. These data indicate that PhaPAc increased the specificity of PhaCAc against the C6 substrate compared to its activity against the C4 substrate.
TABLE 2.
PhaCAc activity toward C4 and C6 substrates in vitroa
| Assay conditions | Sp act (mean U/mg PhaCAc ± SE) (fold activation by PhaP) with: |
C6/C4 activity ratio | |
|---|---|---|---|
| R-3HB-CoA (C4) | R-3HHx-CoA (C6) | ||
| PhaCAc | 1.27 ± 0.03 (1.0) | 0.16 ± 0.01 (1.0) | 0.13 |
| PhaCAc + PhaPAc | 3.15 ± 0.13 (2.5) | 0.69 ± 0.03 (4.3) | 0.22 |
Assay conditions: PhaCAc without a His tag, 700 nM; substrate (R-3HB-CoA or R-3HHx-CoA), 150 μM; PhaPAc, 0 or 2.5 μM. n = 3 replicates.
Effect of PhaP concentration on PhaCRe inhibition in vitro.
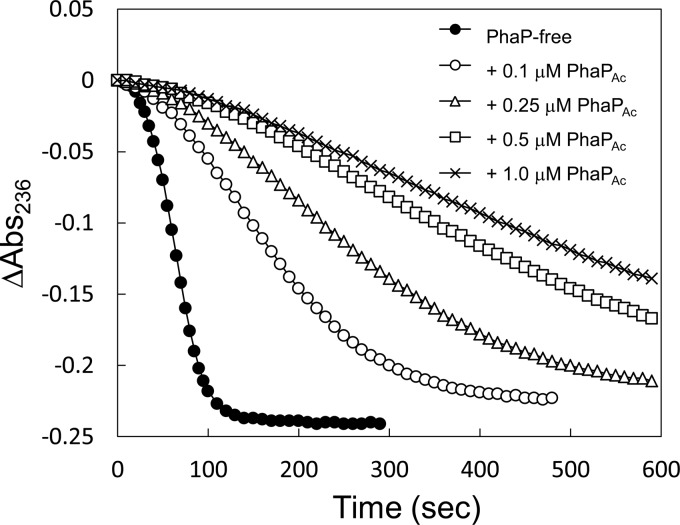
The activities of PhaCRe and PhaCDa were inhibited by 1 μM PhaP (Table 1), which was in contrast to the activation observed for PhaCAc. To investigate the effect of PhaP concentration, activity assays of PhaCRe with various PhaP concentrations were conducted (Fig. 2; the reaction progress curves are shown in Fig. 4). The inhibitory effect on PhaCRe activity was dependent on the concentration of the PhaPs, and it reached a plateau at around 0.5 μM PhaP. PhaPAc showed a slightly stronger inhibitory effect than PhaP1Re (Table 1 and Fig. 2).
FIG 4.
Effects of PhaPAc on the PhaCRe reaction rate for the R-3HB-CoA substrate. The assay was carried out by monitoring the changes in absorbance at 236 nm of reaction mixtures containing 100 μM R-3HB-CoA, 200 nM PhaCRe, and the indicated concentrations of PhaPAc.
Effect of PhaP on the activity of polymer-elongating PhaC in vitro.
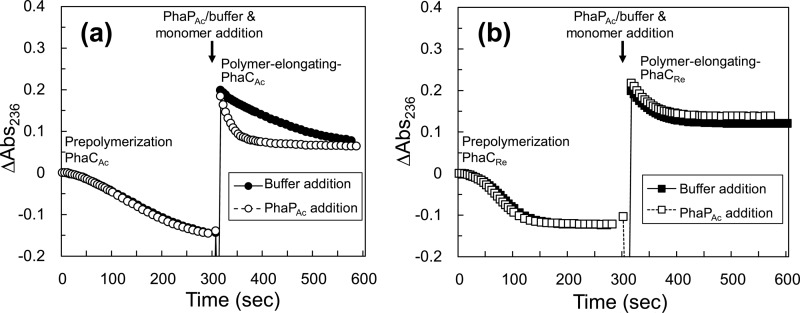
We conducted activity assays of polymer-elongating PhaCs in the presence or absence of PhaPAc. In this assay, the polymerization reaction by PhaCAc (350 nM) or PhaCRe (200 nM) was started with 50 μM R-3HB-CoA. After 300 s of incubation with almost no change in absorbance at 236 nm, 1 μM PhaPAc was added to the reaction mixture, followed by an additional 50 μM R-3HB-CoA. The progress curves of this assay using PhaCAc and PhaCRe are shown in Fig. 5. An activation effect of PhaPAc on the polymer-elongating PhaCAc was observed, similar to the prepolymerization PhaCAc (Table 1 and Fig. 2). On the other hand, polymer-elongating PhaCRe was not affected by the presence of PhaPAc (Fig. 5b), unlike the prepolymerization PhaCRe, which was inhibited by PhaPAc (Fig. 2). The relative activities (U/mg PhaC) of polymer-elongating PhaCs were as follows: PhaCAc alone, 0.66 ± 0.03 (mean ± standard deviation); PhaCAc plus PhaPAc, 2.07 ± 0.11; PhaCRe alone, 1.74 ± 0.12; PhaCRe plus PhaPAc, 1.65 ± 0.12.
FIG 5.
Reaction progress curves obtained with 350 nM PhaCAc with a His tag (a) and 200 nM PhaCRe (b) during two-step addition of R-3HB-CoA. Reactions were initiated with 50 μM R-3HB-CoA, followed by the addition of PhaPAc (1 μM in final concentration) or buffer (control) and 50 μM R-3HB-CoA with a 300-s incubation.
Effect of PhaP on PHA production in vivo.
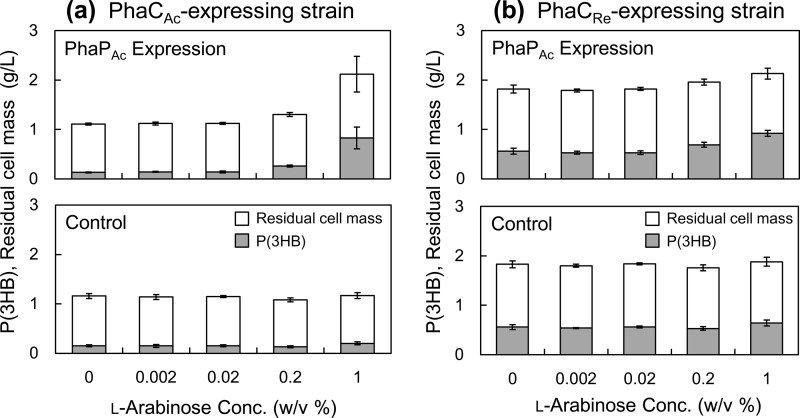
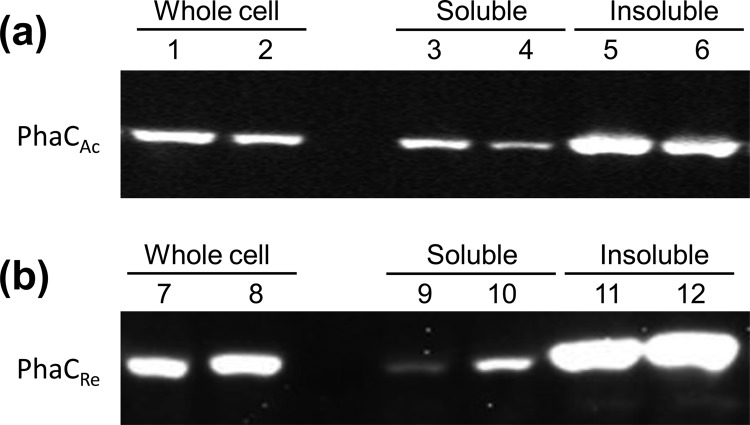
To evaluate the effect of PhaP on PHA production in vivo, E. coli TOP10 cells harboring P(3HB) biosynthesis genes (phaCAc/phaCRe, phaARe, and phaBRe) under phaRe promoter control and the phaPAc gene under l-arabinose-inducible promoter control were cultured in LB medium containing 20 g/liter glucose (Fig. 6). The P(3HB) content was increased at high concentrations of l-arabinose (0.2% or 1.0% [wt/vol]) in both PhaCAc- and PhaCRe-expressing strains. The maximum P(3HB) content was 2.3-fold (PhaCAc) or 1.2-fold (PhaCRe) higher than the levels without PhaPAc expression. The molecular weights of P(3HB) extracted from 1.0% l-arabinose culture are listed in Table 3. These molecular weights were reduced in both strains by the expression of PhaPAc. In particular, the PhaCRe-expressing strain exhibited a remarkable reduction in molecular weight. Western blotting was performed to estimate the amounts of PhaCs in the soluble fractions obtained by low-speed centrifugation (Fig. 7). Based on the band intensity, the amount of soluble PhaCAc was decreased to one-half by the expression of PhaPAc (Fig. 7a), while the amount of PhaCRe in the soluble fraction was increased approximately 3-fold by PhaPAc expression (Fig. 7b).
FIG 6.
Effect of PhaPAc expression on P(3HB) accumulation in the PhaCAc-expressing strain (pBBR1::phaCAcABRe) (a) and the PhaCRe-expressing strain (pBBR1::phaCABRe) (b). A higher l-arabinose concentration induced a stronger expression of PhaPAc in the araBAD system. Empty plasmid pBAD33 was retained in each control strain instead of using pBAD::TEE+phaPAc. Residual cell mass was calculated as the dry cell weight minus P(3HB). Error bars indicate the standard deviations (n = 3).
TABLE 3.
P(3HB) synthesis in recombinant E. coli TOP10 cells cultured in the presence of l-arabinosea
| Expressed protein(s) | Dry cell wt (g/liter) | P(3HB) content (wt%) | Mn (×105) | Mw (×105) | Mw/Mn |
|---|---|---|---|---|---|
| PhaCAc | 1.2 ± 0.1 | 17 ± 2 | 3.5 ± 0.6 | 12.0 ± 0.9 | 3.4 |
| PhaCAc + PhaPAc | 2.1 ± 0.4 | 39 ± 4 | 2.4 ± 0.6 | 7.4 ± 0.5 | 3.1 |
| PhaCRe | 1.9 ± 0.1 | 35 ± 2 | 24.9 ± 3.5 | 39.9 ± 6.3 | 1.6 |
| PhaCRe + PhaPAc | 2.1 ± 0.1 | 43 ± 1 | 9.3 ± 1.1 | 24.4 ± 1.4 | 2.6 |
Strains were the same as in the experiments whose results are shown in Fig. 6. The l-arabinose concentration was 1.0% (wt/vol). Results are expressed as the means ± standard errors (n = 3).
FIG 7.
Western blots of PhaCs in 6-h-cultured PhaCAc-expressing strains (a) and PhaCRe-expressing strains (b) with and without PhaP expression. The l-arabinose concentration was 1.0% (wt/vol). Lanes 1, 3, 5, 7, 9, and 11 are PhaPAc-free strains. Lanes 2, 4, 6, 8, 10, and 12 are PhaPAc-expressing strains. The soluble cell extract, containing PHA granules, and the insoluble precipitate were separated by low-speed centrifugation (1,500 × g, 5 min, 4°C). The amount of protein in each lane was 8 μg.
DISCUSSION
Previous studies have indicated that PhaPs have an enhancing effect on PHA biosynthesis in vivo (9, 10, 24, 25). To further investigate this effect, we performed in vitro polymerization activity assays in this study. Our results demonstrated that both PhaPAc and PhaP1Re increased PhaCAc activity, providing convincing evidence of PhaP-mediated PhaCAc activation at the molecular level. In contrast, PhaCRe and PhaCDa showed reduced activities in the presence of PhaPs (Table 1). Some detergents, such as Triton X-100 and Hecameg, have been shown to activate PhaCRe and PhaCDa in vitro (17, 18). We tested the ability of these detergents to activate PhaCAc, but an activating effect was not observed (data not shown). Although these detergents and PhaPs are both amphiphilic molecules, the behavior of PhaCs was very different depending on the additive used. Therefore, PhaPs and the detergents appear to have different activation mechanisms for PhaCs. Most recently, PhaM, a DNA- and PHA-binding protein, has been shown to have an activating effect for PhaCRe (26). PhaPs and PhaM have the same ability to bind PHA granules; however, their effects on PhaCRe activity were opposite. The underlying mechanism for this difference between PhaPs and PhaM would be an interesting subject for study.
With respect to P(3HB-co-3HHx) production in the PhaCAc-expressing strain, several studies have reported that PhaPAc affects not only PHA accumulation levels but also the 3HHx fraction in the polymer (8, 9). We hypothesized that the enhanced 3HHx fraction was also the result of the PhaP-activating effect of PhaCAc. To test this hypothesis, the effect of PhaPAc on the substrate specificity of PhaCAc was investigated using R-3HHx-CoA (C6 substrate) and R-3HB-CoA (C4 substrate). The PhaCAc activity toward R-3HHx-CoA was increased 4.3-fold by the presence of PhaPAc, which was a significantly higher fold increase in activation than was observed for the C4 substrate (2.5-fold), suggesting that the substrate preference of the activated PhaCAc is slightly shifted toward the C6 substrate. This shift may explain the increased 3HHx incorporation previously observed in vivo (8, 9).
Regarding the activity assays of PhaCRe in the presence of PhaPs, the in vitro results were not consistent with the in vivo result (Fig. 2 and 6b). In the presence of PhaPs, PhaCRe showed reduced activity in vitro, but the activity was not reduced in vivo. Cho and coworkers (27) reported a similar inhibitory effect of PhaP1Re on PhaCRe activity in vitro. According to their report (27), PhaP1Re reduced the in vitro activity of PhaCRe mainly by increasing the lag phase at the start of polymerization. However, our observations indicated that the maximum velocity in the activity assay was mainly repressed by the presence of PhaPs (Fig. 4). The reason for this difference might be attributed to the difference in PhaP1Re concentrations; namely, the PhaP concentration in our study (5 μM) was higher than the concentration used in their study (0.14 μM).
In addition, Cho and coworkers (27) reported that the PhaCRe-PHA-PhaP1Re complex showed higher polymerization activity than the prepolymerization PhaCRe even though the PhaCRe-PHA-PhaP1Re complex contained a high molar ratio of PhaP1Re (PhaP1Re-PhaCRe-PHA chain = 9:3:1). This observation has led to the hypothesis that the PHA chain prevents the inhibitory effect of PhaPs on PhaCRe polymerization activity. To test this hypothesis, we conducted an activity assay using polymer-elongating PhaCs. The polymer-elongating PhaCRe prepared by the two-step addition of substrate in vitro showed almost the same polymerization activity regardless of PhaP addition (Fig. 5b), suggesting that the PHA chain plays an important role in preventing the reduction of PhaCRe activity by PhaPs. The inhibitory effect by PhaP only occurred in the initial stage of the polymerization reaction; therefore, it is not likely to be observed in in vivo studies.
As shown in Fig. 6, the PhaPAc expression level was controlled by the l-arabinose concentration. The P(3HB) content was increased in both PhaCAc- and PhaCRe-expressing strains when the l-arabinose concentrations were over 0.2% (wt/vol). The highest P(3HB) accumulations were observed at 1.0% (wt/vol) l-arabinose, leading to 2.3- and 1.2-fold increases in the P(3HB) content for the PhaCAc- and PhaCRe-expressing strains, respectively, compared with the expression levels in the corresponding PhaPAc-free strains. These data imply that a higher expression level of PhaPAc results in a greater positive effect on PHA production in vivo. From the Western blot analysis of 6-h-cultured cells (Fig. 7), the amount of soluble PhaCAc was slightly decreased by the expression of PhaPAc, while the amount of soluble PhaCRe was markedly increased. The difference in the levels of soluble PhaCAc would result from differences in the cell growth phase, that is, the PhaPAc-free strain was still actively growing at 6 h of cultivation (polymer content, 9% [wt]), while the PhaPAc-expressing strain was already beginning to accumulate P(3HB) (22% [wt]) due to the activated PhaCAc. Thus, the protein expression pattern in these PhaCAc-expressing strains might be slightly different. On the other hand, the difference in soluble PhaCRe is attributed to the increased solubility of PhaCRe by the presence of PhaPAc. In general, as the amount of soluble PhaCRe increases in cells, the PHA chain number increases, whereas the molecular weight decreases (23). The P(3HB) molecular weight data (Table 3) are consistent with the fact that the amount of soluble PhaCRe increased. These observations may suggest that PhaPAc plays a chaperone-like role in PhaCRe folding, which is a previously unrecognized function of PhaPs. Further studies are needed to confirm the role of PhaPs in protein folding.
PhaPs have been reported to form trimers or tetramers as shown by X-ray analysis (28, 29). On the other hand, PhaCs were observed in oligomeric form at the initial stage of PHA polymerization by atomic force microscope imaging (19, 30), but the PhaC dimer is thought to be a minimal functional unit (1, 15). Based on the observations in this study and previous works (19, 27–30), we propose a role for PhaPs in the initial stage of PHA polymerization by PhaCAc, as shown in Fig. 8. In this model, we assume that PHA synthase has a monomer uptake site and a polymer release site, which are distantly located. In the PhaP-free model, a synthesized PHA chain would generate hydrophobic aggregation near the polymer release site. Hydrophobic aggregation of the PHA chain might be stuck and block the release site, thereby preventing effective polymerization by PhaCAc (Fig. 8a). In the presence of PhaP, the PhaP molecules adsorb to the PHA chain, which increases PHA's hydrophilicity, thus leading to prevention of PHA chain aggregation (Fig. 8b). In fact, the specific activity of the prepolymerization PhaCAc was lower than that of the prepolymerization PhaCRe (Table 1), which was most likely due to inefficient polymer release of the prepolymerization PhaCAc. To further verify the validity of this model, detailed structural information of PhaCs and PhaPs is necessary, which is currently unresolved.
FIG 8.
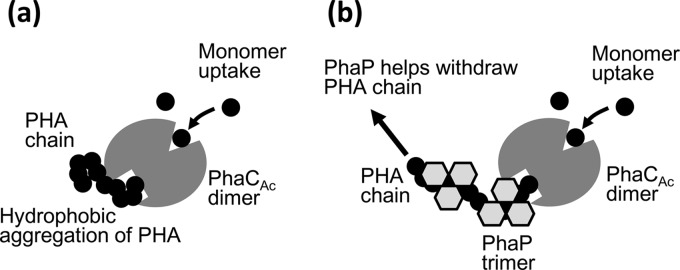
Proposed model of PhaP function for assisting in the initial stage of PHA polymerization by PhaCAc. PhaCAc and PhaP are illustrated as dimer and trimer forms, respectively. (a) PhaCAc alone. (b) PhaCAc with PhaPs. See text for details.
In conclusion, this study demonstrated that PhaPs could function as activators of PhaCAc, in addition to controlling the surface properties of PHA granules. PhaCAc was activated in vitro by the presence of PhaPs both in the prepolymerization state and the polymer-elongating state. The PhaPAc-activated PhaCAc exhibited a substrate preference that was slightly shifted toward the C6 substrate. In contrast, the activities of prepolymerization PhaCRe and PhaCDa were decreased by PhaPAc, whereas the activity of polymer-elongating PhaCRe was not affected. PhaPAc expression in vivo increased P(3HB) accumulation 2.3-fold and 1.2-fold in the PhaCAc strain and PhaCRe strain, respectively, compared with its accumulation in the corresponding PhaPAc-free strains. The enhanced P(3HB) accumulation may be attributed to the role that PhaPAc plays in assisting the initial stage of PHA polymerization by PhaCAc and its chaperone-like role in PhaCRe folding. These observations provide new insights into the functions of PhaPs and highlight the importance of PhaPs for effective PHA production.
Supplementary Material
ACKNOWLEDGMENTS
This work was supported by JSPS KAKENHI grant number 19681008 to T.T. K.U. is the recipient of a JSPS young scientist fellowship (13J07410).
Footnotes
Published ahead of print 28 February 2014
Supplemental material for this article may be found at http://dx.doi.org/10.1128/AEM.04179-13.
REFERENCES
- 1.Rehm BHA. 2003. Polyester synthases: natural catalysts for plastics. Biochem. J. 376:15–33. 10.1042/BJ20031254 [DOI] [PMC free article] [PubMed] [Google Scholar]
- 2.Sudesh K, Abe H, Doi Y. 2000. Synthesis, structure and properties of polyhydroxyalkanoates: biological polyesters. Prog. Polym. Sci. 25:1503-1555. 10.1016/S0079-6700(00)00035-6 [DOI] [Google Scholar]
- 3.Tsuge T, Imazu S, Takase K, Taguchi S, Doi Y. 2004. An extra large insertion in the polyhydroxyalkanoate synthase from Delftia acidovorans DS-17: its deletion effects and relation to cellular proteolysis. FEMS Microbiol. Lett. 231:77-83. 10.1016/S0378-1097(03)00930-3 [DOI] [PubMed] [Google Scholar]
- 4.Wieczorek R, Pries A, Steinbüchel A, Mayer F. 1995. Analysis of a 24-kilodalton protein associated with the polyhydroxyalkanoic acid granules in Alcaligenes eutrophus. J. Bacteriol. 177:2425–2435 [DOI] [PMC free article] [PubMed] [Google Scholar]
- 5.Hanleya SZ, Pappin DJC, Rahman D, White AJ, Elborough KM, Slabas AR. 1999. Re-evaluation of the primary structure of Ralstonia eutropha phasin and implications for polyhydroxyalkanoic acid granule binding. FEBS Lett. 447:99–105. 10.1016/S0014-5793(99)00235-5 [DOI] [PubMed] [Google Scholar]
- 6.Stubbe J, Tian J, He A, Sinskey AJ, Lawrence AG, Liu P. 2005. Nontemplate-dependent polymerization processes: polyhydroxyalkanoate synthases as a paradigm. Annu. Rev. Biochem. 74:433–480. 10.1146/annurev.biochem.74.082803.133013 [DOI] [PubMed] [Google Scholar]
- 7.Fukui T, Doi Y. 1997. Cloning and analysis of the poly(3-hydroxybutyrate-co-3-hydroxyhexanoate) biosynthesis genes of Aeromonas caviae. J. Bacteriol. 179:4821–4830 [DOI] [PMC free article] [PubMed] [Google Scholar]
- 8.Kichise T, Fukui T, Yoshida Y, Doi Y. 1999. Biosynthesis of polyhydroxyalkanoates (PHA) by recombinant Ralstonia eutropha and effects of PHA synthase activity on in vivo PHA biosynthesis. Int. J. Biol. Macromol. 25:69-77. 10.1016/S0141-8130(99)00017-3 [DOI] [PubMed] [Google Scholar]
- 9.Fukui T, Kichise T, Iwata T, Doi Y. 2001. Characterization of 13 kDa granule-associated protein in Aeromonas caviae and biosynthesis of polyhydroxyalkanoates with altered molar composition by recombinant bacteria. Biomacromolecules 2:148-153. 10.1021/bm0056052 [DOI] [PubMed] [Google Scholar]
- 10.Tian SJ, Lai WJ, Zheng Z, Wang HX, Chen GQ. 2005. Effect of over-expression of phasin gene from Aeromonas hydrophila on biosynthesis of copolyesters of 3-hydroxybutyrate and 3-hydroxyhexanoate. FEMS Microbiol. Lett. 244:19–25. 10.1016/j.femsle.2005.01.020 [DOI] [PubMed] [Google Scholar]
- 11.Watanabe Y, Ichinomiya Y, Shimada D, Saika A, Abe H, Taguchi S, Tsuge T. 2012. Development and validation of an HPLC-based screening method to acquire polyhydroxyalkanoate synthase mutants with altered substrate specificity. J. Biosci. Bioeng. 113:286–292. 10.1016/j.jbiosc.2011.10.015 [DOI] [PubMed] [Google Scholar]
- 12.Matsusaki H, Abe H, Taguchi T, Fukui T, Doi Y. 2000. Biosynthesis of poly(3-hydroxybutyrate-co-3-hydroxyalkanoates) by recombinant bacteria expressing the PHA synthase gene phaC1 from Pseudomonas sp. 61-3. Appl. Microbiol. Biotechnol. 53:401-409. 10.1007/s002530051633 [DOI] [PubMed] [Google Scholar]
- 13.Agus J, Kahar P, Abe H, Doi Y, Tsuge T. 2006. Molecular weight characterization of poly[(R)-3-hydroxybutyrate] synthesized by genetically engineered strains of Escherichia coli. Polym. Degrad. Stab. 91:1138-1146. 10.1016/j.polymdegradstab.2005.07.006 [DOI] [Google Scholar]
- 14.Kovach ME, Elzer PH, Hill DS, Robertson GT, Farris MA, Roop RM, II, Peterson KM. 1995. Four new derivatives of the broad-host-range cloning vector pBBR1MCS, carrying different antibiotic-resistance cassettes. Gene 166:175–176. 10.1016/0378-1119(95)00584-1 [DOI] [PubMed] [Google Scholar]
- 15.Numata K, Motoda Y, Watanabe S, Tochio N, Kigawa T, Doi Y. 2012. Active intermediates of polyhydroxyalkanoate synthase from Aeromonas caviae in polymerization reaction. Biomacromolecules 13:3450-3455. 10.1021/bm301276k [DOI] [PubMed] [Google Scholar]
- 16.Normi YM, Hiraishi T, Taguchi S, Abe H, Sudesh K, Najimudin N, Doi Y. 2005. Characterization and properties of G4X mutants of Ralstonia eutropha PHA synthase for poly(3-hydroxybutyrate) biosynthesis in Escherichia coli. Macromol. Biosci. 5:197-206. 10.1002/mabi.200400181 [DOI] [PubMed] [Google Scholar]
- 17.Hiroe A, Ushimaru K, Tsuge T. 2013. Characterization of polyhydroxyalkanoate (PHA) synthase derived from Delftia acidovorans DS-17 and the influence of PHA production in Escherichia coli. J. Biosci. Bioeng. 115:633–638. 10.1016/j.jbiosc.2012.12.015 [DOI] [PubMed] [Google Scholar]
- 18.Ushimaru K, Sangiambut S, Thomson N, Sivaniah E, Tsuge T. 2013. New insights into activation and substrate recognition of polyhydroxyalkanoate synthase from Ralstonia eutropha. Appl. Microbiol. Biotechnol. 97:1175–1182. 10.1007/s00253-012-4089-x [DOI] [PubMed] [Google Scholar]
- 19.Sato S, Ono Y, Mochiyama Y, Sivaniah E, Kikkawa Y, Sudesh K, Hiraishi T, Doi Y, Abe H, Tsuge T. 2008. Polyhydroxyalkanoate film formation and synthase activity during in vitro and in situ polymerization on hydrophobic surfaces. Biomacromolecules 9:2811-2818. 10.1021/bm800566s [DOI] [PubMed] [Google Scholar]
- 20.Fukui T, Yoshimoto A, Matsumoto M, Hosokawa S, Saito T, Nishikawa H, Tomita K. 1976. Enzymatic synthesis of poly-β-hydroxybutyrate in Zoogloea ramigera. Arch. Microbiol. 110:149–156. 10.1007/BF00690222 [DOI] [PubMed] [Google Scholar]
- 21.Kato M, Bao HJ, Kang CK, Fukui T, Doi Y. 1996. Production of a novel copolyester of 3-hydroxybutyric acid and medium-chain-length 3-hydroxyalkanoic acids by Pseudomonas sp. 61-3 from sugars. Appl. Microbiol. Biotechnol. 45:363-370. 10.1007/s002530050697 [DOI] [Google Scholar]
- 22.Fukui T, Yokomizo S, Kobayashi G, Doi Y. 1999. Co-expression of polyhydroxyalkanoate synthase and (R)-enoyl-CoA hydratase genes of Aeromonas caviae establishes copolyester biosynthesis pathway in Escherichia coli. FEMS Microbiol. Lett. 170:69-75. 10.1111/j.1574-6968.1999.tb13356.x [DOI] [PubMed] [Google Scholar]
- 23.Hiroe A, Tsuge K, Nomura CT, Itaya M, Tsuge T. 2012. Rearrangement of gene order in the phaCAB operon leads to effective production of ultrahigh-molecular-weight poly[(R)-3-hydroxybutyrate] in genetically engineered Escherichia coli. Appl. Environ. Microbiol. 78:3177–3184. 10.1128/AEM.07715-11 [DOI] [PMC free article] [PubMed] [Google Scholar]
- 24.York GM, Stubbe JA, Sinskey AJ. 2001. New insight into the role of the PhaP phasin of Ralstonia eutropha in promoting synthesis of polyhydroxybutyrate. J. Bacteriol. 183:2394–2397. 10.1128/JB.183.7.2394-2397.2001 [DOI] [PMC free article] [PubMed] [Google Scholar]
- 25.York GM, Stubbe JA, Sinskey AJ. 2002. The Ralstonia eutropha PhaR protein couples synthesis of the PhaP phasin to the presence of polyhydroxybutyrate in cells and promotes polyhydroxybutyrate production. J. Bacteriol. 184:59–66. 10.1128/JB.184.1.59-66.2002 [DOI] [PMC free article] [PubMed] [Google Scholar]
- 26.Pfeiffer D, Jendrossek D. 2013. PhaM is the physiological activator of PHB synthase (PhaC1) in Ralstonia eutropha. Appl. Environ. Microbiol. 10.1128/AEM.02935-13 [DOI] [PMC free article] [PubMed] [Google Scholar]
- 27.Cho M, Brigham CJ, Sinskey AJ, Stubbe J. 2012. Purification of polyhydroxybutyrate synthase from its native organism, Ralstonia eutropha: implications for the initiation and elongation of polymer formation in vivo. Biochemistry 51:2276–2288. 10.1021/bi2013596 [DOI] [PMC free article] [PubMed] [Google Scholar]
- 28.Neumann L, Spinozzi F, Sinibaldi R, Rustichelli F, Pötter M, Steinbüchel A. 2008. Binding of the major phasin, PhaP1, from Ralstonia eutropha H16 to poly(3-hydroxybutyrate) granules. J. Bacteriol. 190:2911–2919. 10.1128/JB.01486-07 [DOI] [PMC free article] [PubMed] [Google Scholar]
- 29.Zhao M, Li Z, Zheng W, Lou Z, Chen GQ. 2006. Crystallization and initial X-ray analysis of polyhydroxyalkanoate granule-associated protein from Aeromonas hydrophila. Acta Crystallogr. Sect. F Struct. Biol. Cryst. Commun. 62:814–819. 10.1107/S1744309106025000 [DOI] [PMC free article] [PubMed] [Google Scholar]
- 30.Kikkawa Y, Narike M, Hiraishi T, Kanesato M, Sudesh K, Doi Y, Tsuge T. 2005. Organization of polyhydroxyalkanoate synthase for in vitro polymerization as revealed by atomic force microscopy. Macromol. Biosci. 5:929-935. 10.1002/mabi.200500115 [DOI] [PubMed] [Google Scholar]
Associated Data
This section collects any data citations, data availability statements, or supplementary materials included in this article.


