

Abstract
Iron plays a critical role in the physiology of Geobacter species. It serves as both an essential component for proteins and cofactors and an electron acceptor during anaerobic respiration. Here, we investigated the iron stimulon and ferric uptake regulator (Fur) regulon of Geobacter sulfurreducens to examine the coordination between uptake of Fe(II) and the reduction of Fe(III) at the transcriptional level. Gene expression studies across a variety of different iron concentrations in both the wild type and a Δfur mutant strain were used to determine the iron stimulon. The stimulon consists of a broad range of gene products, ranging from iron-utilizing to central metabolism and iron reduction proteins. Integration of gene expression and chromatin immunoprecipitation (ChIP) data sets assisted in the identification of the Fur transcriptional regulatory network and Fur's role as a regulator of the iron stimulon. Additional physiological and transcriptional analyses of G. sulfurreducens grown with various Fe(II) concentrations revealed the depth of Fur's involvement in energy metabolism and the existence of redundancy within the iron-regulatory network represented by IdeR, an alternative iron transcriptional regulator. These characteristics enable G. sulfurreducens to thrive in environments with fluctuating iron concentrations by providing it with a robust mechanism to maintain tight and deliberate control over intracellular iron homeostasis.
INTRODUCTION
Iron, one of the metal ions essential for life, exhibits unique characteristics that allow it to act as both a biocatalyst and an electron carrier for a broad range of proteins in both its Fe(II) and Fe(III) oxidative states (1). Additionally, iron fulfils an additional energetic niche by serving as a terminal electron acceptor for bacterially mediated iron reduction. This process, first demonstrated for Deltaproteobacteria of the genus Geobacter (2, 3), is believed to be facilitated by iron-containing cytochromes that allow direct electron transfer to iron and other extracellular electron acceptors (4). Because of this ability, Geobacter sulfurreducens is capable of generating a source of Fe(II) by reduction of Fe(III), a commonly abundant mineral in the environment in the form of various iron oxides. As the dominant iron-reducing bacterium in many subsurface environments, G. sulfurreducens iron uptake and usage must be tightly coordinated with metabolism to maintain appropriate intracellular iron concentrations (5, 6). This complex regulation is in part mediated at the transcriptional level by the ferric uptake regulator (Fur) (1).
Fur is a homodimeric protein whose transcriptional activity is controlled by intracellular Fe(II) (1). The binding of Fe(II) induces a conformational change that allows Fur to behave as a transcriptional repressor by blocking access of RNA polymerase to the DNA. This mechanism of Fur regulation has been identified across a diverse range of bacteria, including the model organism Escherichia coli and the human pathogens Helicobacter pylori and Neisseria gonorrhoeae as well as the Gram-positive bacterium Bacillus subtilis (7–10). Although Fur was originally considered a regulator of genes involved in iron uptake, it is becoming more apparent that it functions as a global regulator involved in a variety of processes such as virulence, motility, and response to oxidative stress (11, 12). Understanding the role of Fur in the transcriptional regulatory network of the iron-reducing G. sulfurreducens, particularly with respect to the organism's iron stimulon, will shed light on how iron homeostasis and energy flow are balanced during reduction of iron and other metals such as uranium.
MATERIALS AND METHODS
Bacterial strains and growth conditions.
Geobacter sulfurreducens strain PCA (ATCC 51573) was grown in freshwater medium with acetate as the energy source as previously described (13). The following changes to the medium composition were made to create three distinct sets of iron conditions. Iron-excess conditions contained 55 mM Fe(III) citrate as the sole electron acceptor, with additional 36 μM Fe(II) from the trace mineral stock. Cells were harvested for experiments after 24 mM Fe(II) had been generated from Fe(III) reduction. Iron-sufficient conditions contained 28 mM fumarate as the sole electron acceptor, plus 36 μM Fe(II) from the trace mineral stock. Iron-deficient conditions contained only 28 mM fumarate as the sole electron acceptor, and iron was omitted from the trace mineral solution under this condition.
A Fur (GSU1379) knockout strain of G. sulfurreducens was used for all knockout experiments. Knockout mutants were constructed via homologous recombination (14). The Fur-deficient mutant (DLRO1 [fur::kan]) was constructed by replacing a 330-bp stretch encompassing 75% of the Fur coding sequence with a kanamycin resistance cassette. An IdeR-deficient mutant (DLRO2 [ideR::spc]) was constructed by replacing 95% of the IdeR coding sequence with a spectinomycin resistance cassette. Linear DNA fragments for targeted gene disruption were constructed by recombinant PCR using primers Fur1 (CCTGCTACGGTCTCGGTATC), Fur2 (TGGCGATGTAATCATGGA), Fur3 (TCCATGATTACATCGCCAACCTGGGATGAATGTCAGCTA), Fur4 (TATGGGTGGTGATGACGAAGAAGGCGGCGGTGGAATC), Fur5 (TCGTCATCACCACCCATA), and Fur6 (AGTTGGAAACCGCCACATAG). Primers Dtx1 (CTCGTCAACTGGATGGAGC), Dtx2 (GGGTGCTCCTTTGCATGT), Dtx3 (CAATGCAAAGGAGCACCCAGCACAGGATGACGCCTAAC), Dtx4 (CTGCTCCTATTTCCTCACGAAGCGGCGTCGGCTTGAACG), Dtx5 (TCGTGAGGAAATAGGAGCAG), and Dtx6 (GTGCCGATGAAATCTCCGAG) were used to disrupt the IdeR gene. The kanamycin and spectinomycin resistance cassettes were amplified from pBBR1MCS-2 and pSJS985Q, respectively. A double mutant (DLRO3 [fur::kan; ideR::spc]) was constructed using the two linear fragments described above. Electroporation and mutant isolation were conducted as previously described (13). Gene disruption was confirmed by PCR and Southern blotting, and one clone of each genotype was chosen as the representative strain.
Cultures in Fe(III) citrate medium (iron-excess condition) were harvested at mid-log phase, which was verified by using a previously described ferrozine assay to determine the concentration of Fe(III) that had been reduced to Fe(II) (15). In this case, cultures were grown until ∼24 mM iron had been reduced. Cultures under iron-sufficient and -deficient conditions were also harvested at mid-log phase, which was determined by a previously established growth curve of optical density versus time.
ChIP and identification of Fur binding regions.
A previously described chromatin immunoprecipitation with microarray technology (ChIP-chip) protocol (16, 17) was adapted and applied to G. sulfurreducens. Genome-wide binding sites for Fur were identified for wild-type cells grown to mid-log phase in triplicate under the three iron conditions described above. Additional ChIP experiments with the Δfur mutant grown under the iron-sufficient condition were also performed. Prior to microarray hybridization, enrichment of IP DNA fragments was verified with real-time quantitative PCR (qPCR) of fur (GSU1379) and a gene coding for the ferrous iron transport protein FeoB-2 (GSU3268). Quantitative PCR and amplification of DNA were performed as previously described (17). Microarray hybridizations, washes, and scans were performed on high-density oligonucleotide tiling microarrays in accordance with the instructions of the manufacturer (Roche NimbleGen).
Binding regions of Fur were determined as previously described (18) with an false-discovery rate (FDR) of 5%. Binding data were extended using operon predictions from the database of prokaryotic operons (DOOR) (19). Sequences encompassed by each peak were extracted and processed by the MEME algorithm (20). Potential motifs were further processed with FIMO (21, 22). FIMO results were filtered by the ChIP-chip binding sites to obtain a map of all motifs falling within binding peaks.
Transcriptome analysis.
Biological triplicates of wild-type G. sulfurreducens cells were harvested in mid-log phase from each of the three aforementioned iron conditions. Total RNA was extracted with TRIzol reagent (Invitrogen). Residual DNA was removed by digestion with DNase I (Qiagen) followed by purification using an RNeasy Minikit (Qiagen). A total of 10 μg of purified total RNA sample was reverse transcribed to cDNA with aminoallyl dUTP. The aminoallyl-labeled cDNA samples were then coupled with Cy3 monoreactive dyes (Amersham). Cy3-labeled cDNAs were fragmented to a 50- to 300-bp range with DNase I (Epicentre). Microarray hybridizations, washes, and scans were performed in accordance with manufacturer's instructions on high-density oligonucleotide tiling microarrays (Roche NimbleGen). The custom microarrays consisted of 381,174 50-mer probes spaced 20 bp apart across the whole G. sulfurreducens genome. Probe-level data were normalized with the Robust multiarray analysis (RMA) algorithm (23) without background correction, as implemented in NimbleScan 2.4 software.
Fold changes, log2 difference values, and P values were calculated. A gene was considered differentially expressed if the log2 difference was >1 and highly differentially expressed if the log2 difference was >3 with a P value < 0.05 (see Table SA1 in the supplemental material). Differentially expressed genes were then analyzed and integrated with ChIP-chip data.
Cells of the Δfur mutant were grown under iron-sufficient and iron-deficient conditions and harvested during mid-log phase. In addition, wild-type G. sulfurreducens cells were grown in the iron-sufficient medium and harvested during mid-log phase. Total RNA was extracted from cells grown under these three conditions with TRIzol reagent (Invitrogen). Residual DNA was removed by DNase I digestion (Qiagen) followed by purification with an RNeasy Minikit (Qiagen). A total of 3.5 μg of total RNA was treated with a Gram-negative RiboZero kit (Epicentre). Paired-end, strand-specific RNA sequencing was performed using a variation of the dUTP method outlined in references 24 and 25 with the following changes. A 100-ng volume of rRNA-subtracted RNA was fragmented with RNA fragmentation reagents (Ambion) for 3 min at 70°C. First-strand synthesis was primed using random hexamers (Invitrogen). Downstream library construction was performed as previously described (26). Final libraries were quantified using qPCR (Kapa Biosystems) and sequenced on an Illumina Genome Analyzer II. The obtained transcriptome sequencing (RNA-seq) reads were mapped to the G. sulfurreducens genome sequence (RefSeq NC_002939) using the short-read aligner Bowtie (http://bowtie-bio.sourceforge.net) (27) with two mismatches allowed per read alignment. To estimate transcript abundances, values of fragments per kilobase of exon per million fragments mapped (FPKM) were calculated using the tool Cufflinks (http://cufflinks.cbcb.umd.edu/) (28) with appropriate parameters set for the strand-specific library type and upper-quartile normalization. The transcript annotation used for this analysis was obtained from the latest experimental annotation of the G. sulfurreducens genome (29). Differential expression analysis was performed for both Δfur mutant conditions relative to wild-type G. sulfurreducens using the Cuffdiff feature of the cufflinks package (28). Genes with a >2-fold change in expression value and false-discovery rate (FDR) of <0.05 were considered to be differentially expressed.
Expression of individual genes was also analyzed by qPCR. cDNA was collected from both the wild-type and Δfur cells harvested during log phase and converted to cDNA using Invitrogen SuperScript III. The following gene products were targeted: citrate synthase (GSU1106), isocitrate dehydrogenase (GSU1465), OmcZ (GSU2076), and RpoD (GSU3089). Bio-Rad 2× SYBR Mastermix was used with the following primers to generate gene expression values: primer pair GSU1106 F (GCACCACCCGGCTCGTAAAGG) and GSU1106 R (CCAGGCAGCGGATGTCACGG), primer pair GSU1465 F (TGATGAAGCGCCCGCACTGG) and GSU1465 R (GCGTCAGTCAGGTTTTCCGGG), primer pair GSU2076 F (AGCACCGTGTCGCTGACGTG) and GSU2076 R (CGCAGCAATGGTGGGTGCAG), and primer pair GSU3089 F (TACCTTCTGGGCCGAATCGACG) and GSU3089 R (ATGGCCAAGAAAAGCACGGACG). Reactions were melted at 95°C for 30 s and then cycled 39 times with a 5-s denaturation step at 95°C and 15 s annealing/extension.
Microarray data accession numbers.
ChIP data sets can be accessed through GEO (accession no. GSE54304 and GSE54305).
RESULTS
Deciphering the iron stimulon of Geobacter sulfurreducens. (i) Investigating the iron stimulon under Fe(III)-reducing conditions.
Iron plays a critical role in the energy metabolism of the dissimilatory Fe(III)-reducer G. sulfurreducens. Thus, gene expression data were generated for G. sulfurreducens cultured on different terminal electron acceptors to determine the span of the iron stimulon during Fe(III) reduction. Profiles were generated for cells grown under the iron-excess condition [Fe(III) as the sole electron acceptor] as well as for those grown under the iron-deficient and iron-sufficient conditions (fumarate as the sole electron acceptor) in order to identify gene expression changes deriving from differences in terminal electron acceptors. Comparison of these conditions revealed 295 significantly differentially expressed genes (75 genes found within both profiles), with roughly even distributions of upregulated and downregulated genes (Fig. 1B; see also Table SA1 in the supplemental material). Differentially expressed genes were then categorized based on the cellular function of gene products (see Table SA2). The most enriched categories were energy metabolism and transport and binding proteins.
FIG 1.

Gene expression of G. sulfurreducens under iron-deficient, iron-sufficient, and iron-excess conditions. (A) Heat map representing gene expression from all three iron conditions investigated. (B) Overlap between the gene expression profiles for the iron-deficient, iron-sufficient, and iron-excess conditions. (C) Fold change of expression among genes that exhibited significant differential expression across all three iron profiles. Purple represents the iron-deficient versus iron-excess condition, yellow represents the iron-sufficient versus iron-excess condition, and orange represents the iron-deficient versus iron-sufficient condition.
Genes related to energy metabolism dominated both differential expression profiles (see Table SA1 in the supplemental material). These genes primarily encoded proteins containing high numbers of heme or iron-sulfur clusters, with c-type cytochromes of various heme numbers appearing most frequently. Fifteen different c-type cytochromes were found to be more highly expressed during Fe(III) reduction than during fumarate reduction, but only two (GSU1740 and GSU2743, both 1-heme cytochromes) were significantly upregulated under fumarate-reducing conditions. Because the reduction of Fe(III) directly generates a source of Fe(II) for the cell, this suggests that when the environment is deficient in iron, the iron stimulon may shift gene expression to favor cytochromes with a lower heme number (lower iron requirement) to accommodate iron scarcity. Alternatively, these multiheme cytochromes may be required for Fe(III) respiration and thus may be downregulated when Fe(III) is not a terminal electron acceptor. All genes encoding NADH hydrogenase (GSU0338 to GSU0351) were found to be significantly differentially expressed. However, these genes were upregulated 2- to 3-fold with increasing external iron concentrations in the iron-sufficient and iron-deficient versus iron-excess profiles. Other upregulated genes included genes of proteins involved in central metabolism such as citrate synthase (GSU1106), isocitrate dehydrogenase (GSU1465), and malate dehydrogenase (GSU1466), as well as Fe(III) reductase (GSU0510 and GSU0534), 2-oxoglutarate-ferredoxin oxidoreductase (GSU1467 to GSU1470), and aconitate hydratase (GSU1660). OmcZ (GSU2076), a cytochrome shown to be required for Fe(III) reduction (30), was also upregulated under Fe(III)-reducing conditions.
Genes previously found to be involved in iron homeostasis in other bacteria, such as Feo iron transporters and Fur, were found to be downregulated (31, 32). Uptake of iron in its Fe(II) form has been shown to be dependent on a variety of transport systems (33). In G. sulfurreducens, two systems belonging to the Feo family, FeoB (GSU1380) and FeoB-2 (GSU3268), have been found to facilitate the transport of Fe(II) (33). A gene coding for a FeoA family protein (GSU3270), a gene responsible for promoting FeoB activity, has also been identified in the G. sulfurreducens genome. All Feo genes were found to be most downregulated during Fe(III) reduction, the condition exhibiting the highest external Fe(II) concentrations. As found in previous studies, downregulation of these transporters as iron is sequestered by the cell sustains appropriate intracellular iron concentrations (33). Additionally, 11 genes encoding efflux pump subunits, three of which are heavy metal or metal ion specific, were also downregulated during Fe(III) reduction, implying a role of these pumps in the maintenance of iron homeostasis. GSU0384 and GSU1642, both encoding ferritin-like domain proteins likely to be involved in intracellular iron storage, were found to be significantly differentially expressed. However, GSU0384 was most highly expressed during Fe(III) reduction whereas GSU1642 was most highly expressed during fumarate reduction (iron-sufficient condition), implying that different ferritins may be utilized under different conditions depending on the amount of iron loading required by the cell.
Of particular note, both Fur (GSU1379) and IdeR (GSU1382) were more highly expressed during fumarate reduction than during Fe(III) reduction. These two genes encode transcriptional regulators involved in iron homeostasis whose activity depends on the intracellular iron concentration (1). Previous studies have shown that Fur autoregulates its own expression (34). Thus, as the external Fe(II) concentration increases as a consequence of Fe(III) reduction, the expression of Fur is downregulated. The same pattern of expression was observed for IdeR—as the external Fe(II) concentration increased, expression of IdeR decreased.
(ii) Investigating the effects of the external Fe(II) concentration on the iron stimulon.
To further investigate the G. sulfurreducens iron stimulon, differential expression analysis was also performed to compare wild-type G. sulfurreducens cultured under iron-deficient conditions to that cultured under iron-sufficient conditions to investigate the transcriptional response to fluctuating external Fe(II) concentrations in a manner independent of Fe(III) reduction (Fig. 1B). A total of 95 genes were found to be differentially expressed—55 genes were upregulated, and 40 were downregulated (Fig. 1B; see also Table SA1 in the supplemental material). Of these 95 differentially expressed genes, 82 overlapped with those from the previous comparison: 13 genes overlapped with both profiles, 5 with the iron-sufficient profile versus the iron-excess profile, and 64 with the iron-deficient profile versus the iron-excess profile. The 12 genes unique to the fumarate reduction profile (iron-sufficient profile versus iron-deficient profile) included those encoding 3 upregulated transposases (GSU0252, GSU0957, and GSU2180), 2 upregulated hypothetical proteins (GSU0930 to GSU0996), 2 downregulated hypothetical proteins (GSU1339 and GSU3141), a downregulated GroEL chaperone (GSU3340), a downregulated ABC transporter (GSU1340), an upregulated RelA domain protein (GSU2442), a downregulated DAHP synthase (GSU3141), and a downregulated undecaprenyl diphosphate synthase (GSU1917). None of these genes had obvious ties to iron metabolism, except for RelA potentially being involved in the stringent response due to iron limitation.
Identification of genes within the Fur regulon.
Because of Fur's importance in the regulation of iron homeostasis, involvement of Fur during Fe(III) reduction was investigated using mutant studies to determine if Fur couples Fe(II) generation to Fe(II) usage at the transcriptional level.
Transcriptome analysis was performed with wild-type G. sulfurreducens and a Δfur strain to elucidate potential Fur-dependent regulation. Because of the absence of the Fur protein in the mutant, regulatory effects typically induced by Fur should be alleviated. Gene expression profiles of the wild type and the Δfur strain grown under iron-sufficient conditions were compared, resulting in the identification of 64 differentially expressed genes (see Table SA3 in the supplemental material). Although Fur is generally thought to act as a repressor, gene expression was predominantly found to be downregulated (53 of 64 genes) in the mutant compared to the wild type. Significantly downregulated genes that were directly related to iron metabolism included those encoding a metal efflux pump (GSU2134, GSU2136, and GSU2137) and FeoAB (GSU1380, GSU3268, and GSU3270). FeoAB is known to be Fur regulated in a variety of microbes (35–37). Although Fur has been reported to act as an antirepressor as well as an activator (38, 39), we would generally expect to see an increase in expression of these genes in the Δfur strain as a reflection of the alleviation of Fur downregulation. Because we do not see this, a different iron-regulatory mechanism may also be active to compensate for the absence of Fur.
The remaining downregulated genes within this expression profile were those encoding proteins involved in pyrimidine synthesis, biotin synthesis, and energy metabolism. Although these genes were found to span a diverse range of function, the majority of the genes either encoded proteins with heme groups or iron-sulfur clusters or were involved in a pathway in which other proteins required iron. Upregulated genes included those encoding a vitamin B12 binding radical S-adenosylmethionine (SAM) domain (GSU0548), a glutamate synthase (GSU1235 and GSU1239), a glutamine amidotransferase (GSU1236), a rhodanese-related sulfurtransferase (GSU2940), a 5-heme cytochrome (GSU2937), and an ATPase (GSU2480 and GSU2481).
To identify iron-dependent genes whose expression does not directly depend on Fur, expression profiles of the Δfur mutant grown under iron-deficient and iron-sufficient conditions were compared. Only five genes were significantly differentially expressed (see Table SA4 in the supplemental material). Downregulated genes included those encoding Fe(III) reductase (GSU0510), a resistance-nodulation-cell division (RND) family efflux pump (GSU2664 and GSU2665), and a glutamate synthase (GSU1239). A putative membrane protein (GSU1853) was the only upregulated gene product. Despite the apparent ties to iron, particularly in the case of Fe(III) reductase, these genes are likely not regulated by Fur. Further studies are required to reveal which regulons these genes fall into.
Genome-scale identification of Fur binding events.
To further identify direct and indirect Fur regulation, Fur binding sites across the G. sulfurreducens genome were identified by microarray-coupled chromatin immunoprecipitation (ChIP-chip). Wild-type G. sulfurreducens was grown under iron-deficient and iron-sufficient conditions, with the Δfur mutant (under the iron-sufficient condition) serving as a control (Fig. 2A). In total, 144 Fur binding sites were identified, encompassing 625 genes. No binding peaks were identified in experiments with wild-type cells grown under iron-deficient conditions or the control with the Δfur strain, confirming the iron dependency of Fur binding in G. sulfurreducens.
FIG 2.

Identification of the Fur regulon using ChIP-chip and gene expression data. (A) Genome-wide Fur binding across three different conditions using ChIP-chip. (B) Example of the integration of ChIP-chip and gene expression profiles to further define the Fur regulon. (C) The Fur binding motif, as identified by the MEME algorithm from ChIP peaks derived from G. sulfurreducens cultured under the iron-sufficient condition. (D) Overlap between the ChIP-chip and iron-deficient versus iron-sufficient gene expression profiles.
A characteristic 15-bp palindromic Fur binding motif was identified in each of the 144 unique binding peaks with an E value of 10−78 (Fig. 2C). After the Fur motif for G. sulfurreducens was determined, the entire genome was scanned for additional motifs, yielding a total of 3,635 potential Fur binding sites. To identify if multiple Fur motifs were present within the experimentally determined Fur binding sites, this output was then filtered by the ChIP-chip data set, yielding 462 locations with this motif. Due to the palindromic nature of the motif, this corresponded to 231 unique Fur motifs.
The gene expression profile data from the iron-deficient, iron-sufficient, and iron-excess experiments were used in conjunction with the ChIP-chip data set to further curate the Fur regulon (Fig. 2B). Only 113 genes from the ChIP profile (22 binding peaks) exhibited a change in expression in at least one of the differential gene expression data sets, suggesting that Fur may play a direct role in regulating the expression of these genes (Fig. 2D; see also Table SA5 in the supplemental material). qPCR was performed on GSU1106 (citrate synthase), GSU1465 (isocitrate dehydrogenase), and GSU2076 (omcZ) in both the wild type and the Δfur strain to confirm differential expression of these genes with respect to iron concentration across the three conditions. With RpoD used as the reference gene product, the wild type consistently exhibited 1- to 4-fold-higher expression than the Δfur strain under the iron-deficient and iron-sufficient conditions, except for omcZ under the iron-deficient condition, further implicating Fur in the regulation of these genes. All three genes were the most expressed under the iron-excess condition, suggesting that Fur can also act as an activator for these genes.
The 113 genes associated with a Fur binding site were categorized by function into 16 distinct clusters (see Table SA6 in the supplemental material). Most genes fell in the categories of those encoding energy metabolism proteins (36 genes) and transport and binding proteins (13 genes), with hypergeometric test P values of 10−11 and 0.0129, respectively. Similar results were obtained when the data were normalized based on the overall percentage of genes per category, with genes related to energy metabolism accounting for 9% and genes for transport and binding proteins accounting for 6%.
Twelve Fur-controlled genes were significantly downregulated with increasing iron concentrations under all three iron conditions (Table 1; Fig. 1C). The promoter region of each of these 12 genes contained at least two Fur motifs, with some containing up to 14 motifs. FeoAB (GSU3270 and GSU3268) and GSU3274, a 1-heme c-type cytochrome, were each affiliated with a 14-motif Fur binding site. The presence of multiple binding sites suggests that Fur can tune repression in response to external iron concentrations by allowing multiple Fur dimers to simultaneously bind to the promoter region. The expression data for these genes support this hypothesis, with all genes displaying the highest fold changes of expression under iron-excess versus iron-deficient conditions, the comparison with the largest change in external Fe(II) concentration (Fig. 1C).
TABLE 1.
Fur-controlled genes with fold change > 8 in at least one gene expression profile
| Main role (no. of genes) | Gene | Gene name | Gene product | Number of Fur motifs | Iron sufficient vs iron excess fold change | Iron deficient vs iron sufficient fold change | Iron deficient vs iron excess fold change |
|---|---|---|---|---|---|---|---|
| Cell envelope (3) | GSU0832 | Lipoprotein, putative | 4 | 1.03 | 21.61 | 22.32 | |
| GSU2133 | Lipoprotein, putative | 2 | 1.28 | 18.44 | 23.58 | ||
| GSU2940 | Rhodanese-related sulfurtransferase | 4 | −1.59 | −9.05 | −14.41 | ||
| Cellular processes (6) | GSU0828 | Efflux pump, RND family, outer membrane protein | 4 | 1.00 | 16.73 | 16.78 | |
| GSU0829 | Efflux pump, RND family, membrane fusion protein | 4 | 1.02 | 20.31 | 20.80 | ||
| GSU0830 | Efflux pump, RND family, inner membrane protein | 4 | −1.01 | 17.33 | 17.18 | ||
| GSU2135 | Heavy metal efflux pump, RND family, inner membrane protein, CzcA family | 2 | 1.13 | 30.83 | 34.96 | ||
| GSU2136 | Efflux pump, RND family, membrane fusion protein | 2 | 1.12 | 33.75 | 37.94 | ||
| GSU2137 | Metal ion efflux pump, RND family, outer membrane protein, CzcC family | 2 | 1.23 | 32.10 | 39.39 | ||
| Central intermediary metabolism (2) | GSU1716 | cysH | Phosphoadenosine phosphosulfate reductase, putative | 4 | 1.02 | 15.53 | 15.84 |
| GSU1717 | cysD | Sulfate adenylyltransferase, subunit 2 | 4 | −1.03 | 23.45 | 22.66 | |
| DNA metabolism (1) | GSU3266 | uvrD | UvrD/REP helicase | 14 | 5.25 | 3.19 | 16.73 |
| Energy metabolism (8) | GSU0782 | hybS | Periplasmically oriented, membrane-bound [NiFe]-hydrogenase small subunit | 4 | 57.40 | −6.89 | 8.33 |
| GSU0783 | hybA | Periplasmically oriented, membrane-bound [NiFe]-hydrogenase iron-sulfur cluster binding subunit | 4 | 51.48 | −5.81 | 8.86 | |
| GSU0784 | hybB | Periplasmically oriented, membrane-bound [NiFe]-hydrogenase integral membrane subunit | 4 | 34.90 | −5.21 | 6.69 | |
| GSU0785 | hybL | Periplasmically oriented, membrane-bound [NiFe]-hydrogenase large subunit | 4 | 52.47 | −5.54 | 9.47 | |
| GSU1108 | Aldehyde dehydrogenase family protein | 2 | −4.67 | −1.94 | −9.08 | ||
| GSU1467 | 2-Oxoglutarate:ferredoxin oxidoreductase, ferredoxin subunit | 2 | −2.04 | −4.38 | −8.92 | ||
| GSU2076 | omcZ | Cytochrome c, 7–8 heme-binding sites | 2 | −2.20 | −6.41 | −14.14 | |
| GSU2937 | Cytochrome c, 5 heme-binding sites | 4 | −1.71 | −8.70 | −14.91 | ||
| GSU3274 | Cytochrome c, 1 heme-binding site | 14 | 34.07 | 5.43 | 184.99 | ||
| Protein fate (4) | GSU0786 | hybP | Periplasmically oriented, membrane-bound [NiFe]-hydrogenase maturation protease | 4 | 43.83 | −5.26 | 8.34 |
| GSU0787 | Twin-arginine translocation protein, TatA/E family | 4 | 28.68 | −5.07 | 5.66 | ||
| GSU2075 | Serine protease, subtilase family | 2 | −3.65 | −3.26 | −11.91 | ||
| GSU2678 | ATP-independent chaperone, alpha-crystallin/Hsp20 family | 2 | 7.69 | 11.29 | 86.75 | ||
| Regulatory functions (4) | GSU1379 | fur | Ferric uptake regulation protein Fur | 6 | 3.86 | 3.48 | 13.42 |
| GSU0831 | Nitrogen regulatory protein P-II, putative | 4 | 1.02 | 21.26 | 21.63 | ||
| GSU1382 | ideR | Iron/manganese-dependent transcriptional regulator | 6 | 10.16 | 4.40 | 44.67 | |
| GSU2134 | Nitrogen regulatory protein P-II, putative | 2 | 1.29 | 24.44 | 31.49 | ||
| Transport and binding proteins (5) | GSU1380 | feoB-1 | Ferrous iron transport protein B | 6 | 10.87 | 4.47 | 48.61 |
| GSU2939 | Putative porin | 4 | −1.56 | −8.79 | −13.68 | ||
| GSU3268 | feoB-2 | Ferrous iron transport protein B, putative | 14 | 43.42 | 5.38 | 233.83 | |
| GSU3269 | Pseudogene | 14 | 55.69 | 4.43 | 246.88 | ||
| GSU3270 | FeoA family protein | 14 | 31.36 | 7.51 | 235.65 | ||
| Unknown (13) | GSU0788 | Conserved hypothetical protein | 4 | 17.55 | −4.25 | 4.12 | |
| GSU1381 | Conserved hypothetical protein | 6 | 10.16 | 4.21 | 42.74 | ||
| GSU1718 | cysN | Sulfate adenylyltransferase, subunit 1 | 4 | 1.01 | 18.95 | 19.06 | |
| GSU2073 | EF hand domain/PKD domain protein | 2 | −3.94 | −2.28 | −8.98 | ||
| GSU2074 | PPIC-type PPIASE domain protein | 2 | −3.00 | −3.05 | −9.14 | ||
| GSU2131 | Conserved hypothetical protein | 2 | 1.24 | 9.32 | 11.58 | ||
| GSU2132 | Hypothetical protein | 2 | 1.28 | 16.15 | 20.66 | ||
| GSU2936 | Conserved hypothetical protein | 4 | −1.28 | −9.59 | −12.31 | ||
| GSU3267 | Conserved hypothetical protein | 4 | 26.25 | 4.19 | 110.04 | ||
| GSU3271 | Carbohydrate-selective porin OprB | 4 | 84.35 | 3.17 | 267.75 | ||
| GSU3272 | Hypothetical protein | 4 | 44.42 | 4.99 | 221.50 | ||
| GSU3273 | Conserved hypothetical protein | 4 | 34.25 | 5.44 | 186.35 |
Investigation of IdeR, a potential coregulator.
Because of the importance of iron in the physiology of G. sulfurreducens and the unexpected results from the Δfur gene expression comparison, alternate iron regulators were investigated. IdeR, a DtxR homolog known to regulate iron uptake and some oxidative-stress genes in Mycobacterium tuberculosis, is also present in G. sulfurreducens and may provide regulatory redundancy in the absence of Fur (40). Thus, additional physiological and genetic experiments were performed with Δfur, ΔideR, and Δfur ΔideR mutants to identify interactions and potential regulatory overlap between the two iron regulators. Under the iron-sufficient condition (fumarate reduction medium), the Δfur mutant grew at a much lower rate than the wild type (Fig. 3). The Δfur mutant was also more sensitive to the addition of Fe(II) to the growth medium than the wild-type strain. Its phenotype exhibited lower growth rates and extended lag times when the strain was transferred to medium containing trace, 100 μM, or 1 mM Fe(II), with increasing Fe(II) concentrations negatively impacting the growth rate (Fig. 3). The same phenomenon was observed for the ΔideR mutant cultured with various Fe(II) concentrations (Fig. 3). It is of note that the growth curves of the Δfur ΔideR mutant were indistinguishable from those of the ΔideR mutant.
FIG 3.

Effect of Fe(II) on growth of wild-type and mutant strains of G. sulfurreducens. Wild-type (◼), Δfur (◻, left column), ΔideR (Δ, right column), and Δfur ΔideR (▲, right column) strains were transferred into media containing 3 μM Fe(II) (A), 100 μM Fe(II) (B), or 1 mM Fe(II) (C). Optical density was measured at a wavelength of 600 nm over time. The data are the means of the results of quadruplicate incubations.
To investigate potential transcriptional overlaps between IdeR and Fur, transcription of IdeR, Fur, and the Fur-controlled gene encoding FeoB was monitored in both the wild type and the Δfur mutant during growth in the presence of 0.1 μM, 100 μM, and 1 mM Fe(II). In the wild type, IdeR and Fur expression displayed partial repression as the Fe(II) concentration increased. qPCR analysis revealed that transcription of IdeR was 50-fold higher in the Δfur mutant than in the wild type when cells were grown in the presence of 1 mM Fe(II), indicating that IdeR is upregulated in the absence of Fur. Similarly, expression of FeoB was completely repressed in the wild type in the presence of Fe(II) but only partially repressed in the Δfur mutant, indicating that Fur is not the sole transcriptional regulator influencing repression. Although either Fur or DtxR homologs typically regulate intracellular iron homeostasis, these results suggest that they may be providing simultaneous regulation of iron homeostasis in G. sulfurreducens.
DISCUSSION
Iron uptake and homeostasis in bacteria are tightly regulated in order to ensure that the cell obtains enough iron for the maintenance of protein functionality without inducing oxidative stress or exceeding iron storage limitations (41, 42). In iron-reducing microorganisms, such as Geobacter, iron fulfils an additional role in energy metabolism by acting as a terminal electron acceptor for anaerobic respiration. Reduction of insoluble Fe(III) to soluble and thus accessible Fe(II) suggests the necessity of an even more intricate iron regulation system due to the inherent cross talk in the intertwining balance of energy metabolism and the cellular iron requirement. To address this, we have used a combination of methods to gain a genome-wide perspective on the iron stimulon and Fur regulon in G. sulfurreducens.
The iron stimulon identified in this study represents a larger breadth of cellular function than initially anticipated, with several genes being directly involved in central metabolism and iron reduction. After these genes were categorized, the majority of gene products were found to be directly involved in iron utilization; gene products often contained multiple heme binding sites, employed high-iron-containing proteins, or facilitated intracellular iron storage. The genes encoding both FeoA (GSU3270) and FeoB (GSU1380 and GSU3268) iron transporters in G. sulfurreducens, as well as 11 genes encoding components for heavy metal efflux pumps, were found to be upregulated with decreasing iron concentrations. Twenty-four different c-type cytochromes were differentially expressed in at least one profile, and the majority of these cytochromes, especially those containing more than eight heme binding sites, appeared to be slightly downregulated with decreasing iron levels (see Table SA1 in the supplemental material). Only one cytochrome (GSU3274) was highly differentially expressed across all iron conditions. Unlike other cytochromes, GSU3274 contains only one heme binding cluster. Its expression levels increased with decreasing iron concentrations, implying that the expression of this specific c-type cytochrome is directly related to the iron concentration. Thus, it is possible that as iron becomes limiting, genes encoding multiple-heme-containing cytochromes are downregulated whereas cytochromes containing fewer heme residues, such as GSU3274, are upregulated in order to meet the demand for electron transport needs despite the lack of iron. Furthermore, the multiheme cytochromes may be required for Fe(III) respiration and are thus downregulated during fumarate reduction.
Our ChIP analysis showed that many of the genes within the iron stimulon are regulated by Fur. As determined by the Δfur mutant study, Fur directly regulates the expression of FeoAB, several cytochromes (GSU2432, GSU2937, and GSU3274), and the previously mentioned efflux pumps. Transcription factors, including IdeR (GSU1382) and a putative transcription factor (GSU1639), were also regulated by Fur. The role of Fur has been investigated in the iron-reducing gammaproteobacterium Shewanella oneidensis (31, 35). The Fur regulon of Shewanella oneidensis includes a number of sigma and transcription factors such as σD and LysR (37). In G. sulfurreducens, IdeR is the most notable alternative transcription factor under Fur control, as IdeR is known to also regulate iron homeostasis. It is possible that many more of the genes within the Fur regulon are coregulated by IdeR. In H. pylori, for example, Fur and the nickel-responsive regulator NikR have been found to coordinate the regulation of several genes via overlapping binding motifs within the promoters (50). Additional experiments, in particular, IdeR-based ChIP experiments, are required to determine the extent of cooperation between IdeR and Fur in G. sulfurreducens. Cooperative regulation by the two iron-dependent regulators may explain the low, differential expression of the Fur gene itself compared to the majority of other genes controlled by Fur. Furthermore, the presence of two iron-dependent repressors may enable G. sulfurreducens to thrive in environments containing high concentrations of both Fe(III) and Fe(II) by providing it with tighter control over intracellular iron homeostasis. The regulatory network of other repressors may be intertwining with Fur to create a more robust iron response.
Fur may also be involved in regulating genes of central metabolism in G. sulfurreducens, primarily those associated with the tricarboxylic acid (TCA) cycle. Citrate synthase (encoded by GSU1106), isocitrate dehydrogenase (GSU1465), 2-oxoglutarate oxidoreductase (GSU1467, GSU1468, GSU1469, and GSU1470), malate dehydrogenase (GSU1466), NADH dehydrogenase (GSU0346, GSU0347, GSU0348, GSU0349, GSU0350, and GSU0351), and OmcZ (GSU2076) are part of both the iron stimulon and Fur regulon (Fig. 4). OmcZ, in particular, is a cytochrome that has been found to be required for electron transfer to both Fe(III) and electrodes (30). Other genes that assist in the generation of electrons for Fe(III) reduction, including those encoding succinate dehydrogenase (GSU1177), aconitate hydratase (GSU1660), fumarate hydratase (GSU0994), and formate dehydrogenase (GSU0777, GSU0778, GSU079, and GSU0780), all exhibited higher expression levels as the external iron concentration increased but were not found to be Fur regulated (Fig. 4).
FIG 4.
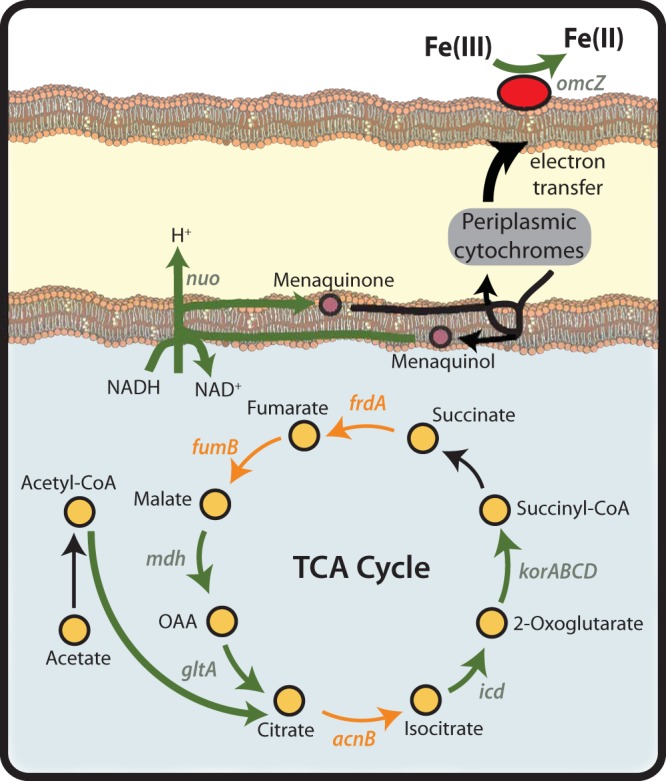
Essential TCA cycle- and respiration-related genes are part of both the iron stimulon and Fur regulon. Genes that are only part of the iron stimulon are highlighted in orange. These include aconitate hydratase (GSU1660; acnB), fumarate reductase (GSU1177; frdA), and fumarate hydratase (GSU0994; fumB). Genes that are part of both the iron stimulon and Fur regulon are highlighted in green. These include citrate synthase (GSU1106; gltA), isocitrate dehydrogenase (GSU1465; icd), 2-oxoglutarate synthase (GSU1467-GSU1470; korABCD), malate dehydrogenase (GSU1466), and omcZ (GSU2076). OmcZ, in particular, is a cytochrome required for electron transfer to both Fe(III) and electrodes. A total of 14 NADH dehydrogenase subunits (nuoA to nuoN) are regulated by Fur and are denoted here by the abbreviation “nuo.” CoA, coenzyme A; OAA; oxaloacetate.
Although experimentally determined Fur binding sites were observed in the promoter regions of many operons (see Table SA5), the genes were not all differentially expressed in the Δfur mutant. It is possible that IdeR is compensating for the absence of Fur because of the importance of these genes in metabolism. Most notably, Fur may be involved in the regulation of the initial enzymes of acetate oxidation and the final steps of Fe(III) reduction, suggesting that Fur plays a role in adjusting metabolism and electron flow of the cell depending on external Fe(III) availability. Many organisms, including E. coli, Campylobacter jejuni, Vibrio cholerae, and Vibrio vulnificus, have been shown to utilize Fur to positively regulate gene expression with increasing iron concentrations (19, 43–45). TCA cycle enzymes in E. coli and V. cholerae have been shown to be regulated by Fur, but compared to G. sulfurreducens, these enzymes were limited to proteins containing iron-sulfur clusters such as succinate dehydrogenase or aconitase (44).
The Fur regulon in G. sulfurreducens extends beyond control of iron transport and iron reduction processes and into global regulation by controlling the expression of a number of proteins involved in signaling cascades and other transcription factors. As in many other bacteria, Fur in G. sulfurreducens negatively regulates its own expression with increasing iron concentrations (31, 35). However, unlike other bacteria, Fur was not found to regulate small RNAs such as RyhB (46–48). Fur may also play an indirect role in regulating the nitrogen response in G. sulfurreducens by controlling the nitrogen-regulatory P-II protein (GSU2134). Expression of P-II increased with decreasing iron concentrations. P-II signaling plays a critical role in propagating intracellular nitrogen conditions for nitrogen fixation-related genes, including genes encoding the nitrogenase (49). As a protein involved in one of the first steps in the nitrogen signaling cascade, Fur may play a role in linking nitrogen fixation to iron availability within the cell.
Overall, the Fur regulon, possibly in conjunction with IdeR, allows G. sulfurreducens to thrive in environments with fluctuating iron concentrations by providing it with a more deliberate, robust, and controlled iron response.
Supplementary Material
ACKNOWLEDGMENTS
We thank Rohini Patel and Dongyeon Kim for their technical support.
This work was supported by the Office of Science (BER), U.S. Department of Energy, grants DE-FC02-02ER63446 and DE-SC0004485.
Footnotes
Published ahead of print 28 February 2014
Supplemental material for this article may be found at http://dx.doi.org/10.1128/AEM.03916-13.
REFERENCES
- 1.Escolar L, Perez-Martin J, de Lorenzo V. 1999. Opening the iron box: transcriptional metalloregulation by the Fur protein. J. Bacteriol. 181:6223–6229 [DOI] [PMC free article] [PubMed] [Google Scholar]
- 2.Caccavo F, Jr, Lonergan DJ, Lovley DR, Davis M, Stolz JF, McInerney MJ. 1994. Geobacter sulfurreducens sp. nov., a hydrogen- and acetate-oxidizing dissimilatory metal-reducing microorganism. Appl. Environ. Microbiol. 60:3752–3759 [DOI] [PMC free article] [PubMed] [Google Scholar]
- 3.Lovley DR, Giovannoni SJ, White DC, Champine JE, Phillips EJP, Gorby YA, Goodwin S. 1993. Geobacter metallireducens gen. nov. sp. nov., a microorganism capable of coupling the complete oxidation of organic compounds to the reduction of iron and other metals. Arch. Microbiol. 159:336–344. 10.1007/BF00290916 [DOI] [PubMed] [Google Scholar]
- 4.Malvankar NS, Vargas M, Nevin KP, Franks AE, Leang C, Kim B-C, Inoue K, Mester T, Covalla SF, Johnson JP, Rotello VM, Tuominen MT, Lovley DR. 2011. Tunable metallic-like conductivity in microbial nanowire networks. Nat. Nanotechnol. 6:573–579. 10.1038/nnano.2011.119 [DOI] [PubMed] [Google Scholar]
- 5.Lovley DR. 1991. Dissimilatory Fe(III) and Mn(IV) reduction. Microbiol. Rev. 55:259–287 [DOI] [PMC free article] [PubMed] [Google Scholar]
- 6.Bell PE, Mills AL, Herman JS. 1987. Biogeochemical conditions favoring magnetite formation during anaerobic iron reduction. Appl. Environ. Microbiol. 53:2610–2616 [DOI] [PMC free article] [PubMed] [Google Scholar]
- 7.De Lorenzo V, Herrero M, Giovannini F, Neilands JB. 1988. Fur (ferric uptake regulation) protein and CAP (catabolite-activator protein) modulate transcription of Fur gene in Escherichia coli. Eur. J. Biochem. 173:537–546. 10.1111/j.1432-1033.1988.tb14032.x [DOI] [PubMed] [Google Scholar]
- 8.Danielli A, Roncarati D, Delany I, Chiarini V, Rappuoli R, Scarlato V. 2006. In vivo dissection of the Helicobacter pylori Fur regulatory circuit by genome-wide location analysis. J. Bacteriol. 188:4654–4662. 10.1128/JB.00120-06 [DOI] [PMC free article] [PubMed] [Google Scholar]
- 9.Jackson LA, Ducey TF, Day MW, Zaitshik JB, Orvis J, Dyer DW. 2010. Transcriptional and functional analysis of the Neisseria gonorrhoeae Fur regulon. J. Bacteriol. 192:77–85. 10.1128/JB.00741-09 [DOI] [PMC free article] [PubMed] [Google Scholar]
- 10.Ollinger J, Song K-B, Antelmann H, Hecker M, Helmann JD. 2006. Role of the fur regulon in iron transport in Bacillus subtilis. J. Bacteriol. 188:3664–3673. 10.1128/JB.188.10.3664-3673.2006 [DOI] [PMC free article] [PubMed] [Google Scholar]
- 11.Stojiljkovic I, Bäumler AJ, Hantke K. 1994. Fur regulon in gram-negative bacteria: identification and characterization of new iron-regulated Escherichia coli genes by a Fur titration assay. J. Mol. Biol. 236:531–545. 10.1006/jmbi.1994.1163 [DOI] [PubMed] [Google Scholar]
- 12.Lavrrar JL, McIntosh MA. 2003. Architecture of a Fur binding site: a comparative analysis. J. Bacteriol. 185:2194–2202. 10.1128/JB.185.7.2194-2202.2003 [DOI] [PMC free article] [PubMed] [Google Scholar]
- 13.Coppi MV, Leang C, Sandler SJ, Lovley DR. 2001. Development of a genetic system for Geobacter sulfurreducens. Appl. Environ. Microbiol. 67:3180–3187. 10.1128/AEM.67.7.3180-3187.2001 [DOI] [PMC free article] [PubMed] [Google Scholar]
- 14.Lloyd JR, Leang C, Hodges Myerson AL, Coppi MV, Cuifo S, Methe B, Sandler SJ, Lovley DR. 2003. Biochemical and genetic characterization of PpcA, a periplasmic c-type cytochrome in Geobacter sulfurreducens. Biochem. J. 369:153–161. 10.1042/BJ20020597 [DOI] [PMC free article] [PubMed] [Google Scholar]
- 15.Lovley DR, Phillips EJP. 1987. Rapid assay for microbially reducible ferric iron in aquatic sediments. Appl. Environ. Microbiol. 53:1536–1540 [DOI] [PMC free article] [PubMed] [Google Scholar]
- 16.Cho B-K, Knight EM, Barrett CL, Palsson BØ. 2008. Genome-wide analysis of Fis binding in Escherichia coli indicates a causative role for A-/AT-tracts. Genome Res. 18:900–910. 10.1101/gr.070276.107 [DOI] [PMC free article] [PubMed] [Google Scholar]
- 17.Cho B-K, Knight EM, Palsson BØ. 2008. Genomewide identification of protein binding locations using chromatin immunoprecipitation coupled with microarray. Methods Mol. Biol. 439:131–145. 10.1007/978-1-59745-188-8_9 [DOI] [PubMed] [Google Scholar]
- 18.Cho B-K, Zengler K, Qiu Y, Park YS, Knight EM, Barrett CL, Gao Y, Palsson BO. 2009. The transcription unit architecture of the Escherichia coli genome. Nat. Biotechnol. 27:1043–1049. 10.1038/nbt.1582 [DOI] [PMC free article] [PubMed] [Google Scholar]
- 19.Mao F, Dam P, Chou J, Olman V, Xu Y. 2009. DOOR: a database for prokaryotic operons. Nucleic Acids Res. 37:D459–D463. 10.1093/nar/gkn757 [DOI] [PMC free article] [PubMed] [Google Scholar]
- 20.Bailey TL, Boden M, Buske FA, Frith M, Grant CE, Clementi L, Ren J, Li WW, Noble WS. 2009. MEME Suite: tools for motif discovery and searching. Nucleic Acids Res. 37:W202–W208. 10.1093/nar/gkp335 [DOI] [PMC free article] [PubMed] [Google Scholar]
- 21.Grant CE, Bailey TL, Noble WS. 16 February 2011. FIMO: scanning for occurrences of a given motif. Bioinformatics 10.1093/bioinformatics/btr064 [DOI] [PMC free article] [PubMed] [Google Scholar]
- 22.Gupta S, Stamatoyannopoulos J, Bailey T, Noble W. 2007. Quantifying similarity between motifs. Genome Biol. 8:R24. 10.1186/gb-2007-8-2-r24 [DOI] [PMC free article] [PubMed] [Google Scholar]
- 23.Irizarry RA, Hobbs B, Collin F, Beazer-Barclay YD, Antonellis KJ, Scherf U, Speed TP. 2003. Exploration, normalization, and summaries of high density oligonucleotide array probe level data. Biostatistics 4:249–264. 10.1093/biostatistics/4.2.249 [DOI] [PubMed] [Google Scholar]
- 24.Parkhomchuk D, Borodina T, Amstislavskiy V, Banaru M, Hallen L, Krobitsch S, Lehrach H, Soldatov A. 2009. Transcriptome analysis by strand-specific sequencing of complementary DNA. Nucleic Acids Res. 37:e123. 10.1093/nar/gkp596 [DOI] [PMC free article] [PubMed] [Google Scholar]
- 25.Zhong S, Joung J-G, Zheng Y, Chen Y-r, Liu B, Shao Y, Xiang JZ, Fei Z, Giovannoni JJ. 2011. High-throughput Illumina strand-specific RNA sequencing library preparation. Cold Spring Harb. Protoc. 2011:940–949. 10.1101/pdb.prot5652 [DOI] [PubMed] [Google Scholar]
- 26.Levin JZ, Yassour M, Adiconis X, Nusbaum C, Thompson DA, Friedman N, Gnirke A, Regev A. 2010. Comprehensive comparative analysis of strand-specific RNA sequencing methods. Nat. Methods 7:709–715. 10.1038/nmeth.1491 [DOI] [PMC free article] [PubMed] [Google Scholar]
- 27.Langmead B, Trapnell C, Pop M, Salzberg S. 2009. Ultrafast and memory-efficient alignment of short DNA sequences to the human genome. Genome Biol. 10:R25. 10.1186/gb-2009-10-3-r25 [DOI] [PMC free article] [PubMed] [Google Scholar]
- 28.Trapnell C, Williams BA, Pertea G, Mortazavi A, Kwan G, van Baren MJ, Salzberg SL, Wold BJ, Pachter L. 2010. Transcript assembly and quantification by RNA-Seq reveals unannotated transcripts and isoform switching during cell differentiation. Nat. Biotechnol. 28:511–515. 10.1038/nbt.1621 [DOI] [PMC free article] [PubMed] [Google Scholar]
- 29.Qiu Y, Cho BK, Park YS, Lovley D, Palsson BØ, Zengler K. 2010. Structural and operational complexity of the Geobacter sulfurreducens genome. Genome Res. 20:1304–1311. 10.1101/gr.107540.110 [DOI] [PMC free article] [PubMed] [Google Scholar]
- 30.Inoue K, Qian X, Morgado L, Kim B-C, Mester T, Izallalen M, Salgueiro CA, Lovley DR. 2010. Purification and characterization of OmcZ, an outer-surface, octaheme c-type cytochrome essential for optimal current production by Geobacter sulfurreducens. Appl. Environ. Microbiol. 76:3999–4007. 10.1128/AEM.00027-10 [DOI] [PMC free article] [PubMed] [Google Scholar]
- 31.Yang Y, Harris D, Luo F, Wu L, Parsons A, Palumbo A, Zhou J. 2008. Characterization of the Shewanella oneidensis Fur gene: roles in iron and acid tolerance response. BMC Genomics 9(Suppl 1):S11. 10.1186/1471-2164-9-S1-S11 [DOI] [PMC free article] [PubMed] [Google Scholar]
- 32.Butcher BG, Bronstein PA, Myers CR, Stodghill PV, Bolton JJ, Markel EJ, Filiatrault MJ, Swingle B, Gaballa A, Helmann JD, Schneider DJ, Cartinhour SW. 2011. Characterization of the Fur regulon in Pseudomonas syringae pv. tomato DC3000. J. Bacteriol. 193:4598–4611. 10.1128/JB.00340-11 [DOI] [PMC free article] [PubMed] [Google Scholar]
- 33.Cartron M, Maddocks S, Gillingham P, Craven C, Andrews S. 2006. Feo – transport of ferrous iron into bacteria. Biometals 19:143–157. 10.1007/s10534-006-0003-2 [DOI] [PubMed] [Google Scholar]
- 34.Hantke K. 2001. Iron and metal regulation in bacteria. Curr. Opin. Microbiol. 4:172–177. 10.1016/S1369-5274(00)00184-3 [DOI] [PubMed] [Google Scholar]
- 35.Bender KS, Yen H-CB, Hemme CL, Yang Z, He Z, He Q, Zhou J, Huang KH, Alm EJ, Hazen TC, Arkin AP, Wall JD. 2007. Analysis of a ferric uptake regulator (Fur) mutant of Desulfovibrio vulgaris Hildenborough. Appl. Environ. Microbiol. 73:5389–5400. 10.1128/AEM.00276-07 [DOI] [PMC free article] [PubMed] [Google Scholar]
- 36.Ledala N, Sengupta M, Muthaiyan A, Wilkinson BJ, Jayaswal RK. 2010. Transcriptomic response of Listeria monocytogenes to iron limitation and fur mutation. Appl. Environ. Microbiol. 76:406–416. 10.1128/AEM.01389-09 [DOI] [PMC free article] [PubMed] [Google Scholar]
- 37.Wan X-F, VerBerkmoes NC, McCue LA, Stanek D, Connelly H, Hauser LJ, Wu L, Liu X, Yan T, Leaphart A, Hettich RL, Zhou J, Thompson DK. 2004. Transcriptomic and proteomic characterization of the Fur modulon in the metal-reducing bacterium Shewanella oneidensis. J. Bacteriol. 186:8385–8400. 10.1128/JB.186.24.8385-8400.2004 [DOI] [PMC free article] [PubMed] [Google Scholar]
- 38.Nandal A, Huggins CCO, Woodhall MR, McHugh J, Rodríguez-Quiñones F, Quail MA, Guest JR, Andrews SC. 2010. Induction of the ferritin gene (ftnA) of Escherichia coli by Fe2+–Fur is mediated by reversal of H-NS silencing and is RyhB independent. Mol. Microbiol. 75:637–657. 10.1111/j.1365-2958.2009.06977.x [DOI] [PubMed] [Google Scholar]
- 39.Delany I, Rappuoli R, Scarlato V. 2004. Fur functions as an activator and as a repressor of putative virulence genes in Neisseria meningitidis. Mol. Microbiol. 52:1081–1090. 10.1111/j.1365-2958.2004.04030.x [DOI] [PubMed] [Google Scholar]
- 40.Rodriguez GM, Voskuil MI, Gold B, Schoolnik GK, Smith I. 2002. IdeR, an essential gene in Mycobacterium tuberculosis: role of IdeR in iron-dependent gene expression, iron metabolism, and oxidative stress response. Infect. Immun. 70:3371–3381. 10.1128/IAI.70.7.3371-3381.2002 [DOI] [PMC free article] [PubMed] [Google Scholar]
- 41.Andrews SC, Robinson AK, Rodríguez-Quiñones F. 2003. Bacterial iron homeostasis. FEMS Microbiol. Rev. 27:215–237. 10.1016/S0168-6445(03)00055-X [DOI] [PubMed] [Google Scholar]
- 42.Touati D. 2000. Iron and oxidative stress in bacteria. Arch. Biochem. Biophys. 373:1–6. 10.1006/abbi.1999.1518 [DOI] [PubMed] [Google Scholar]
- 43.Dubrac S, Touati D. 2000. Fur positive regulation of iron superoxide dismutase in Escherichia coli: functional analysis of the sodB promoter. J. Bacteriol. 182:3802–3808. 10.1128/JB.182.13.3802-3808.2000 [DOI] [PMC free article] [PubMed] [Google Scholar]
- 44.Mey AR, Wyckoff EE, Kanukurthy V, Fisher CR, Payne SM. 2005. Iron and Fur regulation in Vibrio cholerae and the role of Fur in virulence. Infect. Immun. 73:8167–8178. 10.1128/IAI.73.12.8167-8178.2005 [DOI] [PMC free article] [PubMed] [Google Scholar]
- 45.Lee H-J, Bang SH, Lee K-H, Park S-J. 2007. Positive regulation of Fur gene expression via direct interaction of Fur in a pathogenic bacterium, Vibrio vulnificus. J. Bacteriol. 189:2629–2636. 10.1128/JB.01791-06 [DOI] [PMC free article] [PubMed] [Google Scholar]
- 46.Massé E, Salvail H, Desnoyers G, Arguin M. 2007. Small RNAs controlling iron metabolism. Curr. Opin. Microbiol. 10:140–145. 10.1016/j.mib.2007.03.013 [DOI] [PubMed] [Google Scholar]
- 47.Africa LAA, Murphy ER, Egan NR, Wigley AF, Wing HJ. 2011. The Iron-responsive Fur/RyhB regulatory cascade modulates the Shigella outer membrane protease IcsP. Infect. Immun. 79:4543–4549. 10.1128/IAI.05340-11 [DOI] [PMC free article] [PubMed] [Google Scholar]
- 48.Massé E, Vanderpool CK, Gottesman S. 2005. Effect of RyhB small RNA on global iron use in Escherichia coli. J. Bacteriol. 187:6962–6971. 10.1128/JB.187.20.6962-6971.2005 [DOI] [PMC free article] [PubMed] [Google Scholar]
- 49.Methé BA, Webster J, Nevin K, Butler J, Lovley DR. 2005. DNA microarray analysis of nitrogen fixation and Fe(III) reduction in Geobacter sulfurreducens. Appl. Environ. Microbiol. 71:2530–2538. 10.1128/AEM.71.5.2530-2538.2005 [DOI] [PMC free article] [PubMed] [Google Scholar]
- 50.Delany I, Ieva R, Soragni A, Hilleringmann M, Rappuoli R, Scarlato V. 2005. In vitro analysis of protein-operator interactions of the NikR and Fur metal-responsive regulators of coregulated genes in Helicobacter pylori. J. Bacteriol. 187:7703–7715. 10.1128/JB.187.22.7703-7715.2005 [DOI] [PMC free article] [PubMed] [Google Scholar]
Associated Data
This section collects any data citations, data availability statements, or supplementary materials included in this article.