

Abstract
Pseudomonas aeruginosa is a common opportunistic human pathogen known for its ability to adapt to changes in its environment during the course of infection. These adaptations include changes in the expression of cell surface lipopolysaccharide (LPS), biofilm development, and the production of a protective extracellular exopolysaccharide matrix. Outer membrane vesicles (OMVs) have been identified as an important component of the extracellular matrix of P. aeruginosa biofilms and are thought to contribute to the development and fitness of these bacterial communities. The goal of this study was to examine the relationships between changes in the cell surface expression of LPS O polysaccharides, biofilm development, and OMV biogenesis in P. aeruginosa. We compared wild-type P. aeruginosa PAO1 with three chromosomal knockouts. These knockouts have deletions in the rmd, wbpM, and wbpL genes that produce changes in the expression of common polysaccharide antigen (CPA), O-specific antigen (OSA), or both. Our results demonstrate that changes in O polysaccharide expression do not significantly influence OMV production but do affect the size and protein content of OMVs derived from both CPA− and OSA− cells; these mutant cells also exhibited different physical properties from wild-type cells. We further examined biofilm growth of the mutants and determined that CPA− cells could not develop into robust biofilms and exhibit changes in cell morphology and biofilm matrix production. Together these results demonstrate the importance of O polysaccharide expression on P. aeruginosa OMV composition and highlight the significance of CPA expression in biofilm development.
INTRODUCTION
Outer membrane vesicles (OMVs) are extracellular blebs derived from the outer membrane (OM) of Gram-negative bacteria (1–4). They are spherical structures typically 20 to 250 nm in diameter (5) and contain periplasmic content in their lumen (6). OMVs have been implicated in many extracellular activities, including the secretion of degradative enzymes (7), the release of quorum-sensing molecules and virulence factors (8–10), and the transfer of genetic information (7, 11–13). In the opportunistic Gram-negative pathogen Pseudomonas aeruginosa, OMVs are associated with both planktonic and surface-associated biofilm communities, and their compositions and properties vary based on their mode of growth (14, 15). OMVs have also been identified as an important component of the extracellular matrix of P. aeruginosa biofilms and contribute a large portion of the protein content to this extracellular niche (15, 16).
As OMVs are derived from the OM of Gram-negative cells, lipopolysaccharide (LPS) is the primary component of their outer leaflet. LPS plays an important role in cellular survival, adaptation, and virulence, and its location in the OM makes it the first point of contact at both biotic and abiotic surfaces that the bacterium encounters. LPS molecules consist of three main components: the hydrophobic lipid A, a core oligosaccharide, and the distal O polysaccharides (17). Most P. aeruginosa strains produce two forms of O polysaccharide: the homopolymeric common polysaccharide antigen (CPA; formerly termed A band) and the heteropolymer O-specific antigen (OSA; formerly termed B band) (17, 18). OSA is the immunodominant cell surface antigen found in planktonically cultured P. aeruginosa PAO1 (19). CPA chains are generally shorter and less immunogenic than OSA chains, likely due to their neutral charge. Changes in the expression of CPA or OSA LPS directly influence surface characteristics and the ability of cells to bind to different substrates (20). When cultured as biofilms in vitro, the phenotype of P. aeruginosa PAO1 LPS shifts from CPA+ OSA+ to CPA+ OSA−, which is reversible when cells from the biofilm are recultured planktonically (21). The bias toward the shorter and less immunogenic CPA expression within biofilms is also observed in the LPS of P. aeruginosa clinical isolates derived from patients with cystic fibrosis (22, 23). This shift to CPA has been suggested to confer evasion of the host immune response and bacterial persistence in chronic infections (24). Additionally, CPA has been shown to be important for attachment of the bacteria to human airway epithelial cells (25).
A study by Nguyen et al. (26) investigated the effects of O polysaccharide expression on OMVs produced in the presence and absence of the membrane-perturbing antibiotic gentamicin. Their findings suggested that variations in O polysaccharide expression in P. aeruginosa PAO1 affect the size, mass, and total protein of the OMVs produced. In this study, we investigated the effect of O polysaccharide expression on OMV biogenesis, size, and composition. We used chromosomal knockout mutants of P. aeruginosa PAO1 that are defective in producing OSA (ΔwbpM), CPA (Δrmd), or both (ΔwbpL), and compared these to wild-type (wt) cells. Furthermore, we characterized the ability of these mutants to form biofilms at both early and late time points to assess how O polysaccharide expression affects biofilm development.
MATERIALS AND METHODS
Bacterial strains, growth conditions, and reagents.
The strains and plasmids used in this study are listed in Table 1. The ΔwbpM (CPA+ OSA−) mutant was constructed by in vitro deletion of the P. aeruginosa wbpM gene via allelic replacement (see Fig. S1 in the supplemental material). Briefly, upstream and downstream regions flanking the wbpM gene were amplified from PAO1 genomic DNA and annealed together to create an insert devoid of the gene (27). The upstream fragment was amplified using forward primer 5′-TGCATGTGGAGCTGATCTGG-3′ and reverse primer 5′-GTAGTCGTCCTTCTCCACGGGATCATGTCTTCTGTGCCCAACC-3′. The downstream fragment was amplified using forward primer 5′-GGTTGGGCACAGAAGACATGATCCCGTGGAGAAGGACGACTAC-3′ and reverse primer 5′-ATCCACCGAGACGAACGGAC-3′. The ΔwbpM insert was ligated into the SmaI site of the suicide vector pEX18Ap, creating pEXΔwbpM, which was then transformed into competent Escherichia coli SM10. Plasmid pEXΔwbpM was transferred into P. aeruginosa PAO1 by conjugation, and the allelic replacement chromosome deletion mutant was selected and screened as described previously (28–30). To complement the mutant, the wbpM gene was amplified from PAO1 genomic DNA using the forward primer 5′-CACTCTAGAACGGGGCTGATAAATAGGATG-3′ and reverse primer 5′-CACAAGCTTCCCAGCAAAGCAGTCGCTTC-3′ and inserted into the broad-host-range shuttle vector pHERD20T (31). The plasmid was transformed into competent PAO1 (ΔwbpM) cells using chemical shock (see Fig. S1 and see details below describing Western blotting).
TABLE 1.
Bacterial strains and plasmids used in this study
| Strain or plasmid | Phenotypea or genotype | Source or reference |
|---|---|---|
| Strains | ||
| P. aeruginosa | ||
| PAO1 wild type | CPA+ OSA+, serotype O5 | 55 |
| PAO1 ΔwbpM | CPA+ OSA−, full-length core, serotype O5 | This study |
| PAO1 Δrmd | CPA− OSA+, full-length core, serotype O5 | 56 |
| PAO1 ΔwbpL | CPA− OSA−, full-length core, serotype O5 | 57 |
| E. coli | ||
| DH5α | lacZYA-argF U169 recA1 endA1 hsdR17 (rK− mK+) phoA supE44 λ− thi-1 gyrA96 relA1 | Invitrogen |
| SM10 | thi-1 thr leu tonA lacY supE recA RP4-2-Tc::Mu Kmr | 58 |
| Plasmids | ||
| pEX18Ap | Gene replacement vector, OriT sacB Apr | 59 |
| pHERD20T | Shuttle vector | 31 |
The phenotype of each P. aeruginosa strain is described in terms of the absence or presence of the common polysaccharide antigen (CPA) or O-specific antigen (OSA).
Outer membrane vesicle and membrane isolation.
For isolation of OMVs, all P. aeruginosa strains were grown in 800 ml tryptic soy broth (TSB) (Becton, Dickinson, Mississauga, Ontario, Canada) for 16 h and incubated at 37°C in a rotary shaker at 200 rpm. Whole cells were centrifuged at 12,000 × g for 10 min at 4°C (Beckman Coulter Avanti J-E centrifuge, JA-10 rotor; Beckman Coulter, Mississauga, Ontario, Canada). To isolate OMVs, the resulting supernatant containing OMVs was subjected to ultracentrifugation at 150,000 × g for 1.5 h at 4°C (Beckman L8-55M ultracentrifuge, Ti45 rotor). The pellet containing the OMVs was washed and resuspended in 25 mM HEPES buffer (pH 7.4). The remaining cellular debris was removed from the suspension via syringe filtration through a 0.45-μm-pore cellulose acetate membrane filter (Thermo Scientific, Ottawa, Ontario, Canada) according to published protocols (32–34). The filtrate was pelleted by centrifugation at 21,000 × g for 30 min at 4°C using a microcentrifuge (Eppendorf 5424 microcentrifuge, FA-45-24 rotor, Mississauga, Ontario, Canada). The supernatant was discarded, and the pellet containing OMVs was resuspended in 100 μl of 25 mM HEPES.
For isolation of total membranes, cells were grown to 16 h as described above and pelleted at 5,000 × g for 10 min at 4°C. Cell pellets were then resuspended in 2 ml of a lysis buffer containing 25 mM HEPES, 5 mM EDTA, 200 μg/ml lysozyme, 20% (wt/vol) sucrose, and 5 μl of 1/10 diluted protease inhibitor complex set III (Novagen/EMD Biosciences, La Jolla, CA). Each aliquot was incubated for 15 min at room temperature with rocking and then added to 18 ml of ice-cold, sterile distilled water (dH2O). Samples were then sonicated for 1 min (10 s on, 10 s off) and centrifuged at 8,000 × g for 20 min at 4°C. Supernatant was collected and ultracentrifuged at 120,000 × g for 1 h at 4°C (Beckman L8-55M ultracentrifuge, Ti70 rotor). Membrane pellets were then resuspended in 0.5 ml of 25 mM HEPES. Protein concentrations for OMV and total membrane samples were determined using the bicinchoninic acid assay (Thermo Scientific, Ottawa, Ontario, Canada) with bovine serum albumin as the standard. To compare protein content, 15 μg of total membrane and OMVs isolated from each strain (based on protein concentration) were prepared for Coomassie-stained SDS-PAGE analysis.
Qualitative and quantitative assessment of outer membrane vesicles.
The protein contents of purified OMVs from each strain were compared using SDS-PAGE with 12% acrylamide gels stained with silver (35). The OMV LPS samples were prepared using the rapid proteinase K and SDS method of Hitchcock and Brown (36) and analyzed by SDS-PAGE followed by the ultrafast silver staining method of Fomsgaard et al. (37) for detection of LPS. For Western immunoblotting, the LPS was transferred onto nitrocellulose membranes (Pall Life Sciences, Port Washington, NY) according to the methods described previously (28), and the membranes were probed with murine monoclonal antibody (MAb) N1F10 (specific for CPA) or MF15-4 (specific for OSA). Alkaline phosphatase-conjugated goat anti-mouse F(ab′)2 (Cedar Lane, Burlington, Ontario, Canada) was used as the secondary antibody to detect the presence or absence of the CPA or OSA polysaccharide. The blots were developed using nitroblue tetrazolium (NBT) and 5-bromo-4-chloro-3-indolylphosphate (BCIP) as described previously (28, 38, 39).
To quantify OMV production, 10 μl of purified OMVs (described above) was assessed in triplicate using the fluorescent lipophilic dye FM4-64 (Molecular Probes, Burlington, Ontario, Canada). Fluorescence was measured at excitation 531 nm and emission 750 nm to obtain relative fluorescence units (RFU)/ml. The number of RFU/ml was then divided by the optical density at 600 nm (OD600) of the cell culture determined at the time of vesicle harvest to generate the OMV yield (RFU/OD600). In addition, 5 μl of purified OMVs from each strain was dot blotted to a nitrocellulose membrane (Pall Life Sciences) using a Bio-Dot vacuum manifold system (Bio-Rad Laboratories, Mississauga, Ontario, Canada). The membrane was immunoblotted using hybridoma culture supernatants containing MAb 5c-7-4 specific for the LPS core region (40) and developed using the Western immunoblotting methods described above. The dot blots were scanned, and the density of each triplicate spot was measured using the ImageJ program (version 1.46r; National Institutes of Health). A lysis control was performed for the triplicate OMV isolations by testing cell-free supernatant from the sample cultures for a reaction against mouse MAb raised against RNA polymerase α (Santa Cruz Biotechnology, Dallas, TX).
Transmission electron microscopy.
Isolated OMVs (5 μl) were applied to carbon-coated 200-mesh copper grids, blotted, and negatively stained with 2% uranyl acetate (5 μl). Grids containing OMVs were loaded into a Phillips CM-10 transmission electron microscope operating at 80 kV under standard operating conditions, and images were collected using a SIS/Olympus Morada 11-megapixel charge-coupled device (CCD) camera. For each sample, 1,000 OMVs were imaged, and the diameters were measured using the ImageJ program.
Protein digestion and MS.
Each strain was grown in duplicate, and OMVs were purified and disrupted by sonication (5 × 15 s, with 10 s of cooling between). A protease inhibitor complex (Roche Diagnostics, Indianapolis, IN) was added to the sonicate, and 20 μg of protein from each sample was digested in solution as previously described (41). Prior to digestion, proteins were denatured in 6 M urea–2 M thiourea (in 10 mM HEPES [pH 8.0]), reduced in 10 mM dithiothreitol (in 50 mM ammonium bicarbonate [ABC] buffer), and alkylated in 55 mM iodoacetamide (in 50 mM ABC). Proteins were digested with lysine C for 3 h, followed by an overnight digestion with trypsin (Princeton Separations, Adelphia, NJ). Trifluoroacetic acid was added to stop digestion, and solutions were dried under vacuum.
Liquid chromatography-tandem mass spectrometry (LC-MS/MS) analyses were performed on an Agilent 1200 high-pressure liquid chromatography (HPLC) chromatograph interfaced with an Agilent UHD 6530 quadrupole time of flight (Q-TOF) mass spectrometer at the Mass Spectrometry Facility of the Advanced Analysis Centre, University of Guelph. A C18 column (Agilent Advance Bio Peptide map; 100 mm by 2.1 mm 2.7 μm) was used for chromatographic separation with solvents A (dH2O with 0.1% formic acid) and B (acetonitrile with 0.1% formic acid). The mobile phase gradient was as follows: initial conditions, 2% B, increasing to 45% B in 40 min, and then to 55% B over the next 10 min, followed by column wash at 95% B and 10 min of reequilibration. The first 2 and last 5 min of gradient were sent to waste instead of the spectrometer. The flow rate was maintained at 0.2 ml/min. The mass spectrometer electrospray capillary voltage was maintained at 4.0 kV, and the drying gas temperature was set at 350°C with a flow rate of 13 l/min. The nebulizer pressure was 40 lb/in2, and the fragmentor was set to 150. Nitrogen was used as nebulizing drying gas and collision-induced gas. The mass/charge ratio (m/z) was scanned across the range of m/z 300 to 2,000 in 4 GHz (extended dynamic range) in the positive-ion and auto-MS/MS mode. Three precursor ions per cycle were selected for fragmentation. The instrument was externally calibrated with the ESI TuneMix (Agilent, Mississauga, Ontario, Canada). The sample injection volume was 100 μl.
Raw data files were loaded directly into PEAKS 6 software (Bioinformatics Solutions, Inc.), where the data were refined and subjected to deNovo sequencing and database searching. The following modifications were considered within the search parameters: methionine oxidation and carbamidomethylation of cysteine residues. The complete PAO1 protein database from Pseudomonas Genome Database last updated 8 March 2013 was used to identify proteins (42). The tolerance values used were 10 ppm for parent ions and 0.5 Da for fragment ions. Proteins identified in both replicates of each sample with a −10 log P (PEAKS 6 scoring) value of >20 were used for comparison between samples.
Biofilm development assay.
Biofilm assays were performed according to Stepanović et al. (43). Liquid cultures of each strain were grown to an OD600 of 0.5. From these cultures, 200 μl of a 1:40 dilution of each were added in triplicate to a 96-well culture plate. Negative control wells containing 200 μl of sterile medium were also added in triplicate. Plates were incubated for 16 h or 48 h at 37°C and then washed three times with phosphate-buffered saline (PBS) and left to dry for 1.5 h. Crystal violet (2%) was added to each well and left for 15 min to stain any remaining adherent cells. Plates were washed at room temperature with dH2O to remove excess stain and left to dry for 1.5 h. Glacial acetic acid (33% [vol/vol]) was then added to the wells to release the stain from the remaining cells, and the absorbance at 600 nm of each well was measured.
SEM.
For scanning electron microscopy (SEM), liquid cultures of each strain were grown for 16 or 48 h, as described above, in 96-well plates containing plastic coverslips. After incubation, each coverslip was fixed in 2% glutaraldehyde, followed by 1% osmium tetraoxide, for 30 min each. Samples were then dehydrated in a sequential series of ethanol solutions (increasing from 50% to 100%). Coverslips were critical point dried and coated with 15 nm of gold using an Emitech K550 sputter coater and viewed using a Hitachi S-570 scanning electron microscope.
Statistical analysis.
Statistical analyses of the data were completed using Prism 5 (GraphPad Software, Inc., San Diego, CA). The growth curves, OMV production, and cell lysis were analyzed using one-way analysis of variance (ANOVA) with Tukey-Kramer multiple comparison posttests. The endpoint (16 h) was the only time point compared for time course experiments (i.e., growth curve). A Kruskal-Wallis test was completed for biofilm experiments because the data did not satisfy the homogeneity of variance assumption required by a parametric ANOVA; Dunn's multiple comparisons were used to evaluate specific differences within and between the 16-, 24-, 32-, 40-, and 48-h time points. The level of significance was set at α = 0.05 for all tests. Information describing the distribution of OMV sizing data was calculated using Microsoft Excel (Microsoft, Redman, WA).
RESULTS
Changes in O polysaccharide expression do not significantly affect OMV production.
To assess the effects of O polysaccharide expression on the biogenesis of OMVs in P. aeruginosa, we used a series of mutants that altered the production of CPA and OSA (Table 1). We first tested these mutants for their ability to grow under standard conditions (Fig. 1A) to a density that would support sufficient OMV production (∼16 h of growth). The wt strain PAO1 (CPA+ OSA+) grew to an OD600 of ∼4.0, while the CPA+ OSA− (ΔwbpM; hereafter called OSA−) and the CPA− OSA− (ΔwbpL) strains demonstrated less robust growth (P < 0.05) over the same period (OD600 of ∼3.6 for each strain). The CPA− OSA+ (Δrmd; hereafter called CPA−) cells demonstrated greater growth than wt cells (Fig. 1A; P < 0.05). LPS profiles for each strain were also assessed by SDS-PAGE and immunoblotting (see Fig. S2 in the supplemental material). To quantify OMV production for each strain, we purified the OMVs at the 16-h time point from cell-free supernatants and measured the incorporation of the lipophilic fluorescent dye FM4-64 (Fig. 1B). FM4-64 has been previously used to quantify OMV production from cell-free supernatants (33, 34, 44, 45). In addition, we also performed dot blot analyses with anti-LPS monoclonal antibodies directed against the core region of P. aeruginosa PAO1 LPS to correlated OMV production (see Fig. S3 in the supplemental material). Both techniques produced consistent results, and no statistically significant differences in OMV production were observed for any of the O polysaccharide mutants compared to PAO1 (Fig. 1B; see Fig. S3). To ensure that OMV production was not caused by instability in the outer membrane of the mutant cells, we assessed cell lysis by performing dot immunoblotting using an anti-RNA polymerase antibody (Fig. 1C). Densitometry readings based on triplicate cell-free supernatant samples showed negligible levels of lysis for the wt P. aeruginosa CPA+ OSA+ cells and for the CPA− OSA− or CPA− mutant cells (Fig. 1D). However, OSA− cells demonstrated a statistically significant increase in cell lysis (Fig. 1D), suggesting this mutation decreases OM stability. However, despite this potential instability, the cells grew well, albeit to consistently lower OD600 levels (Fig. 1A).
FIG 1.
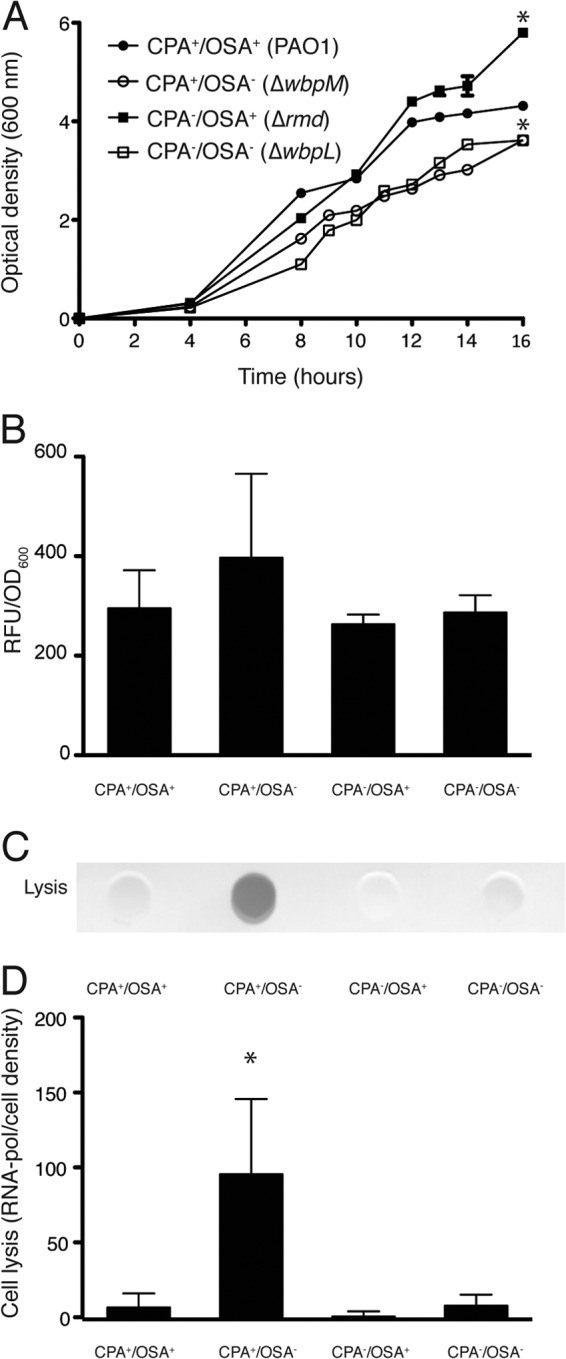
Cell growth, OMV production, and cell lysis of O polysaccharide mutants. (A) Growth curves for each P. aeruginosa strain cultured in TSB and measured up to 16 h. *, P < 0.05 versus wt. (B) Quantitative assessment of OMV production from 16-h cultures of the P. aeruginosa strains described in panel A using the lipophilic dye FM4-64. (C) Representative dot blot immunoassay (anti-RNA polymerase) demonstrating cell lysis in the cell-free supernatants from cultures described in panel A. (D) Quantitative assessment of cell lysis taken from densitometry readings from dot blot immunoassays (from panel C) *, P < 0.05 versus wt. All experiments were conducted in triplicate, and error bars represent standard deviations.
Differences in O polysaccharide influence OMV size and composition.
Based on reports that the size and composition of OMVs change when growth or environmental conditions are modified (7, 15), we sought to determine the effect of O polysaccharide expression on the size and composition of the OMVs produced by each strain. We obtained negatively stained transmission electron micrographs (Fig. 2A to D) of purified OMVs and measured the mean and median diameters, range, and skew of the OMVs for each strain (Table 2). OMVs isolated from wt PAO1 were similar to previously reported size estimates (15, 26), with a mean diameter of 88.2 nm (median of 87.2 nm), ranging from 21.3 to 231.9 nm. OMVs isolated from the OSA− strain displayed a similar range of sizes, but with significantly smaller mean and median diameters of 56.7 nm and 52.4 nm, respectively (Fig. 2B and E, Table 2). OMVs isolated from CPA− cells were slightly smaller than those isolated from PAO1, but still significantly larger than those isolated from the OSA− strain (Table 2). However, the largest OMVs (mean, 161.9 nm; median, 153.9 nm) with the greatest size distribution were observed in the ΔwbpL mutant (Fig. 2D and E, Table 2), in which both CPA production and OSA production are abrogated: ∼12% of OMVs measured exceeded the ∼250-nm maximum size observed for the PAO1 OMVs. These results suggest that the composition of O polysaccharide at the surface of P. aeruginosa cells affects the size distribution of OMVs produced.
FIG 2.

Size distribution of OMVs from different O polysaccharide mutants. Shown are negatively stained transmission electron micrographs of OMVs purified from 16-h cultures of PAO1 (A), ΔwbpM (B), Δrmd (C), and ΔwbpL (D) cells (bar, 1 μm). (E) Histogram representing the size distribution of OMVs purified from the different P. aeruginosa O polysaccharide-producing strains measured from transmission electron micrographs (n = 1,000 OMV measurements/strain).
TABLE 2.
Measurements of OMV size distribution
| Phenotype | OMV size (nm)a |
Skew | |||
|---|---|---|---|---|---|
| Mean ± SE | Median | Range | SD | ||
| CPA+ OSA+ (PAO1) | 88.2 ± 1.0 | 87.2 | 21.3–231.9 | 31.2 | 0.6 |
| CPA+ OSA− (ΔwbpM) | 56.7 ± 0.8 | 52.4 | 18.0–251.8 | 25.4 | 2.0 |
| CPA− OSA+ (Δrmd) | 78.4 ± 1.0 | 74.2 | 21.0–219.5 | 30.4 | 0.9 |
| CPA− OSA− (ΔwbpL) | 161.9 ± 2.9 | 153.9 | 23.5–889.6 | 93.0 | 1.2 |
Values are an average of OMV diameter measurements taken from three independent experiments comprising multiple micrographs for each strain. A total of 1,000 OMVs were measured for each strain.
In addition to determining the effects of O polysaccharides on the size distribution of OMVs, we investigated if the changes in cell surface polysaccharides also affected the protein composition of OMVs. To determine this, we isolated total membranes and OMVs from each strain and resolved equal amounts on Coomassie-stained SDS-PAGE gels (Fig. 3). The protein content of the total membranes (Fig. 3A) appeared constant across the four strains, while numerous differences were observed in the protein compositions of the OMVs (Fig. 3B). To further investigate these differences, we used LC-MS/MS to identify proteins within the purified OMV samples from each strain. MS analysis was performed on two biological replicates from each strain; the detailed list of proteins identified is depicted in Table S1 in the supplemental material. The method of LC-MS/MS analysis chosen greatly reduces the potential overlap from abundant peptides within a sample, such as flagella and other macromolecular complexes, and allowed us to examine differences in detectable proteins identified with high probability in the duplicate samples. (A PEAKS score of >20 indicates a confidence of 99%.) We identified 46 proteins that were present in at least one strain and within each replicate (Table 3). Consistent with previous reports (16, 32), OMVs produced from wt P. aeruginosa cells were enriched in outer membrane and periplasmic proteins but also contained a large number of cytoplasmic and cytoplasmic membrane proteins (16, 46), in addition to unknown proteins (Fig. 4A). This general trend was conserved among the O polysaccharide mutants, with the notable exception of the OSA− strain. This strain had a decreased proportional representation of outer membrane proteins and an increased proportional representation of periplasmic and unknown proteins (Fig. 4A). This is likely associated with the increases observed in cell lysis for this strain (Fig. 1C and D) and further suggests that in the ΔwbpM mutant lacking OSA, the Pseudomonas cell envelope may be compromised, leaking periplasmic and cytoplasmic contents. Interestingly, this effect, however, was not observed in the CPA− OSA− cells.
FIG 3.

Mutations in O polysaccharide expression result in changes in protein content within OMVs. Shown are isolated total membranes (A) and purified OMVs (B) from each P. aeruginosa strain cultured for 16 h and analyzed by Coomassie-stained SDS-PAGE. The total membranes from each strain show no major differences in their compositions, while the purified OMVs demonstrate distinct protein changes.
TABLE 3.
Proteins identified in purified OMVs derived from wt and mutant P. aeruginosa cells by LC-MS/MS
| Cellular location | Locus tag | Gene name | Protein description; alternate location | Phenotype |
|||
|---|---|---|---|---|---|---|---|
| CPA+ OSA+ | CPA+ OSA− | CPA− OSA+ | CPA− OSA− | ||||
| Outer membrane | PA2462 | Hemagglutinina | + | + | + | + | |
| PA0788 | Glycosyl transferasea | + | − | − | + | ||
| PA4735 | Peptidoglycan-associated (lipo)proteina | − | − | + | − | ||
| PA1178 | oprH | PhoP/Q and low-Mg2+-inducible protein H1b; periplasmic | + | − | + | + | |
| PA1777 | oprF | Major porin OprFb; periplasmic | − | − | + | − | |
| Periplasmic | PA1092 | fliC | Flagellin type Bb; extracellular, flagellar | + | + | + | + |
| PA2856 | tesA | Acyl-CoAc thioesterase | + | − | − | + | |
| PA0331 | ilvA1 | Threonine dehydrataseb; cytoplasmic | + | − | + | + | |
| PA2204 | Probable binding component of ABC transporterb | − | + | − | − | ||
| PA2612 | serS | Seryl-tRNA synthetaseb; cytoplasmic | − | + | − | − | |
| PA0371 | Peptidasea,b | − | − | + | − | ||
| PA5312 | pauC | Aldehyde dehydrogenaseb; cytoplasmic | − | − | + | − | |
| Extracellular | PA0690 | Filamentous hemagglutinin-like proteina | + | − | + | + | |
| Cytoplasmic membrane | PA5022 | Potassium efflux protein KefA | + | + | + | + | |
| PA0847 | Diguanylate cyclasea | + | − | − | + | ||
| PA2378 | Probable aldehyde dehydrogenase | + | − | − | + | ||
| PA3728 | DNA repair ATPasea | + | − | + | + | ||
| PA2615 | ftsK | Cell division protein FtsK | − | + | − | − | |
| PA3258 | Diguanylate phosphodiesterasea | − | − | + | − | ||
| PA5479 | gltP | Proton-glutamate symporter | − | − | + | − | |
| PA4821 | Probable transporter (DNA-damage-inducible protein F) | − | − | + | − | ||
| Cytoplasmic | PA2302 | ambE | Protein AmbE | + | − | − | + |
| PA5181 | Probable oxidoreductase | + | − | − | + | ||
| PA5060 | phaF | Polyhydroxyalkanoate synthesis protein PhaFb | + | − | − | + | |
| PA4995 | Probable acyl-CoA dehydrogenase | + | − | − | + | ||
| PA5036 | gltB | Glutamate synthase | − | + | + | − | |
| PA3327 | Probable nonribosomal peptide synthetase | − | + | − | − | ||
| PA1572 | ATP-NAD kinasea | − | + | − | − | ||
| PA2025 | gor | Glutathione reductaseb | − | − | + | − | |
| PA2978 | ptpA | Phosphotyrosine protein phosphatase | − | − | + | − | |
| PA1413 | Probable transcriptional regulator | − | − | + | − | ||
| PA4937 | rnr | Exoribonuclease RNase R | − | − | + | − | |
| PA3961 | Probable ATP-dependent helicase | − | − | + | − | ||
| Unknown | PA0623 | Probable bacteriophage protein | + | + | + | + | |
| PA2424 | pvdL | Peptide synthase PvdL | + | + | + | + | |
| PA4226 | pchE | Dihydroaeruginoic acid synthetase | + | − | − | + | |
| PA0186 | Probable component of ABC transporter | + | − | − | + | ||
| PA0172 | siaA | SiaA | + | − | − | + | |
| PA2402 | Nonribosomal peptide synthase | − | + | + | − | ||
| PA0622 | Bacteriophage protein | − | + | − | − | ||
| PA1573 | Putative periplasmic proteina | − | + | − | − | ||
| PA5253 | algP | Alginate regulatory protein AlgP | − | + | − | − | |
| PA1628 | Probable 3-hydroxyacyl-CoA dehydrogenase | − | − | + | − | ||
| PA1031 | DNA recombination protein RmuCa | − | − | + | − | ||
| PA4225 | pchF | Pyochelin synthetase | − | − | + | − | |
| PA2787 | cpg2 | Carboxypeptidase G2 precursor | − | − | + | − | |
Hypothetical proteins identified by BLAST search.
Proteins experimentally proven to be in given location.
CoA, coenzyme A.
FIG 4.

Protein sorting in OMVs from P. aeruginosa O polysaccharide mutants. Proportion of protein abundance for each P. aeruginosa strain tested separated by the localization of proteins based on the cellular compartment (A) and by PseudoCAP functional classification based on information from the Pseudomonas Genome Database for P. aeruginosa PAO1 (B). Each data set represents proteins identified from two biological replicates. (See Table S1 in the supplemental material for a complete list of proteins identified for each specimen and its corresponding replicates.)
Of the 46 proteins described in Table 3, only 5 were detected in the OMVs of all four strains, indicating considerable variability exists between the OMV proteomes analyzed. This variability is further highlighted when the identified OMV proteins for each strain are grouped based on PseudoCAP functional classifications (Fig. 4B). Both wt PAO1 and CPA− OSA− OMV proteomes demonstrate remarkable consistency in the proportion of protein distributed across functional classifications. However, OMVs derived from both the CPA− and OSA− strains demonstrated greater variability in the functional distribution of proteins. In the CPA− OMVs, we detected a larger proportion of proteins involved in “transport of small molecules” and smaller proportions of proteins involved in “translation and posttranslational modifications” and “transcriptional regulators” compared to the proteomes of OMVs derived from wt cells. CPA− OMVs also showed a significantly lower proportion of proteins involved in “motility and attachment.” OMVs derived from OSA− cells demonstrated the largest change in functional class distribution of proteins compared to wt OMVs, with an increased proportion of proteins related to “adaptation,” “protection,” and “translation and posttranslational modifications,” “transcriptional regulators,” and “proteins related to phage, transposons, and plasmids” (Fig. 4B).
Changes in P. aeruginosa O polysaccharide modify biofilm development.
To determine if the changes in PAO1 O polysaccharide alter the ability of cells to form biofilms, we tested the biofilm-forming ability of the four strains using a standard 96-well biofilm assay. At 16 h, all strains demonstrated substantial biofilm growth (Fig. 5). While OSA− cells formed less biofilm, and cells lacking both CPA and OSA formed roughly twice as much biofilm as wt PAO1 cells at 16 h, none of the differences were determined to be statistically significant. At 48 h, the level of biofilm development increased slightly for PAO1 cells, where the increase in biofilm formation for OSA− cells was more dramatic (P < 0.05 versus OSA− at 16 h) (Fig. 5). The CPA− OSA− mutant again demonstrated robust biofilm formation at 48 h, reaching the highest density of all strains tested. Surprisingly, biofilm formation for the CPA− strain was drastically reduced after 48 h (P < 0.05) compared to both the 16-h values for CPA− and the 48-h values for PAO1, suggesting that the lack of CPA played a role in biofilm maturation.
FIG 5.
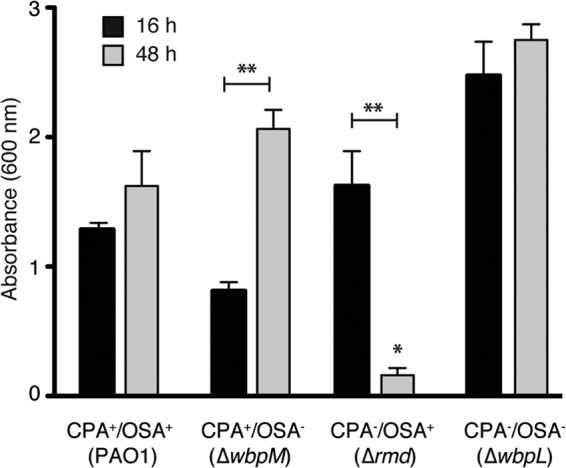
Biofilm formation of PAO1 and O polysaccharide mutants. Quantification of crystal violet staining associated with biofilm formation at 16 h (black bars) and 48 h (gray bars) for the different P. aeruginosa O polysaccharide-producing strains. Values on the y axis result from solubilization of crystal violet and were quantified by determining the A600 (n = 9 independent experiments/strain). *, P < 0.05 versus PAO1 at 48 h; **, P < 0.05 for 16 h versus 48 h within-strain difference. Error bars represent standard deviations.
We next used scanning electron microscopy to visualize biofilm formation for each P. aeruginosa strain at both 16 h (Fig. 6A to D) and 48 h (Fig. 6E to H). At 16 h, all biofilms displayed irreversible cellular attachment, microcolony, and macrocolony formation (Fig. 6A and B). Evidence of biofilm maturation was also detected based on the observable presence of exopolysaccharide and other biofilm matrix materials (Fig. 6C and D). As the biofilms continued to mature to 48 h, wt PAO1, OSA−, and CPA− OSA− cells showed comparable levels of biofilm formation (Fig. 6E, F, and H). Only individual surface-attached cells and small colonies were observed for CPA− cells (Fig. 6G). These observations match the quantitative results obtained for each strain (Fig. 5) and suggest that deletion of the rmd gene resulting in the absence of CPA significantly diminished the ability of P. aeruginosa PAO1 to form mature biofilms. Examination of the 48-h biofilms at higher magnification revealed significant differences in the cellular morphology and architecture of the Δrmd biofilms (Fig. 7C). The CPA− cells in the small surface-attached colonies appeared longer (2.5 μm to 3.5 μm) than cells of the other strains (1.5 μm to 2.0 μm). In addition, the smoother-looking CPA− cells appeared to have less matrix material, including exopolysaccharide, than the other three strains examined (Fig. 7A, B, and D). To further investigate the role of CPA expression in biofilm development, we conducted a biofilm time course experiment and monitored biofilm development of the Δrmd mutant at 8-h periods between 16 h and 48 h (Fig. 8). Our results demonstrate a gradual but clear decrease in biofilm formation between 16 h and 48 h, with significant decreases observed at 24, 32, and 40 h (P < 0.05) compared to the 16-h time point (Fig. 8A). The 40-h and 48-h time points also demonstrated a significant difference in biofilm development compared to the 32-h time point (Fig. 8A; P < 0.05). The decrease in Δrmd biofilm formation is also substantiated by the SEM micrographs, where representative images demonstrate a reduction in mature biofilm between 24 h and 32 h (Fig. 8B and C) and irreversibly attached cells and microcolonies at 40 h (Fig. 8D). That irreversibly attached cells are observed at all time points for this strain suggests the deletion of the rmd gene and the absence of CPA are causing structural defects that limit the development of mature biofilms.
FIG 6.

Scanning electron microscopy of PAO1 and O polysaccharide mutant biofilm production. Micrographs of 16-h (A to D) and 48-h (E to H) biofilms from the different P. aeruginosa O polysaccharide-producing strains. The small white arrows denote irreversibly attached cells, while the white arrowheads denote micro- and macrocolonies. Size bars, 10 μm.
FIG 7.

High-magnification scanning electron microscopy of mature biofilms. Shown are micrographs of 48-h biofilms of PAO1 (A), ΔwbpM (B), Δrmd (C), and ΔwbpL (D) biofilms. Size bars, 3 μm.
FIG 8.
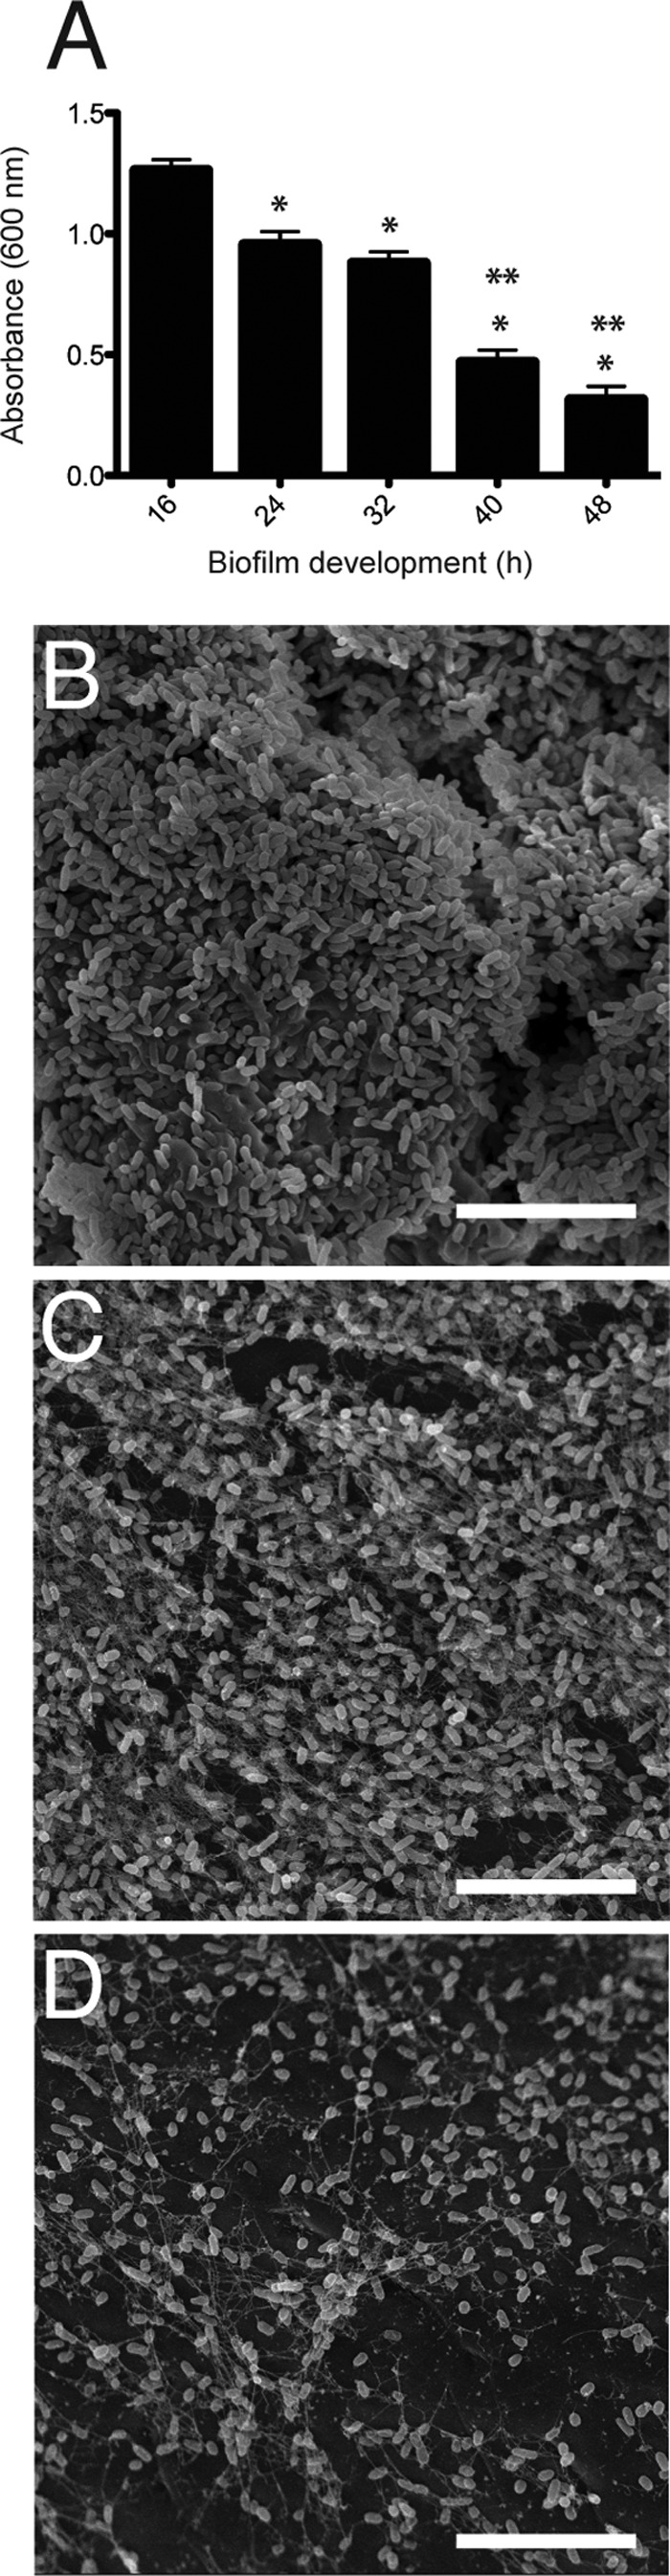
Biofilm development of P. aeruginosa PAO1 Δrmd. (A) Quantification of crystal violet staining associated with biofilm formation for PAO1 Δrmd between 16 h and 48 h demonstrating the graduate reduction in biofilm over time. Values on the y axis result from solubilization of crystal violet and were quantified by determining the A600 (n = 9 independent experiments/strain). *, P < 0.05 versus Δrmd at 16 h; **, P < 0.05 for 40 h and 48 h versus 32 h. Shown are representative SEM micrographs of Δrmd biofilms cultured for 24 h (B), 32 h (C), and 40 h (D). Representative micrographs for Δrmd biofilms cultured for 16 h and 48 h are found in Fig. 6C and G, respectively. Size bars, 10 μm. Error bars represent standard deviations.
DISCUSSION
O polysaccharides extend from the surface of P. aeruginosa and other Gram-negative pathogens and are among the first points of contact between the bacterial cell and biotic and abiotic surfaces. As such, they play a critical role in surface attachment and modulating the host response. In P. aeruginosa PAO1, the two different forms of O polysaccharide that extend from the cell surface, CPA and OSA, can vary in their relative amounts and chain length depending on the environmental conditions (17, 47). In this study, we have presented evidence that altering the presence of CPA and OSA impacts the cell surface and results in changes in OMV size and composition and in biofilm development.
Using defined mutations that resulted in the loss of CPA (Δrmd), OSA (ΔwbpM), or both (ΔwbpL), we first assessed the effects of O polysaccharide expression on OMV biogenesis and cell envelope integrity (Fig. 1). It is worth noting that the choice of using “unmarked” deletion and allelic exchange knockout mutants in our studies is deliberate, compared to using knockout mutants constructed with a gentamicin cassette insertion followed by allelic exchange. The latter type of mutants requires the addition of gentamicin during their growth to maintain the genotype, and this aminoglycoside antibiotic is known to cause blebbing artifacts of the Gram-negative cell envelope (7, 48). Our results clearly demonstrated that altering O polysaccharide expression in P. aeruginosa PAO1 did not drastically alter the levels of OMV produced (Fig. 1B; see Fig. S3 in the supplemental material). However, OSA− cells did demonstrate an increased level of cell lysis (Fig. 1C and D) and an altered proportion of protein content based on cellular location, with an increased proportion of periplasmic proteins and proteins of unknown function (Fig. 4A). In addition, SEM micrographs of OSA− biofilms (Fig. 7B) show ripples and bulges on the surfaces of the cells, features consistent with a compromised cell envelope. Together, these data suggest that the absence of only OSA at the surface of P. aeruginosa PAO1 may alter the stability of the cell envelope. Curiously, cells deficient in both CPA and OSA do not show the same observable instability in their cell envelope (Fig. 1D and 7D). It is also interesting to note that loss of either CPA or OSA resulted in the generation of smaller OMVs compared to wt PAO1, while a loss of both resulted in greater distribution of OMV sizes with larger OMVs (Table 2). This may be due to changes in charge and/or hydrophobicity of the cell surface when O polysaccharides are differentially expressed or absent altogether. These physiological changes could in turn lead to structural changes that affect OMV biogenesis.
A recent study by Macdonald and Kuehn (34) used P. aeruginosa strain PA14 and examined whether OSA LPS was required for the induction of OMVs by chemical stress. Although these authors were using LPS mutants that affected genes similar to those used in our study, their mutants were obtained from the collection of transposon insertion mutants (49). Macdonald and Kuehn reported that the basal levels of OMV production for PA14 ΔwbpM (OSA−) and PA14 Δrmd (CPA−) were similar to wt PA14 but that OMV production for the CPA− OSA− strain PA14 ΔwapR was ∼2-fold higher (34). This differs from our observations for the CPA− OSA− mutant used in this study and may be attributed to strain-specific differences in OMV production (50). Other possible explanations may include differences in the functional roles of WapR (null mutants result in core oligosaccharide truncations in addition to the absence of O polysaccharides) and WbpL in LPS synthesis. Another explanation for the difference observed in OMV production between the two studies may stem from their inclusion of gentamicin, a known inducer of OMV production and cell envelope stress (7, 21, 48, 51) in the culture medium.
We next assessed the OMVs derived from the different O polysaccharide-producing strains for differences in physical properties. When Nguyen et al. (26) measured 100 OMVs from three PAO1 LPS mutants, they observed that the CPA− OSA− mutant (rd7513) produced large OMVs and the OSA− mutant strain (AK 1401, a bacterial D3-phage infected lysogen) produced the smallest, consistent with our results. However, no mean, median, or standard deviations were cited, making quantitative comparisons difficult. We took a more detailed approach to comparing the size distributions for the OMVs. Using transmission electron microscopy (Fig. 2), we demonstrated significant size distribution differences between the OMVs (Table 2). These differences are interesting because they suggest that the overall composition of cell surface sugars influences the architecture of OMVs, and this in turn could be related to mechanisms involving OMV biogenesis. Schooling and Beveridge (15) reported that OMVs derived from P. aeruginosa PAO1 biofilms were consistently smaller than their planktonically derived counterparts. It has also been demonstrated that when PAO1 is cultured as biofilms, the distribution of O polysaccharides shifts to almost exclusively favor CPA production (17, 21). Our results clearly demonstrated that the smaller OMVs observed for the OSA− strain likely mimic those derived from the surface of PAO1 cells within a biofilm and suggest that O polysaccharides have a role in determining the physical nature of OMVs.
Our results also demonstrate that O polysaccharide expression on the surface of P. aeruginosa PAO1 cells might play a role in protein packaging within OMVs. Our initial SDS-PAGE analysis revealed considerable differences in the protein contents of OMVs isolated from each strain, while the protein contents of the total membranes from the corresponding whole cells remained constant (Fig. 3). This indicates that the differences in protein contents observed in OMVs were not a result of differences in the production of these proteins within the cell. However, it should be noted that our analysis does not account for changes in soluble proteins. LC-MS/MS analysis also demonstrated that OMVs derived from cells that lack only OSA on their cell surface exhibited a shift in the proportion of proteins based on cell localization and proposed cellular function (Fig. 4). This differential packaging of proteins into OMVs has been observed in Pseudomonas and other pathogens (10, 32). Recently, Wessel et al. (32) used LC-MS/MS to determine the proteomes of OMVs produced from wt P. aeruginosa PA14 and a mutant of PA14 lacking the peptidoglycan-associated outer membrane protein OprF (32). They demonstrated that the relative abundance of outer membrane proteins shifted and was significantly higher in OMVs from cells that lacked OprF (32). Another study by Haurat et al. (10) proposed that in the human oral pathogen Porphyromonas gingivalis, specific virulence factors are preferentially packaged into OMVs and that abundant outer membrane proteins are excluded. They also demonstrated that LPS specifically drives this selective mechanism of sorting proteins. While their results suggest that O polysaccharides are not involved in vesicle formation, it was demonstrated that OMVs from P. gingivalis are enriched with longer LPS chains that may differ in composition from those found on the outer membrane (10). The data presented in this study support the concept of selected sorting of proteins within OMVs and suggest that O polysaccharide expression affects this process.
To investigate the ability of O polysaccharide mutants to form biofilms, we used a combination of high-throughput 96-well plate assays and scanning electron microscopy and assessed biofilm formation at 16- and 48-h time points (Fig. 5 and 6). This combination of techniques provides a reproducible, quantitative assessment of biofilm development with high-resolution cellular and macrocolony visualization. Our results demonstrated that wt P. aeruginosa PAO1 developed substantial biofilms after 16 h of growth with similar levels of biofilms observed for the CPA− strain. Cells lacking only OSA on their cell surface demonstrated a trend toward less biofilm formation at 16 h, while cells that lacked both CPA and OSA showed a trend toward more biofilm formation at 16 h. Makin and Beveridge (20) demonstrated that after the early time point of 3 h, wt P. aeruginosa PAO1 cells and CPA− (dps89) cells demonstrated increased biofilm formation on glass surfaces compared to OSA− (AK1401) and CPA− OSA− (rd7513) mutants. Similar results were observed by Lindhout et al. (52) and Lau et al. (53), who reported that a planktonically grown wapR PAO1 mutant, lacking all O polysaccharide, placed on glass coverslips showed reduced swimming compared to wt PAO1, correlating with increased surface attachment. These differences in adherence have been attributed to measurable changes in surface hydrophobicity and surface charge of the cells. In contrast, the ability of the bacteria to adhere to polystyrene surfaces was observed to be enhanced for OSA− and CPA− OSA− cells, correlating with the increased hydrophobicity of these cell surfaces (20). Combined, these results suggest that the surface properties of P. aeruginosa PAO1 vary greatly with changes in O polysaccharide expression and that the surface properties of the substrates also play an important role in determining cellular attachment and biofilm formation.
After 48 h of biofilm development, our results showed increases in biofilm development of wt PAO1 and OSA− cells, with only a minor increase in biofilm development for CPA− OSA− cells (Fig. 5). Surprisingly, at 48 h, cells that lacked only CPA demonstrated a drastic and reproducible decrease in biofilm formation (Fig. 5) and evidence of only micro- and macrocolony formation when visualized by scanning electron microscopy (Fig. 6G). A more detailed biofilm development time course assay demonstrated that the CPA− cells undergo a gradual decrease in cellular density between 16 h and 48 h (Fig. 8). Upon closer inspection, this reduction in biofilm formation for CPA− cells appeared to correlate with changes in cell morphology and exopolysaccharide production (Fig. 7C) compared to the other strains. However, cells lacking both CPA and OSA did not demonstrate the same phenotype, possibly due to changes in the surface hydrophobicity when both O polysaccharides are removed, exposing the LPS core region. The apparent lack of matrix materials in the CPA− Δrmd biofilms may account for the relative decrease in biofilm at the 48-h time point, as the matrix is believed to provide structural support to mature biofilms (54). In addition, the proportional reduction of proteins corresponding to “motility and adaptation” observed in CPA− OMVs (Fig. 4B) might indicate that the corresponding Δrmd whole cells also lack these proteins. Reductions in proteins involved in surface- and cell-to-cell contact could account for the poor maturation of biofilms observed for this strain.
In conclusion, the modulation of O polysaccharide expression has an impact on the physical and compositional properties of P. aeruginosa OMVs, potentially playing a role in differential protein sorting within different strains. O polysaccharide expression also influences biofilm development, and this study highlights the importance of CPA in this process. As the expression of CPA increases when P. aeruginosa cells transition to a biofilm mode of growth (20, 21, 24), one could speculate that the presence of this polysaccharide on the cell surface acts to stabilize biofilms as well as conferring immune protection and bacterial persistence. To understand how CPA aids in the transition of P. aeruginosa from a planktonic state to a biofilm lifestyle, future investigation is warranted.
Supplementary Material
ACKNOWLEDGMENTS
We thank Bob Harris and Michaela Strüder-Kypke of the Molecular and Cellular Imaging Facility and Armen Charchoglyan of the Mass Spectrometry Facility at the University of Guelph Advanced Analysis Centre for technical assistance with transmission electron microscopy and mass spectrometry experiments, respectively. We also thank Sandy Smith and Emily Vis for assistance with the scanning electron microscopy and Deborah Stewart Khursigara for critical reading of the manuscript and editorial assistance.
This work was supported by a research grant from Cystic Fibrosis Canada to C.M.K. and a CIHR operating grant (MOP-14687) to J.S.L.
Footnotes
Published ahead of print 24 January 2014
Supplemental material for this article may be found at http://dx.doi.org/10.1128/JB.01463-13.
REFERENCES
- 1.Mayrand D, Grenier D. 1989. Biological activities of outer membrane vesicles. Can. J. Microbiol. 35:607–613. 10.1139/m89-097 [DOI] [PubMed] [Google Scholar]
- 2.Brandtzaeg P, Kierulf P, Gaustad P, Skulberg A, Bruun JN, Halvorsen S, Sørensen E. 1989. Plasma endotoxin as a predictor of multiple organ failure and death in systemic meningococcal disease. J. Infect. Dis. 159:195–204. 10.1093/infdis/159.2.195 [DOI] [PubMed] [Google Scholar]
- 3.Gankema H, Wensink J, Guinée PA, Jansen WH, Witholt B. 1980. Some characteristics of the outer membrane material released by growing enterotoxigenic Escherichia coli. Infect. Immun. 29:704–713 [DOI] [PMC free article] [PubMed] [Google Scholar]
- 4.Hoekstra D, van der Laan JW, de Leij L, Witholt B. 1976. Release of outer membrane fragments from normally growing Escherichia coli. Biochim. Biophys. Acta 455:889–899. 10.1016/0005-2736(76)90058-4 [DOI] [PubMed] [Google Scholar]
- 5.Beveridge TJ. 1999. Structures of gram-negative cell walls and their derived membrane vesicles. J. Bacteriol. 181:4725–4733 [DOI] [PMC free article] [PubMed] [Google Scholar]
- 6.Kulp A, Kuehn MJ. 2010. Biological functions and biogenesis of secreted bacterial outer membrane vesicles. Annu. Rev. Microbiol. 64:163–184. 10.1146/annurev.micro.091208.073413 [DOI] [PMC free article] [PubMed] [Google Scholar]
- 7.Kadurugamuwa JL, Beveridge TJ. 1995. Virulence factors are released from Pseudomonas aeruginosa in association with membrane vesicles during normal growth and exposure to gentamicin: a novel mechanism of enzyme secretion. J. Bacteriol. 177:3998–4008 [DOI] [PMC free article] [PubMed] [Google Scholar]
- 8.Mashburn-Warren LM, Whiteley M. 2006. Special delivery: vesicle trafficking in prokaryotes. Mol. Microbiol. 61:839–846. 10.1111/j.1365-2958.2006.05272.x [DOI] [PubMed] [Google Scholar]
- 9.Mashburn-Warren L, Howe J, Garidel P, Richter W, Steiniger F, Roessle M, Brandenburg K, Whiteley M. 2008. Interaction of quorum signals with outer membrane lipids: insights into prokaryotic membrane vesicle formation. Mol. Microbiol. 69:491–502. 10.1111/j.1365-2958.2008.06302.x [DOI] [PMC free article] [PubMed] [Google Scholar]
- 10.Haurat MF, Aduse-Opoku J, Rangarajan M, Dorobantu L, Gray MR, Curtis MA, Feldman MF. 2011. Selective sorting of cargo proteins into bacterial membrane vesicles. J. Biol. Chem. 286:1269–1276. 10.1074/jbc.M110.185744 [DOI] [PMC free article] [PubMed] [Google Scholar]
- 11.Dorward DW, Garon CF, Judd RC. 1989. Export and intercellular transfer of DNA via membrane blebs of Neisseria gonorrhoeae. J. Bacteriol. 171:2499–2505 [DOI] [PMC free article] [PubMed] [Google Scholar]
- 12.Kolling GL, Matthews KR. 1999. Export of virulence genes and Shiga toxin by membrane vesicles of Escherichia coli O157:H7. Appl. Environ. Microbiol. 65:1843–1848 [DOI] [PMC free article] [PubMed] [Google Scholar]
- 13.Yaron S, Kolling GL, Simon L, Matthews KR. 2000. Vesicle-mediated transfer of virulence genes from Escherichia coli O157:H7 to other enteric bacteria. Appl. Environ. Microbiol. 66:4414–4420. 10.1128/AEM.66.10.4414-4420.2000 [DOI] [PMC free article] [PubMed] [Google Scholar]
- 14.Tashiro Y, Ichikawa S, Shimizu M, Toyofuku M, Takaya N, Nakajima-Kambe T, Uchiyama H, Nomura N. 2010. Variation of physiochemical properties and cell association activity of membrane vesicles with growth phase in Pseudomonas aeruginosa. Appl. Environ. Microbiol. 76:3732–3739. 10.1128/AEM.02794-09 [DOI] [PMC free article] [PubMed] [Google Scholar]
- 15.Schooling SR, Beveridge TJ. 2006. Membrane vesicles: an overlooked component of the matrices of biofilms. J. Bacteriol. 188:5945–5957. 10.1128/JB.00257-06 [DOI] [PMC free article] [PubMed] [Google Scholar]
- 16.Toyofuku M, Roschitzki B, Riedel K, Eberl L. 2012. Identification of proteins associated with the Pseudomonas aeruginosa biofilm extracellular matrix. J. Proteome Res. 11:4906–4915. 10.1021/pr300395j [DOI] [PubMed] [Google Scholar]
- 17.Lam JS, Taylor VL, Islam ST, Hao Y, Kocíncová D. 2011. Genetic and functional diversity of Pseudomonas aeruginosa lipopolysaccharide. Front. Microbiol. 2:118. 10.3389/fmicb.2011.00118 [DOI] [PMC free article] [PubMed] [Google Scholar]
- 18.Knirel YA, Bystrova OV, Kocharova NA, Zähringer U, Pier GB. 2006. Review: conserved and variable structural features in the lipopolysaccharide of Pseudomonas aeruginosa. J. Endotoxin Res. 12:324–336. 10.1179/096805106X118906 [DOI] [PubMed] [Google Scholar]
- 19.Lam JS, Graham LL, Lightfoot J, Dasgupta T, Beveridge TJ. 1992. Ultrastructural examination of the lipopolysaccharides of Pseudomonas aeruginosa strains and their isogenic rough mutants by freeze-substitution. J. Bacteriol. 174:7159–7167 [DOI] [PMC free article] [PubMed] [Google Scholar]
- 20.Makin SA, Beveridge TJ. 1996. The influence of A-band and B-band lipopolysaccharide on the surface characteristics and adhesion of Pseudomonas aeruginosa to surfaces. Microbiology 142:299–307. 10.1099/13500872-142-2-299 [DOI] [PubMed] [Google Scholar]
- 21.Beveridge TJ, Makin SA, Kadurugamuwa JL, Li Z. 1997. Interactions between biofilms and the environment. FEMS Microbiol. Rev. 20:291–303. 10.1111/j.1574-6976.1997.tb00315.x [DOI] [PubMed] [Google Scholar]
- 22.Gellatly SL, Hancock REW. 2013. Pseudomonas aeruginosa: new insights into pathogenesis and host defenses. Pathog. Dis. 67:159–173. 10.1111/2049-632X.12033 [DOI] [PubMed] [Google Scholar]
- 23.Hancock RE, Mutharia LM, Chan L, Darveau RP, Speert DP, Pier GB. 1983. Pseudomonas aeruginosa isolates from patients with cystic fibrosis: a class of serum-sensitive, nontypable strains deficient in lipopolysaccharide O side chains. Infect. Immun. 42:170–177 [DOI] [PMC free article] [PubMed] [Google Scholar]
- 24.Lam MY, McGroarty EJ, Kropinski AM, MacDonald LA, Pedersen SS, Høiby N, Lam JS. 1989. Occurrence of a common lipopolysaccharide antigen in standard and clinical strains of Pseudomonas aeruginosa. J. Clin. Microbiol. 27:962–967 [DOI] [PMC free article] [PubMed] [Google Scholar]
- 25.Matewish M. 2004. The functional role of lipopolysaccharide in the cell envelope and surface proteins of Pseudomonas aeruginosa. Ph.D. thesis University of Guelph, Guelph, Canada [Google Scholar]
- 26.Nguyen TT, Saxena A, Beveridge TJ. 2003. Effect of surface lipopolysaccharide on the nature of membrane vesicles liberated from the Gram-negative bacterium Pseudomonas aeruginosa. J. Electron Microsc. 52:465–469. 10.1093/jmicro/52.5.465 [DOI] [PubMed] [Google Scholar]
- 27.Horton RM, Hunt HD, Ho SN, Pullen JK, Pease LR. 1989. Engineering hybrid genes without the use of restriction enzymes: gene splicing by overlap extension. Gene 77:61–68. 10.1016/0378-1119(89)90359-4 [DOI] [PubMed] [Google Scholar]
- 28.Hao Y, King JD, Huszczynski S, Kocíncová D, Lam JS. 2013. Five new genes are important for common polysaccharide antigen biosynthesis in Pseudomonas aeruginosa. mBio 4(1):e00631–12. 10.1128/mBio.00631-12 [DOI] [PMC free article] [PubMed] [Google Scholar]
- 29.Choi K-H, Schweizer HP. 2005. An improved method for rapid generation of unmarked Pseudomonas aeruginosa deletion mutants. BMC Microbiol. 5:30. 10.1186/1471-2180-5-30 [DOI] [PMC free article] [PubMed] [Google Scholar]
- 30.Schweizer HP, Hoang TT. 1995. An improved system for gene replacement and xylE fusion analysis in Pseudomonas aeruginosa. Gene 158:15–22. 10.1016/0378-1119(95)00055-B [DOI] [PubMed] [Google Scholar]
- 31.Qiu D, Damron FH, Mima T, Schweizer HP, Yu HD. 2008. PBAD-based shuttle vectors for functional analysis of toxic and highly regulated genes in Pseudomonas and Burkholderia spp. and other bacteria. Appl. Environ. Microbiol. 74:7422–7426. 10.1128/AEM.01369-08 [DOI] [PMC free article] [PubMed] [Google Scholar]
- 32.Wessel AK, Liew J, Kwon T, Marcotte EM, Whiteley M. 2013. Role of Pseudomonas aeruginosa peptidoglycan-associated outer membrane proteins in vesicle formation. J. Bacteriol. 195:213–219. 10.1128/JB.01253-12 [DOI] [PMC free article] [PubMed] [Google Scholar]
- 33.Chutkan H, Macdonald I, Manning A, Kuehn MJ. 2013. Quantitative and qualitative preparations of bacterial outer membrane vesicles. Methods Mol. Biol. 966:259–272. 10.1007/978-1-62703-245-2_16 [DOI] [PMC free article] [PubMed] [Google Scholar]
- 34.Macdonald IA, Kuehn MJ. 2013. Stress-induced outer membrane vesicle production by Pseudomonas aeruginosa. J. Bacteriol. 195:2971–2981. 10.1128/JB.02267-12 [DOI] [PMC free article] [PubMed] [Google Scholar]
- 35.Morrissey JH. 1981. Silver stain for proteins in polyacrylamide gels: a modified procedure with enhanced uniform sensitivity. Anal. Biochem. 117:307. 10.1016/0003-2697(81)90783-1 [DOI] [PubMed] [Google Scholar]
- 36.Hitchcock PJ, Brown TM. 1983. Morphological heterogeneity among Salmonella lipopolysaccharide chemotypes in silver-stained polyacrylamide gels. J. Bacteriol. 154:269–277 [DOI] [PMC free article] [PubMed] [Google Scholar]
- 37.Fomsgaard A, Freudenberg MA, Galanos C. 1990. Modification of the silver staining technique to detect lipopolysaccharide in polyacrylamide gels. J. Clin. Microbiol. 28:2627–2631 [DOI] [PMC free article] [PubMed] [Google Scholar]
- 38.De Kievit TR, Dasgupta T, Schweizer H, Lam JS. 1995. Molecular cloning and characterization of the rfc gene of Pseudomonas aeruginosa (serotype O5). Mol. Microbiol. 16:565–574. 10.1111/j.1365-2958.1995.tb02419.x [DOI] [PubMed] [Google Scholar]
- 39.Blake MS, Johnston KH, Russell-Jones GJ, Gotschlich EC. 1984. A rapid, sensitive method for detection of alkaline phosphatase-conjugated anti-antibody on Western blots. Anal. Biochem. 136:175–179. 10.1016/0003-2697(84)90320-8 [DOI] [PubMed] [Google Scholar]
- 40.De Kievit TR, Lam JS. 1994. Monoclonal antibodies that distinguish inner core, outer core, and lipid A regions of Pseudomonas aeruginosa lipopolysaccharide. J. Bacteriol. 176:7129–7139 [DOI] [PMC free article] [PubMed] [Google Scholar]
- 41.Foster LJ, de Hoog CL, Mann M. 2003. Unbiased quantitative proteomics of lipid rafts reveals high specificity for signaling factors. Proc. Natl. Acad. Sci. USA 100:5813–5818. 10.1073/pnas.0631608100 [DOI] [PMC free article] [PubMed] [Google Scholar]
- 42.Winsor GL, Lam DKW, Fleming L, Lo R, Whiteside MD, Yu NY, Hancock REW, Brinkman FSL. 2011. Pseudomonas Genome Database: improved comparative analysis and population genomics capability for Pseudomonas genomes. Nucleic Acids Res. 39:D596–D600. 10.1093/nar/gkq869 [DOI] [PMC free article] [PubMed] [Google Scholar]
- 43.Stepanović S, Vuković D, Dakić I, Savić B, Svabić-Vlahović M. 2000. A modified microtiter-plate test for quantification of staphylococcal biofilm formation. J. Microbiol. Methods 40:175–179. 10.1016/S0167-7012(00)00122-6 [DOI] [PubMed] [Google Scholar]
- 44.Pogliano J, Osborne N, Sharp MD, Mello A-D, Perez A, Sun Y-L, Pogliano K. 1999. A vital stain for studying membrane dynamics in bacteria: a novel mechanism controlling septation during Bacillus subtilis sporulation. Mol. Microbiol. 31:1149–1159. 10.1046/j.1365-2958.1999.01255.x [DOI] [PMC free article] [PubMed] [Google Scholar]
- 45.Manning AJ, Kuehn MJ. 2011. Contribution of bacterial outer membrane vesicles to innate bacterial defense. BMC Microbiol. 11:258. 10.1186/1471-2180-11-258 [DOI] [PMC free article] [PubMed] [Google Scholar]
- 46.Choi D-S, Kim D-K, Choi SJ, Lee J, Choi J-P, Rho S, Park S-H, Kim Y-K, Hwang D, Gho YS. 2011. Proteomic analysis of outer membrane vesicles derived from Pseudomonas aeruginosa. Proteomics 11:3424–3429. 10.1002/pmic.201000212 [DOI] [PubMed] [Google Scholar]
- 47.McGroarty EJ, Rivera M. 1990. Growth-dependent alterations in production of serotype-specific and common antigen lipopolysaccharides in Pseudomonas aeruginosa PAO1. Infect. Immun. 58:1030–1037 [DOI] [PMC free article] [PubMed] [Google Scholar]
- 48.Kadurugamuwa JL, Clarke AJ, Beveridge TJ. 1993. Surface action of gentamicin on Pseudomonas aeruginosa. J. Bacteriol. 175:5798–5805 [DOI] [PMC free article] [PubMed] [Google Scholar]
- 49.Liberati NT, Urbach JM, Miyata S, Lee DG, Drenkard E, Wu G, Villanueva J, Wei T, Ausubel FM. 2006. An ordered, nonredundant library of Pseudomonas aeruginosa strain PA14 transposon insertion mutants. Proc. Natl. Acad. Sci. U. S. A. 103:2833–2838. 10.1073/pnas.0511100103 [DOI] [PMC free article] [PubMed] [Google Scholar]
- 50.Bauman SJ, Kuehn MJ. 2006. Purification of outer membrane vesicles from Pseudomonas aeruginosa and their activation of an IL-8 response. Microbes Infect. 8:2400–2408. 10.1016/j.micinf.2006.05.001 [DOI] [PMC free article] [PubMed] [Google Scholar]
- 51.Kadurugamuwa JL, Lam JS, Beveridge TJ. 1993. Interaction of gentamicin with the A band and B band lipopolysaccharides of Pseudomonas aeruginosa and its possible lethal effect. Antimicrob. Agents Chemother. 37:715–721. 10.1128/AAC.37.4.715 [DOI] [PMC free article] [PubMed] [Google Scholar]
- 52.Lindhout T, Lau PCY, Brewer D, Lam JS. 2009. Truncation in the core oligosaccharide of lipopolysaccharide affects flagella-mediated motility in Pseudomonas aeruginosa PAO1 via modulation of cell surface attachment. Microbiology 155:3449–3460. 10.1099/mic.0.030510-0 [DOI] [PubMed] [Google Scholar]
- 53.Lau PCY, Lindhout T, Beveridge TJ, Dutcher JR, Lam JS. 2009. Differential lipopolysaccharide core capping leads to quantitative and correlated modifications of mechanical and structural properties in Pseudomonas aeruginosa biofilms. J. Bacteriol. 191:6618–6631. 10.1128/JB.00698-09 [DOI] [PMC free article] [PubMed] [Google Scholar]
- 54.Flemming H-C, Wingender J. 2010. The biofilm matrix. Nat. Rev. Microbiol. 8:623–633. 10.1038/nrmicro2415 [DOI] [PubMed] [Google Scholar]
- 55.Hancock RE, Carey AM. 1979. Outer membrane of Pseudomonas aeruginosa: heat-2-mercaptoethanol-modifiable proteins. J. Bacteriol. 140:902–910 [DOI] [PMC free article] [PubMed] [Google Scholar]
- 56.Rocchetta HL, Pacan JC, Lam JS. 1998. Synthesis of the A-band polysaccharide sugar D-rhamnose requires Rmd and WbpW: identification of multiple AlgA homologues, WbpW and ORF488, in Pseudomonas aeruginosa. Mol. Microbiol. 29:1419–1434. 10.1046/j.1365-2958.1998.01024.x [DOI] [PubMed] [Google Scholar]
- 57.Rocchetta HL, Burrows LL, Pacan JC, Lam JS. 1998. Three rhamnosyltransferases responsible for assembly of the A-band D-rhamnan polysaccharide in Pseudomonas aeruginosa: a fourth transferase, WbpL, is required for the initiation of both A-band and B-band lipopolysaccharide synthesis. Mol. Microbiol. 28:1103–1119. 10.1046/j.1365-2958.1998.00871.x [DOI] [PubMed] [Google Scholar]
- 58.Simon R, Priefer U, Pühler A. 1983. A broad host range mobilization system for in vivo genetic engineering: transposon mutagenesis in gram negative bacteria. Nat. Biotechnol. 1:784–791. 10.1038/nbt1183-784 [DOI] [Google Scholar]
- 59.Hoang TT, Karkhoff-Schweizer RR, Kutchma AJ, Schweizer HP. 1998. A broad-host-range Flp-FRT recombination system for site-specific excision of chromosomally located DNA sequences: application for isolation of unmarked Pseudomonas aeruginosa mutants. Gene 212:77–86. 10.1016/S0378-1119(98)00130-9 [DOI] [PubMed] [Google Scholar]
Associated Data
This section collects any data citations, data availability statements, or supplementary materials included in this article.