

Abstract
Recent findings have suggested that the autophagic isolation membrane (IM) might originate from a domain of the endoplasmic reticulum (ER) called the omegasome. However, the morphological relationships between ER, omegasome, and IM remain unclear. In the present study, we found that hybrid structures composed of a double FYVE domain-containing protein 1 (DFCP1)-positive omegasome and the IM accumulated in Atg3-deficient mouse embryonic fibroblasts (MEFs). Moreover, correlative light and electron microscopy and immunoelectron microscopy revealed that green fluorescent protein (GFP)-tagged DFCP1 was localized on tubular or vesicular elements adjacent to the IM rims. Through detailed morphological analyses, including optimization of a fixation method and electron tomography, we observed a cluster of thin tubular structures between the IM edges and ER, part of which were continuous with IM and/or ER. The formation of these thin tubular clusters was observed in several cell lines and MEFs deficient for Atg5, Atg7, or Atg16L1 but not in FIP200-deficient cells, suggesting that they were relevant to the earlier events in autophagosome formation. Taken together, our findings indicate that these tubular profiles represent a part of the omegasome that links the ER with the IM.
INTRODUCTION
Autophagy is a bulk degradation system in which isolation membrane (IM; also called phagophore) dynamics play an important role in sequestration of a portion of the cytoplasm. The resultant autophagosomes then acquire degradative lysosomal hydrolases by fusing with the endosomal/lysosomal compartments. Recent advances in autophagy research have revealed more than 30 autophagy-related genes (Atg) along with their associated molecules, which coordinately regulate these complex membrane dynamics (1). However, the morphological evidence supporting the functions of these Atg proteins at the submicron level remains ill defined in mammalian cells, which has hampered further study. In particular, there has been a long-standing controversy concerning the membrane source for IMs (2). Two decades ago, a study using immunoelectron microscopy indicated that the rough endoplasmic reticulum (rER), but not the Golgi complex, endosomes, or the plasma membrane, was responsible for supplying membrane components (3). More recently, studies using various sophisticated techniques have proposed that all these organelles, and even mitochondria, could be relevant membrane sources for IMs (4, 5, 6). With regard to ER-derived IMs, foundational studies have recently reported both light and electron microscopic evidence supporting ER-mediated IM formation. Using live-cell imaging, Axe et al. demonstrated that phosphatidylinositol 3-phosphate (PI3P)-enriched compartments were closely associated with rER and may serve as sites for initiation of autophagosome formation (7). The ER-associated compartment that can be labeled by green fluorescent protein (GFP)-tagged DFCP1 (double FYVE domain-containing protein 1) is called the omegasome because of its shape. Moreover, electron tomography clearly showed a direct connection between IMs and rER (8, 9), and immunoelectron microscopy revealed that GFP-DFCP1 is localized on the ER-IM complex, which typically appears as an IM sandwiched by rER (8). These findings support the notion that omegasomes are involved in ER-derived IM formation. Nevertheless, fine structures for punctate and ring-shaped omegasomes at the light-microscopic level, which are largely distinct from IMs, have not been clearly shown. Thus, there is a discrepancy between the observations obtained using light microscopy and electron microscopy. Therefore, the precise molecular mechanisms that correlate with membrane dynamics during the transition process from ER to omegasome and/or IMs have yet to be fully elucidated.
Using Atg3-deficient MEFs (mouse embryonic fibroblasts), we previously demonstrated that the Atg8 conjugation system is essential for proper development and closure of IMs (10). Atg3 works as an E2-like enzyme involved in conjugation of mammalian Atg8 homologues, including LC3 (MAP1 [microtubule-associated protein 1] light chain 3), GABARAP (GABA receptor-associated protein) and GATE-16 (Golgi-associated ATPase enhancer of 16kD), with phosphatidylethanolamine (PE). Atg3 deficiency completely suppressed recruitment of LC3 onto IMs and affected the dissociation of the Atg12-Atg5-Atg16L complex from IMs. Therefore, these changes in molecular behaviors are considered to lead to the accumulation of unclosed IM structures in Atg3-deficient MEFs. Moreover, similar observations have been made by Fujita et al. (11), who employed a dominant negative Atg4B mutant. In the present study, we investigated DFCP1-positive omegasomes in Atg3−/− MEFs and observed the accumulation of hybrid structures composed of both omegasomes and IMs. By detailed electron microscopic analyses in these mutant MEFs as well as in wild-type MEFs, we discovered clusters of thin tubular structures between the edges of IMs and ER, part of which were continuous with IMs and/or ER.
MATERIALS AND METHODS
Cell culture.
Immortalized wild-type and Atg3−/− MEFs were established as described previously (10). Atg7−/− MEFs had been generated previously (12), and Atg5−/− (13), Atg16L1−/− (14), and FIP200−/− (15) MEFs were provided by other groups. Enhanced GFP (EGFP)-tagged mouse DFCP1 cDNA was subcloned into a Moloney murine leukemia virus retroviral vector (pLXSN backbone), which was introduced into the Atg3−/− MEFs. They were cultured in Dulbecco's modified Eagle medium (DMEM) supplemented with 10% fetal bovine serum (FBS), 10 mM sodium pyruvate, MEM nonessential-amino acid solution (GIBCO), GlutaMAX I (GIBCO), 5 μg/ml blasticidin S (Invitrogen), 100 U/ml penicillin, and 100 μg/ml streptomycin at 32.5°C. For cell starvation, cells were incubated in Hanks' balanced salt solution (HBSS) supplemented with 10 mM HEPES for 30 to 120 min.
Immunological analysis.
For immunoblot analysis, MEFs were lysed with ice-cold TNE buffer (10 mM Tris-Cl [pH 7.5], 1% Nonidet P-40, 150 mM NaCl, 1 mM EDTA, and protease inhibitors). The lysates were separated using a NuPAGE system (Life Technologies) on 12% bis-Tris gels in MOPS (morpholinepropanesulfonic acid)-SDS buffer and transferred to a polyvinylidene difluoride (PVDF) membrane. The antibody for GFP (Invitrogen, San Diego, CA) was used in the immunoblot procedure.
Quantitative real-time PCR (qRT-PCR).
The Transcriptor first-strand cDNA synthesis kit (Roche Applied Science, Indianapolis, IN) was used to synthesize cDNA from 1 μg of total RNA. Quantitative PCR was performed using LightCycler 480 Probes Master (Roche Applied Science) on a LightCycler 480 (Roche Applied Science). Signals were normalized to the β-glucuronidase gene (Gusb). The sequences of the primers used were as follows: DFCP1-F, CAGACGAGTACTTCACCTGCTC; DFCP1-R, CCGTGGTTCATGCTGTTCT; Gus-F, CTCTGGTGGCCTTACCTGA; and Gus-R, CTCAGTTGTTGTCACCTTCACC.
Immunofluorescence microscopy.
EGFP-DFCP1 expression was induced by adding 1 μg/ml doxycycline (Dox) for 18 to 24 h, followed by incubation in complete DMEM or HBSS for 120 min. MEFs were fixed with 4% paraformaldehyde in phosphate-buffered saline (PBS) at room temperature for 15 min, permeabilized in 0.1% Triton X-100 in PBS for 5 min, and blocked with 5% normal goat serum in PBS for 30 min. Rabbit anti-Atg16L (16), anti-Tom20 (FL145; Santa Cruz Biotechnology, Inc.), or anti-Atg9A (Abcam; EPR2450[2]) antibodies were used as first antibody, which was detected by donkey anti-rabbit IgG–Alexa Fluor 594 (Molecular Probes). The fluorescence images were obtained using a confocal microscope (FV1000; Olympus) equipped with a UPlan Apo lens (100×; numerical aperture [NA], 1.40).
Electron microscopy.
For conventional fixation, cells were fixed with 2% paraformaldehyde–2% glutaraldehyde in 0.1 M phosphate buffer (pH 7.4) for 10 min at room temperature and then 50 min at 4°C, and rinsed three times for 15 min each time in 7.5% sucrose–0.1 M phosphate buffer (pH 7.4). They were then postfixed with 2% OsO4–3.75% sucrose in 0.05 M phosphate buffer (pH 7.4) for 60 min at 4°C. For the reduced-osmium method, cells were fixed with 2% paraformaldehyde–2% glutaraldehyde in 0.1 M phosphate buffer (pH 7.4) for 10 min at room temperature and then 50 min at 4°C and rinsed three times for 15 min each time in 0.1 M phosphate buffer (pH 7.4). They were then postfixed with 1% OsO4–1.5% tetrapotassium ferrocyanide in 0.1 M phosphate buffer (pH 7.4) for 60 min at 4°C. With regard to our newly developed fixation protocol, cells were fixed with 2% paraformaldehyde–2% glutaraldehyde–2% OsO4 in 0.1 M cacodylate buffer (pH 7.4) for 10 min at 30°C and then 50 min at 4°C. They were rinsed twice in 0.1 M cacodylate buffer (pH 7.4) for 5 min each time. For these three methods, the subsequent dehydration and resin embedding procedures were common and were described previously (17). Serial ultrathin sections (approximately 60 nm) were made and observed with an electron microscope (JEM1200EX; JEOL).
Correlative light and electron microscopy (CLEM).
MEFs were cultured on coverslips coated with 150-μm grids (Matsunami Glass Ind., Ltd.). GFP-DFCP1 expression was induced by adding 1 μg/ml Dox for 18 h, followed by incubation in HBSS for 60 min. Cells were fixed with 2% paraformaldehyde–2% glutaraldehyde in 0.1 M phosphate buffer (pH 7.4) for 15 min at room temperature and rinsed three times for 15 min each time in 0.1 M phosphate buffer (pH 7.4). The fluorescence images were obtained using a confocal microscope (FV1000; Olympus) equipped with a UPlan FLN lens (40×; NA, 1.30). They were fixed again with 2% paraformaldehyde–2% glutaraldehyde in 0.1 M phosphate buffer (pH 7.4) for more than 15 min at 4°C and processed for the reduced-osmium method as described above. Areas containing cells of interest were trimmed from the resin according to the light-microscopic observations, and serial ultrathin sections were made and observed with an electron microscope (JEM1200EX; JEOL).
Electron tomography.
Wild-type MEFs were incubated in HBSS for 30 to 120 min, fixed with 2% paraformaldehyde–2% glutaraldehyde–2% OsO4, and processed for electron microscopy as described above. Sections of 200 nm were prepared and picked up on thin bar grids (EM Japan Co. Ltd., Japan). Ten nanometers of colloidal gold particles were placed on both surfaces of the sections as fiducial markers for alignment of tomograms. The sections were further coated with carbon, followed by observation using a JEM1400 electron microscope (JEOL) at 120 kV. Tilt image series at a magnification of ×30,000 were recorded at 1-degree intervals with a charge-coupled device (CCD) camera over a tilt rage of ±60 degrees, which was automatically operated by TEMography software (System In Frontier Inc., Japan). Three-dimensional (3D) reconstruction and rendering were also performed using TEMography.
Immunoelectron microscopy.
Cells were fixed with 4% paraformaldehyde–0.1% glutaraldehyde in phosphate buffer (pH 7.4). Ultrathin cryosections were prepared and immunolabeled with anti-GFP (Abcam) followed by incubation with secondary antibody conjugated with colloidal gold particles (12 nm). The procedures used for cell freezing, sectioning, and the immunoreactions were described previously (17). The sections were viewed using an electron microscope (JEM1200EX; JEOL). The density of colloidal gold particles per unit length was measured along the ER, IM, and tubular/vesicular structures in 29 profiles of the IM-ER complex. Mitochondrial outer membrane (n = 62) and conventional ER (n = 80) profiles that were not associated with the ER-IM complex were also measured as negative controls. Statistical analysis was performed using Student's t test.
RESULTS
Hybrid structures composed of omegasome and IM accumulated in Atg3-deficient cells.
Autophagic IMs and exogenously expressed GFP-DFCP1 are known to accumulate in the cytoplasm of Atg3−/− MEFs with or without nutrient deprivation (10, 18). To investigate the morphological relationships between IMs and omegasomes at the electron-microscopic level, we generated cell lines in which expression of GFP-DFCP1 can be induced by doxycycline (Dox) from wild-type or Atg3−/− MEFs. Among the cell clones we obtained, we used 3F9 and WF2 cells for Atg3−/− and wild-type MEFs, respectively, which expressed GFP-DFCP1 transcripts and protein at comparable levels after Dox induction for 24 h (Fig. 1A and B). We then examined a time course of the expression after Dox and found that 18 to 24 h of induction was required to detect the protein by Western blotting (Fig. 1C and D). Using these cells, we confirmed by fluorescence microscopy that several GFP-DFCP1-positive dots appeared under nutrient-deprived conditions in wild-type MEFs, whereas they were present under both nutrient-rich and -deprived conditions in Atg3−/− MEFs (Fig. 1E), which has been reported previously for GFP-DFCP1 (7, 18). Moreover, a population of these GFP-DFCP1-labeled dots colocalized with Atg16L-positive dots, representing IMs (Fig. 1E). The extent of colocalization of GFP-DFCP1 and Atg16L varied; some images revealed complete colocalization, partial overlap, or close apposition of the two dots, whereas others showed typical ring-shaped GFP-DFCP1 with an internal Atg16L-positive region (Fig. 1F). We also noticed that in Atg3−/− MEFs, GFP-DFCP1 often showed an atypical ring shape that contained a few large aggregate-like structures along it (Fig. 1F). To estimate the frequency at which IMs associated with omegasomes, we quantified dots that were singly or doubly positive for GFP-DFCP1 and Atg16L. The number of GFP-DFCP1-positive structures in Atg3−/− MEFs was higher than that in wild-type MEFs under nutrient-rich conditions (P < 0.01), and it was significantly increased after nutrient deprivation (P < 0.05) (Fig. 1G). This pattern was similar to that of Atg16L (Fig. 1I), which has been observed in wild-type and Atg3−/− MEFs that showed no GFP-DFCP1 expression (10). Therefore, we conclude that the GFP-DFCP1 overexpression in this experimental system does not significantly perturb starvation-induced autophagy. Importantly, when we compared the ratio of GFP-DFCP1-, Atg16L-positive dots to GFP-DFCP1-positive (Fig. 1H) or Atg16L-positive (Fig. 1J) dots, the number of doubly positive dots was significantly higher (approximately 80%; P < 0.01) in Atg3−/− MEFs under both nutrient-rich and -deprived conditions than in wild-type MEFs under nutrient-deprived conditions (approximately 40% for GFP-DFCP1 or approximately 70% for Atg16L). These results suggested that Atg3 deficiency suppresses an omegasome-to-IM transition process as well as the closing step of IM (10). Moreover, our findings indicated that Atg3−/− MEFs under nutrient-deprived conditions provided a better model for morphological analyses of the omegasome and IM in EM analyses (as described below).
FIG 1.

Accumulation of Atg16L/DFCP1-positive hybrid structures in Atg3−/− MEFs. (A and B) Wild-type and Atg3−/− MEF clones, in which GFP-DFCP1 expression can be induced by Dox, were generated. They were cultured in the presence of 1 μg/ml Dox for 24 h, and the DFCP1 expression at the mRNA (A) and protein (B) levels was estimated with quantitative RT-PCR and immunoblot analysis using anti-GFP antibody (GFP), respectively. Clones derived from wild-type MEFs (WF2) and Atg3-deficient MEFs (3F1-10) as well as wild-type MEFs without transfection (WT) are shown. Asterisks indicate two clones, WF2 and 3F9, which expressed comparable levels of GFP-DFCP1. (C and D) WF2 and 3F9 were cultured in the presence of 1 μg/ml Dox for 0, 3, 6, 12, 18, and 24 h. Then the DFCP1 expression at the mRNA (C) and protein (D) levels was estimated as described above. The arrows indicate the position of GFP-DFCP1. LE and SE indicate long exposure and short exposure, respectively. (E) WF2 and 3F9 MEFs were cultured in the presence of 1 μg/ml Dox and further incubated in nutrient-rich (cont) or HBSS (AA-) solution for 120 min. The cells were fixed and immunostained with anti-Atg16L (red). Bars, 10 μm. (F) Representative images of Atg16L/DFCP1-positive hybrid structures observed in wild-type and Atg3−/− MEFs under nutrient-deprived condition (AA-). Boxed regions are magnified and shown in insets. Bars, 2 μm. (G to J) Statistical analysis of colocalization between GFP-DFCP1 and Atg16L. The numbers of punctuate structures positive for GFP-DFCP1 (G; white bars), Atg16L (I; white bars), and both GFP-DFCP1 and Atg16L (G and I; black bars) per cell are plotted (means and SDs; n = 20 to 25). The ratios (percent) of doubly positive structures to GFP-DFCP1-positive (H) and Atg16L-positive structures (J) are also plotted. *, P < 0.05; **, P < 0.01.
Localization of GFP-DFCP1 by electron microscopic analyses.
To examine the GFP-DFCP1 localization relative to IM, we first carried out correlative light and electron microscopy (CLEM) using Atg3−/− MEFs. As shown in Fig. 2A, when the structure consisting of an intense GFP-DFCP1-positive dot with an associated weak diffuse signal was observed, the dot was localized around the opening of the phagophore, and the weak signal corresponded to the area of the IM. We further obtained similar localization of GFP-DFCP1 in wild-type MEFs (Fig. 2B). However, we so far failed to detect CLEM images for ring-shaped GFP-DFCP1.
FIG 2.

Localization of GFP-DFCP1 by electron microscopic analyses. (A and B) 3F9 (A) and WF2 (B) cells were cultured in the presence of Dox for 18 h to induce GFP-DFCP1 expression and cultured in Hanks' balanced salt solution for 120 min. They were then processed for CLEM as described in Materials and Methods. The boxed regions in the low-magnification images (a′) are magnified and shown in panels b′. Positional alignment of a reflected-light image and an EM image was carried out according to the position of lipid droplets (asterisks). The resulting CLEM images of GFP-DFCP1 and EM are shown. Boxed regions in panels b′ are shown in panels c′, and those of panels c′ are shown on the right. Arrowheads and asterisks in panels c′ indicate the IM and ER, respectively. Note that highly concentrated areas for GFP-DFCP1 (arrows in panels b′) correspond to the opening regions of IMs. Bars, 10 μm (a′) and 0.2 μm (b′ and c′). (C) 3F9 cells were cultured in the presence of Dox for 24 h to induce GFP-DFCP1 expression and then cultured in Hanks' balanced salt solution for 120 min. They were then fixed and processed for immunoelectron microscopy using anti-GFP as described in Materials and Methods. Two examples of a typical isolation membrane (arrowheads) that is sandwiched between two ER membranes (asterisks) are shown. The ER membranes (gray), isolation membranes (white), and tubular or vesicular structures (white; arrow) are roughly traced and shown below the micrographs. Note that colloidal gold particles (12 nm) indicating GFP-DFCP1 are mainly localized on the cluster of tubular or vesicular structures (arrow) adjacent to the rims of the isolation membranes. Bars, 0.2 μm. (D) The line density of colloidal gold particles was measured in the ER, IM, and tubular/vesicular structures (n = 29). Mitochondrial outer membrane (n = 62) and conventional ER (n = 80) profiles that were not associated with the ER-IM complex were also analyzed as negative controls. *, P < 0.05; ***, P < 0.001 (Student's t test).
To obtain more detailed information, we next performed immunoelectron microscopy using ultrathin cryosections in Atg3−/− MEFs. As shown in Fig. 2C, colloidal gold particles indicating GFP-DFCP1 were localized mostly at a space adjacent to the edge of the IM and only rarely along the IM. Interestingly, closer observations revealed that those particles found near the rims of IMs were present on tubular or vesicular membranous elements. When the density of colloidal gold particles was measured in 29 profiles of typical isolation membranes, it was highest in the tubular/vesicular structures (P < 0.001), and the IM was labeled only modestly but slightly more than the associated ER (P < 0.05) (Fig. 2D). These values corresponded well with the observation made by CLEM. Therefore, we concluded that the majority of the dot structures for GFP-DFCP1 observed by light microscopy in Atg3−/− MEFs were composed of tubular and/or vesicular structures.
Morphological detection of IM-associated tubular/vesicular elements by electron microscopy.
The presence of GFP-DFCP1 on tubular and vesicular membranous structures in Atg3−/− MEFs prompted us to study the corresponding structures in wild-type MEFs under nutrient-deprived conditions by conventional electron microscopy. We intensively observed IM profiles at the closing step (phagophores); however, tubular/vesicular elements were never observed in our conventional EM method because of poor morphology (Fig. 3A). A well-known method using potassium ferrocyanide and reduced osmium as the second fixative greatly improved morphology, particularly of IMs, which displayed higher electron densities and tended to have diminished clefts between double membranes. Interestingly, vague membranous elements were often detected at their openings (Fig. 3B). Finally, we optimized a fixation method that used osmium tetroxide along with paraformaldehyde and glutaraldehyde as the primary fixative (see Materials and Methods). This new fixation protocol allowed us to distinctly observe that approximately 88% of phagophores possessed clusters (more than 2 elements) of thin tubular or small vesicular structures near the edges of IMs (Fig. 3C; Fig. 4A and B). These structures appeared to be uncoated, with a mean diameter of 30.4 ± 4.7 nm (measured in 81 IMs) (Fig. 3D), which was an extraordinarily small size, comparable to that of ribosomes associated with the ER (Fig. 3C and D). We then analyzed Atg3−/− MEFs and could easily observe (approximately 88% of phagophores) a large cluster of tubular or vesicular structures that appeared to occupy the gap between the edges of IMs (Fig. 4C and D). The mean diameter of tubules/vesicles was 34.2 ± 4.7 nm (measured in 110 phagophores), slightly bigger (P < 0.05) than that in wild-type MEFs (Fig. 3D). We also noticed that the phagophores occasionally contained multiple (2 to 5) IMs, some of which showed a stacked appearance (Fig. 4C and D). However, such structures were rarely detected in wild-type MEFs (Fig. 3F). These multiple IMs would explain the presence of an aberrant cluster of multiple autophagosomal structures in Atg3−/− MEFs, which was previously detected using a conventional fixation method (10). When we counted the number of tubular/vesicular profiles per phagophore, we found that there was no significant difference (P = 0.07) between wild-type (9.3 ± 6.3; n = 81) and Atg3−/− (11.2 ± 8.3; n = 110) MEFs (Fig. 3E). These results strongly suggested that the appearance of these tubular/vesicular structures was caused not merely by Atg3 deficiency but rather by a physiological phenomenon associated with starvation-induced autophagy. Here, we refer to these structures as IM-associated tubular/vesicular structures (IMATs). Moreover, because IMATs resembled the GFP-DFCP1-positive tubular/vesicular structures observed in immunoelectron microscopy in terms of the size, morphology, and position, we concluded that IMATs corresponded to part of the omegasome.
FIG 3.

Analyses of thin tubular or vesicular structures associated with IMs by transmission electron microscopy. (A to C) Comparison of IM-associated tubular or vesicular structures (IMATs) between three fixation methods. Wild-type MEFs were incubated in HBSS for 2 h and fixed with conventional 2% paraformaldehyde (PFA)–2% glutaraldehyde (GA) (A), potassium ferrocyanide–reduced osmium (OsO4) (B), or the newly developed fixation (2% PFA–2% GA–2% OsO4) (C) method. Arrowheads indicate IMs, and arrows indicate IMATs. Bars, 200 nm (50 nm in insets). Diameter (D) and the numbers of IMAT elements (E) and IMs (F) were measured in the IM profiles in Atg3+/+ and Atg3−/− MEFs. The number of IMATs and IMs are shown as histograms (D), in which the means and SDs are indicated. Note that IMATs are slightly bigger in Atg3−/− MEFs than in Atg3+/+ MEFs (P < 0.05) and that more IMs were observed in Atg3−/− MEFs than in Atg3+/+ MEFs (*, P < 0.001).
FIG 4.

Analyses of IMATs in serial ultrathin sections by transmission electron microscopy. Wild-type (A and B) and Atg3-deficient (C and D) MEFs were deprived of amino acids by incubation in HBSS for 120 min. They were fixed with 2% PFA–2% GA–2% OsO4 and processed for electron microscopy as described in Materials and Methods. Serial sections (60 nm) were made and observed (section numbers are indicated in the upper right corners). For each series, three parts are enlarged and shown in panels a′, b′, and c′, as indicated. Note that there are numerous tubular or vesicular profiles in the vicinity of the edges of the IMs in both Atg3+/+ and Atg3−/− MEFs. Parts of these are often continuous with IM (triple arrowheads) or the rough ER (arrows), which is identified by the presence of associated ribosomes (asterisks). It should also be noted that in Atg3−/− MEFs (C and D), multiple IMs are observed.
Continuity of IMATs with ER or IMs.
If IMATs function as intermediate structures between ER and IMs during the autophagy process, then they should, at least in part, be continuous with the ER or IMs. To confirm this assumption, we observed serial sections of IMs closely associated with the ER. In many cases of wild-type and Atg3−/− MEFs (Fig. 4), portions of the ER domain that faced the edges of IMs possessed numerous thin tubular structures that appeared to emanate from the ER (arrows) and projected into the regions of IMATs. Moreover, part of IMATs were also continuous with IMs (triple arrowheads). In addition, there were some thin tubules that directly connected the IMs and ER (Fig. 4A, panel c′, and C, panel a′). To increase the resolution along the z axis, we further investigated wild-type MEFs by electron tomography. We reconstructed 3D views of 10 phagophore profiles from 200-nm resin-embedded sections, 2 examples of which are shown in Fig. 5. We found that IMATs were mainly composed of tubular structures, and confirmed that some of them were continuous with IMs (Fig. 5D and H; also, see Movies S2 and S4 in the supplemental material) or the ER (Fig. 5E and I; also, see Movies S2 and S5 in the supplemental material). When the continuities were counted per IMAT, we found that 1.6 ± 1.2, 1.3 ± 1.2, and 0.6 ± 0.7 (mean ± standard deviation [SD]) tubules in IMATs were continuous with the IM, the ER, and both structures, respectively (Table 1). Therefore, approximately 3.5 ± 2.0 thin tubules were found in the opening of phagophore within a 200-nm thickness. These results indicate that IMATs represent intermediate structures between the ER and IM. Interestingly, when the tubular elements transformed into IMs, they lost their luminal spaces and became flattened double-membrane structures (Fig. 5D and H; also, see Movies S2 and S4 in the supplemental material), implying that membranous components were altered at these boundaries or that some physical forces pressed the IM domains.
FIG 5.

Electron tomography of IMATs in wild-type MEFs. Wild-type MEFs were incubated in HBSS for 30 to 120 min and fixed with 2% PFA–2% GA–2% OsO4 for electron tomography. (A and F) Projected images of typical two-phagophore profiles that consist of 75 and 51 slices, respectively (see also Movies S1 and S4 in the supplemental material). (A to E) The boxed region in panel A was selected for generating 3D models (B), from which 4 tubules were extracted and are shown in panel C and in Movie S2 in the supplemental material. Two series of xy images (D and E) were extracted from the 3D data and are shown in order. (D) Serial images, each of which consists of 12 slices. (E) Selected images. Slice numbers are indicated at the bottom. See Movie S3 in the supplemental material for whole z-stacked data for panels D and E. Note that tubular elements (green arrowheads) within the IMATs transform into the electron-dense IM (D, blue arrowheads) or the ER, which possesses ribosomes (E, yellow arrowhead). Bars, 100 nm. (F to I) The boxed region in panel F was selected for generating 3D models (G) (see Movies S4, S5, and S6 in the supplemental material). xy images of two regions in panels G are shown in panels H and I (see Movies S7 and S8 in the supplemental material). Note that in panel H, tubular elements (green arrowheads) transform into the electron-dense IM (blue arrowheads) and that in panel I, the ER, which possesses ribosomes (C, yellow arrowheads), is connected with at least two tubular elements of the IMAT (images #20 and #38). Bars, 100 nm (F and G) and 50 nm (H and I).
TABLE 1.
Continuities of IMATs to the ER and IMs
| Profile | No. of tubular continuities/IM profile in 200-nm sections |
|||
|---|---|---|---|---|
| To IM | To ER | To both IM and ER | Total | |
| 1 | 1 | 1 | 0 | 2 |
| 2 | 0 | 2 | 2 | 4 |
| 3 | 1 | 2 | 1 | 4 |
| 4 | 1 | 0 | 1 | 2 |
| 5 | 1 | 1 | 0 | 2 |
| 6 | 1 | 1 | 0 | 2 |
| 7 | 2 | 0 | 0 | 2 |
| 8 | 3 | 1 | 1 | 5 |
| 9 | 2 | 1 | 1 | 4 |
| 10 | 4 | 4 | 0 | 8 |
| Mean ± SD | 1.6 ± 1.2 | 1.3 ± 1.2 | 0.6 ± 0.7 | 3.5 ± 2.0 |
IMATs in other cell lines and MEFs deficient in Atg5, Atg7, Atg16L1, or FIP200.
IMATs were also observed in other cell lines, including ARPE-19 (human retinal epithelial cell line), Huh-1 (human hepatoma cell line), HeLa (human cervical carcinoma cell line), and NRK (normal rat kidney cell line), and importantly, some of them were connected with the ER or IMs (Fig. 6A to D). These results strongly suggested that the appearance of IMATs is a universal phenomenon during starvation-induced autophagy. Next, we investigated the presence of IMATs in Atg5−/−, Atg7−/−, Atg16L1−/−, or FIP200−/− MEFs. We first examined if the autophagosomal structures were observed in these cell lines because starvation-induced autophagosomes at the electron-microscopic level have been described only for Atg5−/− mouse embryonic stem cells (19) and Atg7−/− hepatocytes (12), not for MEFs. As shown in Fig. 6E and F, the number of structures including phagophores and autophagosomes was significantly increased by amino acid deprivation in Atg5−/−, Atg7−/−, and Atg16L1−/− MEFs, as well as the wild-type and Atg3−/− MEFs. However, in FIP200−/− MEFs, these structures were rarely detected or induced under amino acid starvation. This result indicated that morphologically identified IMs could be formed in the absence of the Atg conjugation system. When we carefully observed the opening regions of IMs, we found IMATs that appeared to emanate from the ER (Fig. 6F). Approximately 96.6% (n = 59), 85.9% (n = 64), and 94.2% (n = 59) of phagophore profiles possessed IMATs in Atg5−/−, Atg7−/−, and Atg16L1−/− MEFs, respectively. Therefore, we concluded that the formation of IMATs would not be dependent on the function of Atg conjugation systems.
FIG 6.

IMATs were detected in other cell lines and MEFs deficient in Atg5, Atg7, or Atg16L1 but not in FIP200-deficient MEFs. (A to D) ARPE-19 (human retinal epithelial cell line) (A), Huh-1 (human hepatoma cell line) (B), HeLa (human cervical carcinoma cell line) (C), and NRK (normal rat kidney cell line) (D) cells were incubated in HBSS for 120 min and then fixed with 2% PFA–2% GA–2% OsO4. Representative images of IMs (arrowheads) are shown. Note that several thin tubular elements (arrows) are present in the opening area of IMs, part of which appears to emanate from the nearby ER (asterisks). Bars, 200 nm (50 nm in insets). (E and F) Wild-type (WT) MEFs and mutant MEFs from Atg3−/−, Atg5−/−, Atg7−/−, Atg16L1−/−, and FIP200−/− mice were incubated in complete (+) or HBSS (−) medium for 2 h and then fixed with 2% PFA–2% GA–2% OsO4. (E) The numbers of IMs and autophagosomes per 100 μm2 were quantified and expressed as the means and SDs (n = 26 to 43; *, P < 0.005). (F) Representative IM profiles in Atg5−/−, Atg7−/−, and Atg16L1−/− MEFs. Note that several thin tubular elements are present in the areas adjacent to the IM rims, some of which appear to emanate from the nearby ER (asterisks). The phagophore (arrow) in Atg7−/− MEFs has multiple IMs. Bars, 200 nm.
Association of mitochondria and Atg9 vesicles with IMATs.
Because mitochondria and Atg9 vesicles have been reported to be involved in the generation of autophagosomes (4, 6, 20), we explored these possibilities in our experimental system. When the mitochondrial marker Tom20 was immunolabeled in wild-type and Atg3−/− MEFs, in which GFP-DFCP1 expression was induced and which were then incubated under nutrient-deprived conditions for 2 h, 63.5% ± 12.8% (n = 10) and 74.5% ± 19.3% (n = 10) of GFP-DFCP1-positive structures were colocalized or closely associated with Tom20 in wild-type and Atg3−/− MEFs, respectively (Fig. 7A). We further measured the distance between mitochondria and the IM or IMAT in electron microscopy. In approximately 60% of the IM or IMAT profiles, mitochondria were found within 400 nm (Fig. 7B). Although we failed to detect direct contact between them, this level of proximity is consistent with the previous results of light-microscopic observation (20). Next, we examined endogenous Atg9 in the MEFs as described above and found that 40.7% ± 6.9% (n = 10) and 49.0% ± 24.1% (n = 10) of GFP-DFCP1-positive structures were colocalized with Atg9 dots in wild-type and Atg3−/− MEFs, respectively. However, it was also noted that most of the colocalizations were partial; the shapes of the two signals rarely coincided with each other (Fig. 7C). Together, these results suggest that mitochondria and Atg9 vesicles may be involved in the IMAT formation.
FIG 7.

GFP-DFCP1-positive structures are closely associated with mitochondria or Atg9-positive structures. (A and C) WF2 (wild-type) and 3F9 (Atg3−/−) MEFs were cultured in the presence of 1 μg/ml Dox and further incubated under nutrient-deprived conditions (AA-) for 120 min. The cells were fixed and immunostained with anti-Tom20 (A) or anti-Atg9 (C) antibody. Boxed regions are magnified and shown in insets. Arrowheads indicate GFP-DFCP1-positive dots that colocalized or are closely associated with Tom20 or Atg9. Bars, 20 μm. (B) The distance between mitochondria and IMs (n = 103) or IMATs (n = 76) was measured in EM pictures, each of which had a margin of at least 400 nm around the profile. The results are shown as histograms.
DISCUSSION
Since the first description of the omegasome (7), its structure at the EM level has not been well documented. To the best of our knowledge, we have demonstrated for the first time that DFCP1-positive omegasomes are not necessarily flat membrane domains but instead are composed of clusters of tubular structures. Previous studies employing electron tomography have revealed direct thin tubular connections between the IM and ER membrane. Hayashi-Nishino et al. (8) found a single tubular connection between an edge of the IM and ER for each ER-IM complex, while Ylä-Anttila et al. (9) demonstrated some connections or contacts between the IM and ER at both open edges and other parts along the membranes. If these tubular elements correspond to omegasomes, their scarcity would not be able to explain ring or dot structures of omegasomes that are distinct from IMs. In the present study, we found by using a new fixation method that there were actually several tubular structures (IMATs) between ER and IM rims during the closing step. It is probable that several morphological studies using electron microscopy missed the presence of tubular structures near the IM edge because of using conventional fixation methods. The finding of IMATs strongly supports the argument of the previous two reports that IM is derived from the ER and, further, leads to the conclusion that the area occupied by IMATs might correspond to part of the omegasome in terms of the shape, size, and position (between the ER and IM) at the light-microscopic level.
The diameter of the IMAT elements is approximately 30 nm, which is much smaller than known vesicular or tubular structures. For example, ER exit sites contain ∼50-nm-diameter vesicles and 150- to 200-nm-long dumbbell-shaped tubules (21), and transport carriers mediating the trans-Golgi network (TGN)-to-endosome transport range from typical 60- to 100-nm clathrin-coated vesicles to larger convoluted tubular/vesicular structures with several coated buds (22). In Saccharomyces cerevisiae, it has been shown that approximately 30-nm diameter Atg9-labeled vesicles are involved in the initial step of autophagosome formation (23, 24, 25). Orsi et al. (6) showed that in mammalian cells, mRFP-Atg9 interacts dynamically with phagophores or autophagosomes but does not become a stable part of the autophagosome membrane and that it localizes on tubulovesicular structures near endosomal vacuoles in HEK293 cells. They also argued that Atg9 would not be incorporated into precursor autophagosomes according to the CLEM data, even if a small fraction (approximately 16%) of GFP-DFCP1 was partially colocalized with endogenous Atg9 by fluorescence microscopy. In the present study, immunofluorescence data showed significant colocalizations (40 to 50%) between GFP-DFCP1 and endogenous Atg9. Importantly, however, most of the colocalizations were only partial, suggesting that Atg9 might be associated with but not incorporated into DFCP1-containing structures, as reported previously (6). Therefore, though the tubulovesicular nature of Atg9-containing structures is similar to that of IMATs, we suppose that they are distinct membranous structures but are closely associated with each other. Further analyses at EM levels would be required to clarify the detailed relationship between them. Very recently, Ge et al. (26) reported that the membrane fraction of the ER-Golgi intermediate compartment (ERGIC), but not the bulk ER membrane, is the key for the LC3 lipidation, suggesting the presence of some modifications during the transition from the ER into IM. We infer that IMAT formation is one of the modifications.
Recently, Hamasaki et al. (20) have shown that the ER-mitochondrion contact site is involved in IM formation. This report reconciled well two models for the origin of IMs: the ER (8, 9) and the mitochondria (4). Unfortunately, our analyses could not support a direct contribution of mitochondria to IM or IMAT formation (Fig. 7A). This could be explained by the notion that the ER-mitochondrion contacts are not stable but oscillate within a certain distance, as demonstrated previously (20).
Notably, we mainly observed closing steps during autophagosome formation; therefore, it is unknown if IMATs are actually involved in the earlier steps of IM biogenesis. However, the formation of both IMATs and IMs was dependent on the presence of FIP200 but not Atg3, Atg5, Atg7, or Atg16L1. This result strongly suggests that IMATs are heavily involved in the earlier steps of IM formation before the recruitment of the Atg conjugation system. So, how could IMATs be involved in the initiation steps of the IM formation? Previous observations of omegasome dynamics in living cells (7) revealed that an ER domain transforms into a disc-like structure with DFCP1 on the perimeter and LC3 inside it, the latter of which then invaginates to form the IM. On the other hand, electron tomography data clearly demonstrated the ER-IM complex, in which an IM is sandwiched by inside and outside ER elements (8). To satisfy these structural and positional conditions together with our present findings that IMATs correspond to a portion of the omegasome, we infer that a starvation-induced ER-derived IM would be formed as follows: several fine tubular structures emanate from an ER domain, forming the omegasome or IMATs, and its tubular elements fuse with each other or with the preformed IM during the initiation steps of the autophagy process (Fig. 8). Since we have not obtained morphological evidence for the presence of IMATs at the earlier step, further studies will be required to prove this hypothesis.
FIG 8.
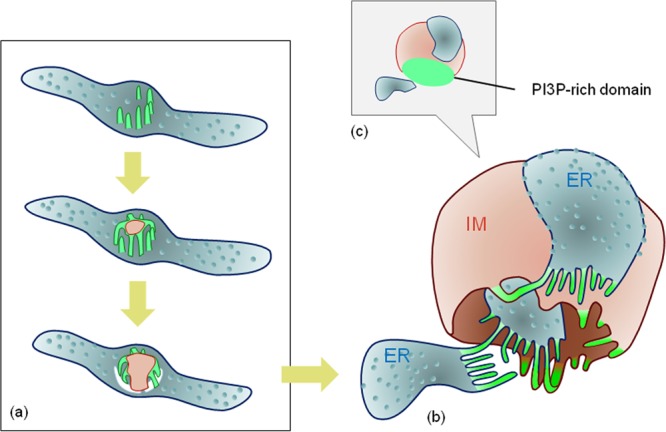
Model of IM biogenesis in relation to the ER and IMATs. (a) A working hypothesis for the initiation step of IM formation at the ER domain is depicted (see the text for more details). (b) At the closing step of IM formation, the IM and ER possess several thin tubules (IMATs) between them, some of which connect both structures (arrows), as shown in this study. (c) PI3P-rich domain. The omegasome, with a dot appearance at light-microscopic levels, corresponds to the IMAT area. Pink, IM; light blue, ER (with ribosomes); green, IMATs.
According to this model and previous reports (8, 9), it is reasonable to suppose that the IM lipids are supplied through its edge region. However, Ylä-Anttila et al. (9) observed that there were additional connections between the ER and IM in the part other than the edge region. In fact, we observed some contacts between the two membranes (2.7 ± 3.0 per IM), but with no apparent continuity between them. Although the lipid transfer mechanism is not clear at present, our data do not exclude the possibility that the IM expansion occurs through these contact sites.
Because IMATs were consistently observed during starvation-induced, ER-derived autophagy in several cell lines, these typical structures could be used as indicators for future morphological investigations. Here, we introduce the idea that the transient appearance of IMATs is important during IM formation, and this identification of IMATs should promote research into the molecular mechanisms controlling the biogenesis of IMs at the ER.
Supplementary Material
ACKNOWLEDGMENTS
We thank Noboru Mizushima for providing Atg5−/− MEF and anti-Atg16L antibody and Shizuo Akira and Jun-Lin Guan for providing Atg16L1−/− and FIP200−/− MEFs, respectively. We also thank K. Kanno (Fukushima Medical University School of Medicine) for his help in electron microscopy and all the members of our department for helpful discussion.
This work was supported by JSPS KAKENHI grants 21659045 and 24390048 (to S. Waguri) and by grants from Fukushima Medical University (to A. Kametaka and T. Uemura).
Footnotes
Published ahead of print 3 March 2014
Supplemental material for this article may be found at http://dx.doi.org/10.1128/MCB.01327-13.
REFERENCES
- 1.Mizushima N. 2007. Autophagy: process and function. Genes Dev. 21:2861–2873. 10.1101/gad.1599207 [DOI] [PubMed] [Google Scholar]
- 2.Kovacs AL, Palfia Z, Rez G, Vellai T, Kovacs J. 2007. Sequestration revisited: integrating traditional electron microscopy, de novo assembly and new results. Autophagy 3:655–662 https://www.landesbioscience.com/journals/autophagy/article/4590/?nocache=446077174 [DOI] [PubMed] [Google Scholar]
- 3.Dunn WA., Jr 1990. Studies on the mechanisms of autophagy: formation of the autophagic vacuole. J. Cell Biol. 110:1923–1933. 10.1083/jcb.110.6.1923 [DOI] [PMC free article] [PubMed] [Google Scholar]
- 4.Hailey DW, Rambold AS, Satpute-Krishnan P, Mitra K, Sougrat R, Kim PK, Lippincott-Schwartz J. 2010. Mitochondria supply membranes for autophagosome biogenesis during starvation. Cell 141:656–667. 10.1016/j.cell.2010.04.009 [DOI] [PMC free article] [PubMed] [Google Scholar]
- 5.Ravikumar B, Moreau K, Jahreiss L, Puri C, Rubinsztein DC. 2010. Plasma membrane contributes to the formation of pre-autophagosomal structures. Nat. Cell Biol. 12:747–757. 10.1038/ncb2078 [DOI] [PMC free article] [PubMed] [Google Scholar]
- 6.Orsi A, Razi M, Dooley HC, Robinson D, Weston AE, Collinson LM, Tooze SA. 2012. Dynamic and transient interactions of Atg9 with autophagosomes, but not membrane integration, are required for autophagy. Mol. Biol. Cell 23:1860–1873. 10.1091/mbc.E11-09-0746 [DOI] [PMC free article] [PubMed] [Google Scholar]
- 7.Axe EL, Walker SA, Manifava M, Chandra P, Roderick HL, Habermann A, Griffiths G, Ktistakis NT. 2008. Autophagosome formation from membrane compartments enriched in phosphatidylinositol 3-phosphate and dynamically connected to the endoplasmic reticulum. J. Cell Biol. 182:685–701. 10.1083/jcb.200803137 [DOI] [PMC free article] [PubMed] [Google Scholar]
- 8.Hayashi-Nishino M, Fujita N, Noda T, Yamaguchi A, Yoshimori T, Yamamoto A. 2009. A subdomain of the endoplasmic reticulum forms a cradle for autophagosome formation. Nat. Cell Biol. 11:1433–1437. 10.1038/ncb1991 [DOI] [PubMed] [Google Scholar]
- 9.Ylä-Anttila P, Vihinen H, Jokitalo E, Eskelinen EL. 2009. 3D tomography reveals connections between the phagophore and endoplasmic reticulum. Autophagy 5:1180–1185. 10.4161/auto.5.8.10274 [DOI] [PubMed] [Google Scholar]
- 10.Sou YS, Waguri S, Iwata J, Ueno T, Fujimura T, Hara T, Sawada N, Yamada A, Mizushima N, Uchiyama Y, Kominami E, Tanaka K, Komatsu M. 2008. The Atg8 conjugation system is indispensable for proper development of autophagic isolation membranes in mice. Mol. Biol. Cell 19:4762–4775. 10.1091/mbc.E08-03-0309 [DOI] [PMC free article] [PubMed] [Google Scholar]
- 11.Fujita N, Hayashi-Nishino M, Fukumoto H, Omori H, Yamamoto A, Noda T, Yoshimori T. 2008. An Atg4B mutant hampers the lipidation of LC3 paralogues and causes defects in autophagosome closure. Mol. Biol. Cell 19:4651–4659. 10.1091/mbc.E08-03-0312 [DOI] [PMC free article] [PubMed] [Google Scholar]
- 12.Komatsu M, Waguri S, Ueno T, Iwata J, Murata S, Tanida I, Ezaki J, Mizushima N, Ohsumi Y, Uchiyama Y, Kominami E, Tanaka K, Chiba T. 2005. Impairment of starvation-induced and constitutive autophagy in Atg7-deficient mice. J. Cell Biol. 169:425–434. 10.1083/jcb.200412022 [DOI] [PMC free article] [PubMed] [Google Scholar]
- 13.Kuma A, Hatano M, Matsui M, Yamamoto A, Nakaya H, Yoshimori T, Ohsumi Y, Tokuhisa T, Mizushima N. 2004. The role of autophagy during the early neonatal starvation period. Nature 432:1032–1036. 10.1038/nature03029 [DOI] [PubMed] [Google Scholar]
- 14.Saitoh T, Fujita N, Jang MH, Uematsu S, Yang BG, Satoh T, Omori H, Noda T, Yamamoto N, Komatsu M, Tanaka K, Kawai T, Tsujimura T, Takeuchi O, Yoshimori T, Akira S. 2008. Loss of the autophagy protein Atg16L1 enhances endotoxin-induced IL-1beta production. Nature 456:264–268. 10.1038/nature07383 [DOI] [PubMed] [Google Scholar]
- 15.Gan B, Peng X, Nagy T, Alcaraz A, Gu H, Guan JL. 2006. Role of FIP200 in cardiac and liver development and its regulation of TNFalpha and TSC-mTOR signaling pathways. J. Cell Biol. 175:121–133. 10.1083/jcb.200604129 [DOI] [PMC free article] [PubMed] [Google Scholar]
- 16.Mizushima N, Kuma A, Kobayashi Y, Yamamoto A, Matsubae M, Takao T, Natsume T, Ohsumi Y, Yoshimori T. 2003. Mouse Apg16L, a novel WD-repeat protein, targets to the autophagic isolation membrane with the Apg12-Apg5 conjugate. J. Cell Sci. 116:1679–1688. 10.1242/jcs.00381 [DOI] [PubMed] [Google Scholar]
- 17.Waguri S, Komatsu M. 2009. Biochemical and morphological detection of inclusion bodies in autophagy-deficient mice. Methods Enzymol. 453:181–196. 10.1016/S0076-6879(08)04009-3 [DOI] [PubMed] [Google Scholar]
- 18.Itakura E, Mizushima N. 2010. Characterization of autophagosome formation site by a hierarchical analysis of mammalian Atg proteins. Autophagy 6:764–776. 10.4161/auto.6.6.12709 [DOI] [PMC free article] [PubMed] [Google Scholar]
- 19.Mizushima N, Yamamoto A, Hatano M, Kobayashi Y, Kabeya Y, Suzuki K, Tokuhisa T, Ohsumi Y, Yoshimori T. 2001. Dissection of autophagosome formation using Apg5-deficient mouse embryonic stem cells. J. Cell Biol. 152:657–668. 10.1083/jcb.152.4.657 [DOI] [PMC free article] [PubMed] [Google Scholar]
- 20.Hamasaki M, Furuta N, Matsuda A, Nezu A, Yamamoto A, Fujita N, Oomori H, Noda T, Haraguchi T, Hiraoka Y, Amano A, Yoshimori T. 2013. Autophagosomes form at ER-mitochondria contact sites. Nature 495:389–393. 10.1038/nature11910 [DOI] [PubMed] [Google Scholar]
- 21.Zeuschner D, Geerts WJ, van Donselaar E, Humbel BM, Slot JW, Koster AJ, Klumperman J. 2006. Immuno-electron tomography of ER exit sites reveals the existence of free COPII-coated transport carriers. Nat. Cell Biol. 8:377–383. 10.1038/ncb1371 [DOI] [PubMed] [Google Scholar]
- 22.Polishchuk RS, San Pietro E, Di Pentima A, Tete S, Bonifacino JS. 2006. Ultrastructure of long-range transport carriers moving from the trans Golgi network to peripheral endosomes. Traffic 7:1092–1103. 10.1111/j.1600-0854.2006.00453.x [DOI] [PubMed] [Google Scholar]
- 23.Mari M, Griffith J, Rieter E, Krishnappa L, Klionsky DJ, Reggiori F. 2010. An Atg9-containing compartment that functions in the early steps of autophagosome biogenesis. J. Cell Biol. 190:1005–1022. 10.1083/jcb.200912089 [DOI] [PMC free article] [PubMed] [Google Scholar]
- 24.Nair U, Jotwani A, Geng J, Gammoh N, Richerson D, Yen WL, Griffith J, Nag S, Wang K, Moss T, Baba M, McNew JA, Jiang X, Reggiori F, Melia TJ, Klionsky DJ. 2011. SNARE proteins are required for macroautophagy. Cell 146:290–302. 10.1016/j.cell.2011.06.022 [DOI] [PMC free article] [PubMed] [Google Scholar]
- 25.Yamamoto H, Kakuta S, Watanabe TM, Kitamura A, Sekito T, Kondo-Kakuta C, Ichikawa R, Kinjo M, Ohsumi Y. 2012. Atg9 vesicles are an important membrane source during early steps of autophagosome formation. J. Cell Biol. 198:219–233. 10.1083/jcb.201202061 [DOI] [PMC free article] [PubMed] [Google Scholar]
- 26.Ge L, Melville D, Zhang M, Schekman R. 2013. The ER-Golgi intermediate compartment is a key membrane source for the LC3 lipidation step of autophagosome biogenesis. Elife 2:e00947. 10.7554/eLife.00947 [DOI] [PMC free article] [PubMed] [Google Scholar]
Associated Data
This section collects any data citations, data availability statements, or supplementary materials included in this article.