

Abstract
We studied whether the Etest can be used as an alternative to agar dilution to determine antimicrobial susceptibilities of ceftriaxone, cefixime, and cefpodoxime in Neisseria gonorrhoeae surveillance. One hundred fifteen clinical and laboratory isolates of N. gonorrhoeae were tested following the Clinical Laboratory Improvement Amendments (CLIA)-approved CLSI standard agar dilution method and, separately, by the Etest according to the manufacturer's recommendations. The MICs were determined and compared. Ten laboratory-generated mutants were used to simulate substantially nonsusceptible specimens. The Etest and agar dilution methods were well correlated. Statistical tests produced regression R2 values of 88%, 82%, and 85% and Pearson correlation coefficients of 92%, 91%, and 92% for ceftriaxone, cefixime, and cefpodoxime, respectively. When paired comparisons were made, the two tests were 88.7%, 80%, and 87% within 1 log2 dilution from each other for ceftriaxone, cefixime, and cefpodoxime, respectively. The within-2-log2 agreements were 99.1%, 98.3%, and 94.8% for ceftriaxone, cefixime, and cefpodoxime, respectively. Notwithstanding the good correlations and the within-2-log2 general agreement, the Etest results produced slightly lower MICs than the agar dilution results. In conclusion, we found that the Etest can be effectively used as an alternative to agar dilution testing to determine the susceptibility of N. gonorrhoeae to ceftriaxone, cefixime, and cefpodoxime, although we recommend further research into extremely resistant isolates. For isolates within the typical range of clinical MICs, reexamination of the Etest interpretation of susceptible and nonsusceptible categories would likely allow for successful transition from agar dilution to the Etest.
INTRODUCTION
Neisseria gonorrhoeae causes gonorrhea, which is the second most prevalent sexually transmitted bacterial disease in the United States. Its high morbidity rate and associated medical and socioeconomic consequences make it a major public health issue in the United States and in the world. N. gonorrhoeae usually develops worldwide antimicrobial resistance to the drug of choice within a few years of its introduction (1, 2, 3, 4). Clinical penicillin-resistant isolates are widespread; thus, penicillin is not currently recommended for treatment (5, 6). Fluoroquinolone resistance is also common; since 2007, this drug has not been recommended as a treatment option for gonorrhea in the United States (7). This leaves the extended-spectrum cephalosporins (ESC) as the only choice for treating gonorrhea.
Currently, the CDC recommends treating uncomplicated gonorrhea infection with one intramuscular injection of ceftriaxone (250 mg) and one oral dose of azithromycin (1 g). When ceftriaxone is not available, one 400-mg oral dose of cefixime plus azithromycin is to be used (8). In the past several years, increasing occurrences of treatment failures to the first-line antigonococcal drugs, the ESCs (such as ceftriaxone and cefixime), have been reported in several regions (3, 4, 9). In 2006, Japan removed cefixime from its recommended treatment guideline because of reports of treatment failures (4, 10, 11). Similar treatment failures have been reported in Europe (5). In the United States, the percentages of isolates with cefixime MICs of ≥0.125 μg/ml increased from 0% to 3.3% from 2000 to 2010. Similar changes have been observed for ceftriaxone; isolates with MICs of ≥0.125 μg/ml increased from 0% to 0.5% from 2000 to 2010 (8). Despite these reports, actual large-scale ESC treatment failures in urogenital gonorrhea have not been observed in the United States. This makes it critically important to monitor the gradual change of susceptibilities to these first-line antibiotics. Because of the ability of N. gonorrhoeae to rapidly develop drug resistance, a timely and accurate surveillance system such as the Gonococcal Isolate Surveillance Project (GISP) is necessary (12). This system depends on the capability of laboratories to reliably and quickly perform in vitro antimicrobial susceptibility testing of clinical isolates.
At present, the agar dilution test is the gold standard for quantitatively determining MIC values and the antimicrobial susceptibility for the drug of choice against N. gonorrhoeae isolates. However, the test is laborious and time-consuming, and for certain reference laboratories that receive limited numbers of N. gonorrhoeae specimens, performing agar dilution routinely is not feasible. Thus, this test is performed only by limited central reference laboratories. Another method used for the determination of N. gonorrhoeae drug resistance is the disk diffusion method. While the disk diffusion test is relatively easy to perform, the results have large variations, and it is therefore unable to measure small changes in antimicrobial susceptibilities. With the slow yet steady rise in the number of isolates with reduced susceptibilities, there is an immediate need to adapt a simplified yet sensitive method for reference laboratories to quantitatively measure the in vitro antimicrobial susceptibility of N. gonorrhoeae.
The Etest (bioMérieux, France) is an antimicrobial susceptibility test that can quantitatively measure the MIC values of antimicrobial agents (13, 14, 15, 16). The Etest, which utilizes a plastic strip, contains a continuous gradient of specific antibiotics on one side and the relevant concentrations encoded on the other side. The principle is similar to that of the disk diffusion test; thus, the test is relatively easy to perform compared with the agar dilution method. The Etest generates a specific MIC value and therefore may be appropriate for use as an alternative to routine laboratory testing, as would occur in surveillance. The Etest has been compared with standard testing methods for several bacterial species and antibiotics (13, 14). Generally speaking, good agreements with standard reference methods have been reached.
In this study, we compared the agar dilution test and the Etest for their abilities to measure the MIC values of three antibiotics, ceftriaxone, cefixime, and cefpodoxime, using 105 GISP N. gonorrhoeae isolates. We also included 10 laboratory-generated mutants that we selected based on their nonsusceptibility to the three ESCs to imitate potential clinical drug-resistant isolates.
MATERIALS AND METHODS
N. gonorrhoeae isolates.
One hundred five confirmed N. gonorrhoeae isolates from various locations in the United States, including GISP isolates and reference strains, were used. In addition, 10 specimens of laboratory-derived mutants that are nonsusceptible to cefpodoxime were selected (see below). All isolates were confirmed by passaging and selection using modified Thayer-Martin medium (Scientific Resources Program [SRP], CDC).
Mutation generation.
The laboratory-generated mutations were selected for increased cephalosporin MICs by exposing parent strain SPN284 or GC3502 to elevated concentrations of cefpodoxime (3.0 μg/ml or 4.5 μg/ml). The specific concentrations of cefpodoxime were included in enriched GC agar base medium plates, and 2 to 4 × 10¹² CFU of the parent strain was inoculated. The resulting growths were selected and maintained with GC agar base medium supplemented with 1% IsoVitaleX (Sigma-Aldrich, MO).
Antimicrobial susceptibility testing.
The agar dilution test and the Etest (bioMérieux, France) were performed using GC agar base medium supplemented with 1% IsoVitaleX. The agar dilution test was performed according to the Clinical and Laboratory Standards Institute (CLSI; formerly National Committee for Clinical Laboratory Standards) agar dilution method (17, 18), and the Etest was performed according to the manufacturer's recommendations. The Etest and the agar dilution test were prepared by suspending colonies of N. gonorrhoeae from an overnight chocolate II agar (SRP, CDC) culture into Mueller-Hinton broth (Difco, MI) and adjusted to an optic density equal to that of a 0.5 McFarland standard. For the Etest, the organisms were evenly spread on the surface of a 10- by 150-mm agar plate using a cotton swab and allowed to dry for about 10 min before the Etest strips were applied to the plate. Antibiotic strips were placed in a radial fashion, and duplicate tests were performed. For the agar dilution method, a dilution of the suspension of approximately 104 CFU per spot was inoculated within 15 min of preparation onto the agar surface with a multipoint inoculator. The plates were incubated at 35°C in 5% CO2 for 20 to 24 h. The MICs were interpreted by reading growth inhibition (agar dilution) or the intercept of the inhibition zone and the strip (Etest). A higher MIC was selected when replicates generated different MIC values. A panel of 7 quality control organisms, N. gonorrhoeae strains ATCC 49226, F28, P681E, CDC 10328, CDC 10329, SPJ15, and SPL-4, were routinely included in each assay (18). Among these, the strains ATCC 49226 (a susceptible control) and SPL-4 (a control with decreased susceptibility to cefixime) were relevant to this study. For ATCC 49226, the MIC range of ceftriaxone was 0.004 to 0.015 μg/ml and of cefixime was 0.004 to 0.03 μg/ml; for SPL-4, the range of ceftriaxone was 0.03 to 0.25 μg/ml and of cefixime was 0.25 to 0.5 μg/ml. Resulting MIC values of the controls fell within predefined ranges (19).
Statistical analyses.
A comparison of Etest and agar dilution MICs was made using multiple statistical approaches: simple correlation, linear regression, analysis of variance (ANOVA), and the Wilcoxon rank sums test. Each test was performed separately for each antibiotic. Outliers were defined as any isolates with MICs of 96 or 128 μg/ml by the Etest. Statistical tests were repeated, including and excluding outliers, and were reported without outliers since the outliers were not representative. The additional in-between values (e.g., 0.19 μg/ml) available from the Etest but not from the agar dilution test were used in the analyses to increase the overall accuracy and precision of the analyses.
Categorical definitions of susceptible (S) and nonsusceptible (NS) were assigned based on the MICs and using the CLSI-defined interpretive criteria (18). Chi-square tests comparing the categorical assignments by the Etest or the agar dilution method were then performed for the three antibiotics. We compared the categorical classifications based on CLSI criteria (see Table 5).
TABLE 5.
Categorical agreementa
| Susceptibility by ETb | Susceptibility by AD (no. [%]of isolates) in indicated category |
||
|---|---|---|---|
| S, AD ≤ 0.25 μg/ml | nS, AD > 0.25 μg/ml | Total | |
| Ceftriaxonec | |||
| Count (% by AD) | |||
| S, ET ≤ 0.25 μg/ml | 105 (100) | 0 (0) | 105 |
| nS, ET > 0.25 μg/ml | 0 (0) | 10 (100) | 10 |
| Total | 105 | 10 | 115 |
| Cefiximed | |||
| Count (% by AD) | |||
| S, ET ≤ 0.25 μg/ml | 102 (99.03) | 2 (16.67) | 104 |
| nS, ET > 0.25 μg/ml | 1 (0.97) | 10 (83.33) | 11 |
| Total | 103 | 12 | 115 |
| Cefpodoximee | |||
| S, ET ≤ 0.5 μg/ml | 60 (97) | 5 (9) | 65 |
| nS, ET > 0.5 μg/ml | 2 (3) | 48 (91) | 50 |
| Total | 62 | 53 | 115 |
Susceptibility cutoff (ETsusc or ADsusc) points are 0.25, 0.25, and 0.5 μg/ml for ceftriaxone, cefixime, and cefpodoxime, respectively.
S, susceptible isolate; nS, nonsusceptible isolate.
Ceftriaxone chi-square value, <.0001.
Cefixime chi-square value, <.0001.
Cefpodoxime chi-square value, <.0001.
RESULTS
For ceftriaxone and cefixime, all clinical and laboratory-generated mutant samples were included in the statistical summaries and conclusions. For cefpodoxime, there were four samples among the laboratory-generated mutants in which the Etest gave an MIC result of 96 or 128 μg/ml, which is well beyond the test limit (MIC = 8) of the agar dilution test. Accordingly, those outliers were removed from further analysis because the observation that 8 is not equivalent to 96 or 128 does not speak to the relative performance of the tests.
The MICs for the agar dilution test of clinical isolates ranged between 0.001 and 0.125 μg/ml, 0.016 and 0.125 μg/ml, and 0.008 and 2 μg/ml for ceftriaxone, cefixime, and cefpodoxime, respectively. The Etest MICs for the clinical isolates ranged between 0.002 and 0.25 μg/ml, 0.004 and 0.5 μg/ml, and 0.016 and 1.5 μg/ml for ceftriaxone, cefixime, and cefpodoxime, respectively.
The MICs for the agar dilution test for the laboratory-derived mutants ranged between 0.5 and 8 μg/ml, 2 and 16 μg/ml, and 1 and 8 μg/ml for ceftriaxone, cefixime, and cefpodoxime, respectively. The Etest MICs for laboratory-generated mutants ranged between 1 and 8 μg/ml, 0.5 and 6 μg/ml, and 3 and 8 μg/ml for ceftriaxone, cefixime, and cefpodoxime, respectively.
When comparing the MIC values between the agar dilution method and the Etest, all three antibiotics showed good linear relationships (Fig. 1a, b, and c). The R2 values between the Etest and agar dilution test were 88%, 82%, and 85%, respectively, and the Pearson's correlations were 92%, 91%, and 92%, respectively, for ceftriaxone, cefixime, and cefpodoxime. The good correlation covered the full range of MICs, from 0.002 μg/ml to as high as 16 μg/ml (Fig. 1a, b, and c). Despite this good correlation, the Etest consistently generated slightly lower values for all three antibiotics than the agar dilution method (Tables 1 to 3). This is indicated by the fact that more isolates fell below the diagonal lines in Fig. 1, which represent equal MIC values. Ceftriaxone had the best agreement, cefixime came in second, and cefpodoxime had more samples with lower MIC values and had the poorest agreement.
FIG 1.
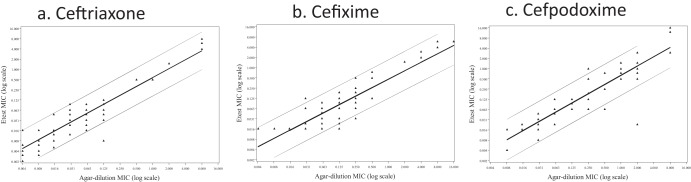
Scatter plots for three antibiotics, ceftriaxone (a), cefixime (b), and cefpodoxime (c), comparing the MICs of the agar dilution method (x axis) with those of the Etest (y axis). The diagonal lines represent the regressions, and each dot represents an individual MIC value.
TABLE 1.
Comparison of agar dilution method and Etest for ceftriaxone
| Agar dilution MIC (μg/ml) | Etest MIC (μg/ml)a |
|||||||||||||||||||
|---|---|---|---|---|---|---|---|---|---|---|---|---|---|---|---|---|---|---|---|---|
| 0.002 | 0.003 | 0.004 | 0.005 | 0.006 | 0.008 | 0.012 | 0.016 | 0.023 | 0.032 | 0.047 | 0.064 | 0.094 | 0.125 | 0.500 | 1.500 | 4.000 | 6.000 | 8.000 | Total | |
| 0.001 | 4 | 1 | 5 | |||||||||||||||||
| 0.004 | 2 | 2 | 3 | 5 | 2 | 14 | ||||||||||||||
| 0.008 | 1 | 3 | 3 | 2 | 2 | 11 | ||||||||||||||
| 0.015 | 1 | 3 | 1 | 3 | 1 | 9 | ||||||||||||||
| 0.030 | 1 | 0 | 2 | 2 | 1 | 6 | 2 | 14 | ||||||||||||
| 0.060 | 1 | 1 | 3 | 6 | 9 | 3 | 23 | |||||||||||||
| 0.125 | 1 | 3 | 5 | 7 | 7 | 6 | 29 | |||||||||||||
| 0.500 | 2 | 2 | ||||||||||||||||||
| 1.000 | 1 | 1 | ||||||||||||||||||
| 2.000 | 3 | 3 | ||||||||||||||||||
| 8.000 | 1 | 2 | 1 | 4 | ||||||||||||||||
| Total | 6 | 3 | 7 | 1 | 8 | 6 | 2 | 8 | 3 | 8 | 13 | 22 | 12 | 6 | 3 | 3 | 1 | 2 | 1 | 115 |
The number in each cell represents the number of isolates that fall within the indicated range. Each number in bold type represents the number of isolates with equal MICs from the agar dilution method and the Etest at each respective MIC.
TABLE 3.
Comparison of agar dilution method and Etest for cefpodoxime
| Agar dilution MIC (μg/ml) | Etest MIC (μg/ml)a |
||||||||||||||||||
|---|---|---|---|---|---|---|---|---|---|---|---|---|---|---|---|---|---|---|---|
| 0.004 | 0.008 | 0.016 | 0.023 | 0.032 | 0.047 | 0.064 | 0.094 | 0.125 | 0.190 | 0.250 | 0.500 | 0.750 | 1.000 | 1.500 | 3.000 | 12.000 | 16.000 | Total | |
| 0.008 | 1 | 0 | 6 | 7 | |||||||||||||||
| 0.015 | 0 | 12 | 1 | 13 | |||||||||||||||
| 0.030 | 1 | 6 | 1 | 2 | 2 | 12 | |||||||||||||
| 0.060 | 3 | 0 | 2 | 1 | 0 | 1 | 7 | ||||||||||||
| 0.125 | 5 | 2 | 2 | 9 | |||||||||||||||
| 0.250 | 2 | 0 | 2 | 4 | 0 | 1 | 0 | 1 | 10 | ||||||||||
| 0.500 | 1 | 2 | 0 | 1 | 0 | 4 | |||||||||||||
| 1.000 | 2 | 5 | 7 | 2 | 16 | ||||||||||||||
| 2.000 | 1 | 2 | 5 | 14 | 4 | 1 | 27 | ||||||||||||
| 8.000 | 1 | 3 | 2 | 6 | |||||||||||||||
| Total | 1 | 1 | 24 | 6 | 2 | 4 | 9 | 2 | 5 | 4 | 2 | 5 | 11 | 22 | 6 | 2 | 3 | 2 | 111 |
The number in each cell represents the number of isolates that fall within the indicated range. Each number in bold type represents the number of isolates with equal MICs from the agar dilution method and the Etest at each respective MIC.
TABLE 2.
Comparison of agar dilution method and Etest for cefixime
| Agar dilution MIC (μg/ml) | Etest MIC (μg/ml)a |
||||||||||||||||
|---|---|---|---|---|---|---|---|---|---|---|---|---|---|---|---|---|---|
| 0.016 | 0.023 | 0.032 | 0.047 | 0.064 | 0.094 | 0.125 | 0.190 | 0.250 | 0.500 | 0.750 | 1.500 | 2.000 | 3.000 | 4.000 | 6.000 | Total | |
| 0.004 | 4 | 4 | |||||||||||||||
| 0.008 | 3 | 3 | |||||||||||||||
| 0.015 | 16 | 16 | |||||||||||||||
| 0.030 | 13 | 2 | 0 | 1 | 1 | 17 | |||||||||||
| 0.060 | 7 | 1 | 1 | 1 | 1 | 1 | 12 | ||||||||||
| 0.125 | 1 | 1 | 3 | 3 | 4 | 8 | 4 | 24 | |||||||||
| 0.250 | 1 | 3 | 5 | 9 | 7 | 1 | 1 | 27 | |||||||||
| 0.500 | 2 | 1 | 1 | 4 | |||||||||||||
| 2.000 | 1 | 0 | 1 | ||||||||||||||
| 4.000 | 1 | 2 | 0 | 3 | |||||||||||||
| 8.000 | 1 | 2 | 3 | ||||||||||||||
| 16.000 | 1 | 1 | |||||||||||||||
| Total | 44 | 4 | 5 | 1 | 8 | 10 | 20 | 11 | 1 | 2 | 1 | 1 | 1 | 2 | 1 | 3 | 115 |
The number in each cell represents the number of isolates that fall within the indicated range. Each number in bold type represents the number of isolates with equal MICs from the agar dilution method and the Etest at each respective MIC.
When a direct comparison was made, the paired results of within-1-log2 MIC values between the Etest and the agar dilution method for ceftriaxone, cefixime, and cefpodoxime were 88.7%, 80%, and 87%, respectively (Table 4). The paired results for within-2-log2 MIC values were 99.1%, 98.3%, and 94.8% for ceftriaxone, cefixime, and cefpodoxime, respectively. Therefore, ceftriaxone generated the best test agreements, followed by cefixime, and cefpodoxime.
TABLE 4.
Comparison of the MICs for N. gonorrhoeae isolates measured by the agar dilution method and Etest
| Antibiotic and log2 (Etest) minus log2 (AD) | No. of samples | % of samples | Cumulative samples |
|
|---|---|---|---|---|
| No. | % | |||
| Ceftriaxone | ||||
| −4 | 1 | 0.9 | 1 | 0.9 |
| −2 | 5 | 4.4 | 6 | 5.2 |
| −1 | 28 | 24.4 | 34 | 29.6 |
| 0 | 54 | 47.0 | 88 | 76.5 |
| 1 | 21 | 18.3 | 109 | 94.8 |
| 2 | 6 | 5.2 | 115 | 100.0 |
| Cefixime | ||||
| −3 | 2 | 1.7 | 2 | 1.7 |
| −2 | 16 | 13.9 | 18 | 15.7 |
| −1 | 35 | 30.4 | 53 | 46.1 |
| 0 | 46 | 40.0 | 99 | 86.1 |
| 1 | 11 | 9.6 | 110 | 95.7 |
| 2 | 5 | 4.4 | 115 | 100.0 |
| Cefpodoxime | ||||
| −6 | 1 | 0.9 | 1 | 0.9 |
| −3 | 1 | 0.9 | 2 | 1.7 |
| −2 | 5 | 4.4 | 7 | 6.1 |
| −1 | 41 | 35.7 | 48 | 41.7 |
| 0 | 42 | 36.5 | 90 | 78.3 |
| 1 | 20 | 17.4 | 110 | 95.7 |
| 2 | 1 | 0.9 | 111 | 96.5 |
| 4 | 4 | 3.5 | 115 | 100.0 |
We further tested whether the relatively lowered Etest (ET) MIC values were caused by the fact that the MICs of the Etest were more precise since the Etest also covered the in-between values not available from the agar dilution method (AD). For example, the agar dilution test values can be only 0.06, 0.125, and 0.25 μg/ml, while the Etest values can equal 0.064, 0.094, 0.125, 0.19, or 0.25 μg/ml, with 0.094 and 0.19 μg/ml as the additional in-between values. For each of the relatively finer increments available from the Etest, approximately 75% of the Etest MICs were lower than the agar dilution MICs (results not shown), suggesting that the rounding-up in the agar dilution method had a profound effect. For isolates with an Etest MIC of 0.125 μg/ml, the range of the agar dilution values was 0.125 to 0.250 μg/ml, within 1 dilution and tending toward the higher value. Still, the Etest and the agar dilution method exhibited a mean difference of 0.1 μg/ml for the clinical isolates (ANOVA, P = 0.03) and 0.5 μg/ml for the laboratory isolates (P = 0.55), excluding extremely nonsusceptible samples defined by MICs of ≥8 μg/ml. We next compared the categorical classifications based on CLSI criteria (Table 5). Ceftriaxone generated 100% categorical agreements, while cefixime had 97% agreements, and cefpodoxime had 94% agreements.
We included 10 laboratory mutants that were not susceptible to the three antibiotics. Using these 10 mutants, we tested the abilities of the agar dilution and Etest methods to identify future isolates with similar characteristics. For this higher range of MICs, the Etest and agar dilution method agreed well for all 10 isolates and all three antibiotics, ceftriaxone, cefixime, and cefpodoxime (Fig. 1a, b, and c). This agreement occurred in their abilities to determine MICs and in categorical classifications (Table 5).
DISCUSSION
Monitoring the trend of clinical isolates with reduced antimicrobial susceptibilities is an important task for public health agencies. The Etest is an antimicrobial susceptibility testing method for which antibiotic gradients are applied to a plastic strip. It has the advantage of reporting the specific MIC values using only a single culture plate. The reduced time and labor required by the Etest allow public health laboratories to quickly test multiple isolates. We therefore measured and compared the MIC values between the Etest and the current gold standard, the agar dilution test, for three antibiotics—ceftriaxone, cefixime, and cefpodoxime—against N. gonorrhoeae. Ceftriaxone and cefixime are the two ESCs which are currently recommended by the CDC in its sexually transmitted diseases treatment guidelines (20). Testing the feasibility of the Etest as an alternative test for these ESCs is of critical importance. Our results showed that, generally, the two tests are interchangeable. However, it is worth noting that the MIC values of the Etest are consistently lower than those of the agar dilution test. Our results and analyses suggested that this could be due to the ability of the Etest to read an additional one-half dilution higher or lower. Having additional reading points is an advantage of the test and can further enhance the test's precision. As the number of gonococcal isolates requiring testing increase and as additional laboratories become interested in performing antimicrobial susceptibility testing, the Etest could serve as an alternative to the agar dilution test.
Because of the lack of clinically proven resistant gonococcal isolates for the three antibiotics tested, we used 10 laboratory-generated mutants that were selected based on their growth patterns under high concentrations of ESC, specifically cefpodoxime. Using these laboratory-generated mutants whose MICs were >0.5 μg/ml and therefore could be considered nonsusceptible by the current CLSI criteria, we saw general agreement between the Etest and the agar dilution method. Since insufficient numbers of clinically antibiotic-resistant isolates were available to confirm this result, this MIC value should remain a reference point to clinical laboratories performing susceptibility testing. Thus, 0.25 μg/ml remains appropriate as the epidemiological cutoff value for susceptible and nonsusceptible isolates for ceftriaxone and cefixime (Table 5).
Although the Etest MICs were generally lower than the agar dilution test MICs for all three antibiotics, it was <1 log2 dilution in >80% of the cases for all three drugs. Hence, using the MIC cutoffs for the Etest and the AD produces near-equivalent categorization. To more accurately compare susceptibility determinations, different cutoffs may need to be developed for the Etest.
There were several limitations to this study. First, we have studied only 105 GISP isolates. Second, we have studied only 10 laboratory-generated mutants. Third, we did not perform the agar dilution test for concentrations higher than 8 μg/ml.
In vitro antimicrobial susceptibility testing using the Etest generated results comparable to those of the agar dilution method. For public health laboratories that require testing and determination of the MICs of small numbers of isolates to the three discussed antimicrobial agents for N. gonorrhoeae, the Etest could be a useful, cost-effective, and reliable tool (21). In addition, using the current isolates, we have not observed any categorical changes among the two antibiotics (cefixime and ceftriaxone). The use of the 10 laboratory-generated mutants with nonsusceptible isolates toward the first-line ESC indicated that the Etest would be useful for monitoring the slow rise of drug resistance. Continuous surveillance is necessary for monitoring the trend and safeguard the public health. However, it is also noted that the MIC values generated by the Etest are lower than those by the agar dilution method. Additional studies are needed to determine if the Etest can be reliably used for testing the susceptibilities of other antibiotics.
ACKNOWLEDGMENTS
We thank Steve Johnson for providing the laboratory-generated mutants.
The opinions expressed by the authors contributing to this article do not necessarily reflect the opinions of the Centers for Disease Control and Prevention.
Footnotes
Published ahead of print 19 February 2014
REFERENCES
- 1.Boslego JW, Tramont EC, Takafuji ET, Diniega BM, Mitchell BS, Small JW, Khan WN, Stein DC. 1987. Effect of spectinomycin use on the prevalence of spectinomycin-resistant and penicillinase-producing Neisseria gonorrhoeae. N. Engl. J. Med. 317:272–278. 10.1056/NEJM198707303170504 [DOI] [PubMed] [Google Scholar]
- 2.Barry PM, Klausner JD. 2009. The use of cephalosporins for gonorrhea: the impending problem of resistance. Expert Opin. Pharmacother. 10:555–557. 10.1517/14656560902731993 [DOI] [PMC free article] [PubMed] [Google Scholar]
- 3.Tapsall JW, Ndowa F, Lewis DA, Unemo M. 2009. Meeting the public health challenge of multidrug- and extensively drug-resistant Neisseria gonorrhoeae. Expert Rev. Anti Infect. Ther. 7:821–834. 10.1586/eri.09.63 [DOI] [PubMed] [Google Scholar]
- 4.Unemo M, Golparian D, Syversen G, Vestrheim DF, Moi M. 2010. Two cases of verified clinical failures using internationally recommended first-line cefixime for gonorrhoea treatment, Norway, 2010 Euro Surveill. 15:pii=19721 http://www.eurosurveillance.org/ViewArticle.aspx?ArticleId=19721 [DOI] [PubMed] [Google Scholar]
- 5.Whittington WL, Knapp JS. 1988. Trends in antimicrobial resistance in Neisseria gonorrhoeae in the United States. Sex. Transm. Dis. 15:202–210. 10.1097/00007435-198810000-00006 [DOI] [PubMed] [Google Scholar]
- 6.Workowski KA, Berman SM, Douglas JM., Jr 2008. Emerging antimicrobial resistance in Neisseria gonorrhoeae: urgent need to strengthen prevention strategies. Ann. Intern. Med. 15:606–613. 10.7326/0003-4819-148-8-200804150-00005 [DOI] [PubMed] [Google Scholar]
- 7.Centers for Disease Control and Prevention. 2007. Update to CDC's sexually transmitted diseases treatment guidelines, 2006: fluoroquinolones no longer recommended for treatment of gonococcal infection. MMWR Morb. Mortal. Wkly. Rep. 56:332–336 http://www.cdc.gov/mmwr/pdf/wk/mm5614.pdf [PubMed] [Google Scholar]
- 8.Centers for Disease Control and Prevention. 2011. Cephalosporin susceptibility among Neisseria gonorrhoeae isolates—United States, 2000-2010. MMWR Morb. Mortal. Wkly. Rep. 60:873–877 http://www.cdc.gov/mmwr/preview/mmwrhtml/mm6026a2.htm [PubMed] [Google Scholar]
- 9.Chisholm SA, Mouton JW, Lewis DA, Nichols T, Ison CA, Livermore DM. 2010. Cephalosporin MIC creep among gonococci: time for a pharmacodynamics rethink? J. Antimicrob. Chemother. 65:214–218. 10.1093/jac/dkq289 [DOI] [PubMed] [Google Scholar]
- 10.Deguchi T, Yasuda M, Yokoi S, Ishida K, Ito M, Ishihara S, Minamidate K, Harada Y, Tei K, Kojima K, Tamaki M, Maeda S. 2003. Treatment of uncomplicated gonococcal urethritis by double-dosing of 200 mg cefixime at a 6-h interval. J. Infect. Chemother. 9:35–39. 10.1007/s10156-002-0204-8 [DOI] [PubMed] [Google Scholar]
- 11.Yokoi S, Deguchi T, Ozawa T, Yasuda M, Ito S, Kubota Y, Tamaki M, Maeda S. 2007. Threat to cefixime treatment of gonorrhea. Emerg. Infect. Dis. 13:1275–1277 http://wwwnc.cdc.gov/eid/article/13/8/06-0948_article.htm [DOI] [PMC free article] [PubMed] [Google Scholar]
- 12.Centers for Disease Control and Prevention. 9 January 2013. Gonococcal Isolate Surveillance Project. http://www.cdc.gov/std/gisp/
- 13.Baker CN, Stocker SA, Culver DH, Thornsberry C. 1991. Comparison of the E test to agar dilution, broth microdilution, and agar diffusion susceptibility testing techniques by using a special challenge set of bacteria. J. Clin. Microbiol. 29:533–538 [DOI] [PMC free article] [PubMed] [Google Scholar]
- 14.Citron DM, Ostovari MI, Karisson A, Goldstein EJC. 1991. Evaluation of the E test for susceptibility testing of anaerobic bacteria. J. Clin. Microbiol. 29:2197–2203 [DOI] [PMC free article] [PubMed] [Google Scholar]
- 15.Biedenbach DJ, Jones RN. 1996. Comparative assessment of Etest for testing susceptibilities of Neisseria gonorrhoeae to penicillin, tetracycline, ceftriaxone, cefotaxime, and ciprofloxacin: investigation using 510(k) review criteria, recommended by the Food and Drug Administration. J. Clin. Microbiol. 34:3214–3217 [DOI] [PMC free article] [PubMed] [Google Scholar]
- 16.Singh V, Bala M, Kakran M, Ramesh V. 2012. Comparative assessment of CDS, CLSI disc diffusion and Etest techniques for antimicrobial susceptibility testing of Neisseria gonorrhoeae: a 6-year study. BMJ Open. 2:e000969. 10.1136/bmjopen-2012-000969 [DOI] [PMC free article] [PubMed] [Google Scholar]
- 17.Clinical and Laboratory Standards Institute. 2012. Methods for antimicrobial susceptibility testing of anaerobic bacteria: approved standard-8th ed. CLSI document, Approved Standard M11-A8 Clinical and Laboratory Standards Institute, Wayne, PA [Google Scholar]
- 18.Clinical and Laboratory Standards Institute. 2014. Performance standards for antimicrobial susceptibility testing: twenty-third informational supplement. CLSI document, Approved Standard M100-S24 Clinical and Laboratory Standards Institute, Wayne, PA [Google Scholar]
- 19.Centers for Disease Control and Prevention. February 2005. B-88: Neisseria gonorrhoeae reference strains for antimicrobial susceptibility testing. http://www.cdc.gov/std/Gonorrhea/arg/B88-Feb-2005.pdf
- 20.Centers for Disease Control and Prevention 2012. Update to CDC's Sexually Transmitted Diseases Treatment Guidelines, 2010: Oral cephalosporins no longer a recommended treatment for gonococcal infections. MMWR Morb. Mortal. Wkly. Rep. 61:590–594 http://www.cdc.gov/mmwr/preview/mmwrhtml/mm6131a3.htm [PubMed] [Google Scholar]
- 21.Valdivieso-Garcia A, Imgrund R, Deckert A, Varughese BM, Harris K, Bunimov N, Reid-Smith R, McWen S. 2009. Cost analysis and antimicrobial susceptibility testing comparing the E test and the agar dilution method in Campylobacter jejuni and Campylobacter coli. Diagn. Microbiol. Infect. Dis. 65:168–174. 10.1016/j.diagmicrobio.2009.07.008 [DOI] [PubMed] [Google Scholar]