

ABSTRACT
Retroviral vectors have been used in successful gene therapies. However, in some patients, insertional mutagenesis led to leukemia or myelodysplasia. Both the strong promoter/enhancer elements in the long terminal repeats (LTRs) of murine leukemia virus (MLV)-based vectors and the vector-specific integration site preferences played an important role in these adverse clinical events. MLV integration is known to prefer regions in or near transcription start sites (TSS). Recently, BET family proteins were shown to be the major cellular proteins responsible for targeting MLV integration. Although MLV integration sites are significantly enriched at TSS, only a small fraction of the MLV integration sites (<15%) occur in this region. To resolve this apparent discrepancy, we created a high-resolution genome-wide integration map of more than one million integration sites from CD34+ hematopoietic stem cells transduced with a clinically relevant MLV-based vector. The integration sites form ∼60,000 tight clusters. These clusters comprise ∼1.9% of the genome. The vast majority (87%) of the integration sites are located within histone H3K4me1 islands, a hallmark of enhancers. The majority of these clusters also have H3K27ac histone modifications, which mark active enhancers. The enhancers of some oncogenes, including LMO2, are highly preferred targets for integration without in vivo selection.
IMPORTANCE We show that active enhancer regions are the major targets for MLV integration; this means that MLV preferentially integrates in regions that are favorable for viral gene expression in a variety of cell types. The results provide insights for MLV integration target site selection and also explain the high risk of insertional mutagenesis that is associated with gene therapy trials using MLV vectors.
INTRODUCTION
Retroviral vectors are used as gene delivery tools in a broad range of cells, and for clinical gene therapy in patients, because of their high efficiency of integration and stable delivery of target genes. However, insertional activation of oncogenes has been reported in human gene therapy trials using MLV-based vectors. Five out of 20 patients who were treated for SCID-X1 in two separate studies using an MLV-based vector developed leukemia 3 to 5 years after treatment (1, 2). Gene transfer treatment of Wiskott-Aldrich syndrome with an MLV vector has also been associated with the development of leukemia (3). Clonal expansion of vector-modified cells and the development of myelodysplasia have also been reported in a murine retroviral gene therapy trial for chronic granulomatous disease (4). The expansion was attributed to the activation of nearby oncogenes, for example, LMO2 and MECOM, by the strong enhancer/promoter elements within the long terminal repeats (LTRs) of the MLV vectors. Vector-specific integration preferences may also play an important role. Much has been learned about the integration preferences of HIV and HIV-based lentivectors and their targeting mechanism. HIV strongly prefers to integrate inside actively transcribed genes (5). The host protein LEDGF/p75, through its interactions with HIV integrase (IN), is known to be critical for this integration site preference (6, 7).
MLV and MLV-based vectors preferentially integrate near transcription start sites (TSS) (8). However, the mechanism that underlies this preference was only recently elucidated. Several groups identified bromodomain and extraterminal (BET) proteins (BRD2, BRD3, and BRD4) as the major host factors that specifically interact with MLV IN and mediate the preferential integration of MLV near TSS (9–12). BET proteins bind to acetylated histone tails via their bromodomains (13–15). The ET domains of BET proteins selectively bind to the C-terminal domain (CTD) of MLV IN. Disruption of the CTD-ET interaction, or inhibition of the bromodomain binding by small molecules, such as JQ1 and I-BET, reduces the efficiency of MLV integration and its preference for TSS (9, 11). However, TSS and the surrounding regions (±1 kb) of the host genome comprise only a small fraction (less than 15%) of all MLV integration sites.
In recent years, there have been major advances in understanding the organization of the human genome and recognition of the importance of epigenetic modifications of chromatin, including histone modifications. In this study, we mapped more than 1 million integration sites for a clinically relevant MLV-based retroviral vector designed to treat chronic granulomatous disease (16) in human CD34+ hematopoietic stem cells and compared the integration sites to the distribution of epigenetic marks in the human genome. Our results demonstrate that histone modification H3K4me1, which marks enhancers, is present at 87% of all integration sites for the MLV vector and that active enhancers are preferred over inactive/poised enhancers. In addition, the MLV vector preferentially integrates near LMO2 without any selection, potentially exacerbating the problem of insertional mutagenesis in hematopoietic stem cells.
MATERIALS AND METHODS
Transduction of human CD34+ cells.
Granulocyte colony-stimulating factor (G-CSF)-mobilized CD34+ hematopoietic stem cells were isolated from healthy adult human volunteers by apheresis, immune column selected (Miltenyi), and cryopreserved (NIAID IRB-approved protocol 94-I-0073). For transductions, the CD34+ cells were thawed, placed into culture in X-Vivo 10 medium (Lonza) supplemented with 1% human serum albumin (Baxter Healthcare Corporation), and stimulated for 1 day with stem cell factor (SCF), FMS-like tyrosine kinase 3 ligand (FLT-3L), and thrombopoietin (TPO), all at 50 ng/ml, as well as interleukin-3 (IL-3) at 10 ng/ml (all from Peprotech). Starting on the second day of culture, the CD34+ cells were transduced with the MLV vector, MFGS-gp91 (16), daily for 3 days by spinoculation on retronectin-coated plates and harvested the morning after the last transduction. To provide an analysis of HIV lentivector integration sites for comparison to the MLV vector integration sites, CD34+ cells from similar healthy human volunteers were transduced with a derivative of a clinically relevant self-inactivating lentivector, Cl20 i4 EF1α hγc OPT (17, 18). Following 1 day of prestimulation in cytokines as described above, the cells were exposed to the lentivector on two consecutive days. Upon completion of the MLV vector or HIV lentivector transductions, the CD34+ cells were harvested and washed, and genomic DNA was extracted for integration site analysis.
In vivo mouse xenograft model.
CD34+ cells from three different healthy adult volunteer donors were transduced with the MLV vector as described above. For each donor, 4 × 10⁶ transduced cells were transplanted into each of 6 NOD-SCIDγc− mice (4 donors; a total of 24 mice). The NOD-SCIDγc− mice were irradiated with 300 rads 2 days before transplantation of the MLV vector-transduced human CD34+ cells. Mice were analyzed 8 weeks posttransplantation, when human CD34+ cells were recovered from the bone marrow (BM). Bone marrow cells were flushed from the femurs of each mouse into Iscove's minimal defined medium (IMDM), and the engraftment of the human cells was determined by flow-cytometric analysis of CD45+ cells. To enrich for human cells, the bone marrow cells were cultured in a cocktail of human-specific cytokines as described above for 1 week, and then genomic DNA was extracted for integration site analysis.
Survey of integration sites.
Genomic DNA (2 to 10 μg) was sheared to an average size of 300 to 500 bp using Covaris Adaptive Focused Acoustics performed on an E220 focused ultrasonicator (Covaris, Wohurn, MA). The sheared DNA fragments were end repaired with an End-It DNA end repair kit (Epicentre, Madison, WI). 3′-dA DNA tailing was performed with Klenow DNA polymerase to add a single dA residue to the 3′ end of the DNA fragments using the dA-tailing kit from NEB (Ipswich, MA). A partially double-stranded linker with a 5′ T overhang was ligated to the genomic DNA fragments. Specifically, the T-linker (5′GTAATACGACTCACTATAGGGCTCCGCTTAAGGGACT3′, 5′-PO4-GTCCCTTAAGCGGAG-NH2-C3′) was ligated to the DNA fragment using T4 DNA ligase (NEB, Ipswich, MA). The first round of PCR was carried out for 30 cycles with standard PCR conditions using LTR-specific and linker-specific primers (MFGS3LTR, 5′CCTTGGGAGGGTCTCCTCTGAGT 3′; MFGS5LTR, 5′ATGGCGTTACTTAAGCTAGCTTG 3′; Linker-P1, 5′GTAATACGACTCACTATAGGGC3′). Nested PCR was carried out for 15 cycles with primers appropriate for sequencing on an Illumina MiSeq/HiSeq (MFGS3LTRnest, 5′AATGATACGGCGACCACCGAGATCTACACTCTTTCCCTACACGACGCTCTTCCGATCTTGACCATGACTACCCGTCAGCGGGGGTC 3′; MFGS5LTRnest, 5′AATGATACGGCGACCACCGAGATCTACACTCTTTCCCTACACGACGCTCTTCCGATCTCAGTTGCAAACCTACAGGTGGGGTCTTTC 3′; PE2_Linkernest, 5′CAAGCAGAAGACGGCATACGAGATCGGTCTCGGCATTCCTGCTGAACCGCTCTTCCGATCTNNNNNNAGGGCTCCGCTTAAGGGAC3′; NNNNNN stands for barcodes). HIV primers used include HIV-3LTR (5′TGTGACTCTGGTAACTAGAGATCCCTC3′) and HIV-3LTRnest (5′AATGATACGGCGACCACCGAGATCTACACTCTTTCCCTACACGACGCTCTTCCGATCTNNNNNNCCCTTTTAGTCAGTGTGGAAAATC3′). The PCR products were purified with an AMPure XP PCR purification kit (Beckman Coulter, Brea, CA). Sequencing was performed using two 150-bp paired-end MiSeq sequencing kits or two 105-bp paired-end HiSeq sequencing kits from Illumina by following the manufacturer's suggested protocol (Illumina, San Diego, CA). Integration site junctions were mapped to the human genome with BLAT and custom Perl scripts. The following qualifying criteria were applied to authentic integration sites: (i) the sequences must retain the last 5 bp of the LTR sequence, (ii) followed by >20-bp high-quality DNA sequence with a >95% match with genomic DNA starting within 3 bp of the LTR junction, and (iii) the paired-end sequence representing the sheared breakpoint must match the opposite strand in the genome within 1 kb of the mapped LTR junction site. All mapped unique integration sites are listed as UCSC human genome hg19 bed files in the supplemental material (see Tables S2 to S8).
Data analysis.
Chromatin immunoprecipitation-sequencing (ChIP-seq) data and microarray data for CD133+ hematopoietic stem cells, CD34+ hematopoietic stem cells, and CD4+ T lymphocytes were downloaded from NCBI (ChIP-seq, GSE17312 and GSE12646; microarray, GSM263935, GSM263936, GSM918288, GSM1135118, and GSM1132598). ChIP-seq data were analyzed with MACS (model-based analysis of ChIP-seq) (19) and BEDTools (20). Microarray data were analyzed with Parteck Genomic Suite software (Partek, St. Louis, MO).
Previously published MLV integration data from CD4+ T cells (21) were downloaded from NCBI and mapped to the UCSC human genome build using BLAT. All data in the analyses were mapped or converted to human genome build hg19. A total of 31,982 unique integration sites from CD4+ T cells were included in the comparison. A custom Perl script was used to generate theoretical random integration sites throughout the human genome (hg19, excluding gap regions) to compare to the vector integration site data.
MLV vector integration peaks were identified using MACS software. Each integration site is treated as a tag for MACS input with the following settings: −p 0.001 −nolambda −nomodel. The cutoff P value for each peak was set at <0.001. Overlapping MLV vector integration site peaks and ChIP-seq peaks were identified with BEDTools or the table browser intersect tool from the UCSC genome web server. Cooccurrence statistics were performed by random shuffling of peaks across the genome using BEDTools followed by a chi-square test.
The association of MLV vector integration sites/peaks with genes is not simple, because many of these peaks are outside the bodies of genes, and some are relatively far away from genes. However, this information is useful for comparing the MLV vector data obtained in this study to integration site data from other gene therapy trials, most of which were reported in a gene-centric format. If the summit of the MLV vector peak is within a gene, then this peak was assigned to that specific gene. If the summit of the peak is outside a gene, then it was assigned to the closest gene.
Adult healthy volunteers signed written informed consent under IRB-approved NIH protocol 94-I-0073 for apheresis collection of peripheral blood mobilized CD34+ hematopoietic stem cells. NOD-SCID gamma C mouse xenograft studies of transplanted human CD34+ hematopoietic stem cells were performed under NIAID IACUC-approved animal protocol LHD3E.
Sequence accession number.
Raw sequence files were deposited into the NCBI Sequence Read Archive under accession number PRJNA236553.
RESULTS
Mapping of integration sites in transduced CD34+ cells.
G-CSF-mobilized peripheral blood CD34+ hematopoietic stem cells were transduced with an MLV vector (see Materials and Methods). Genomic DNA isolated from the ex vivo transduced cells was fragmented, and the integration sites were selectively amplified using linker-mediated PCR. The PCR products were sequenced using the Illumina platform as described in Materials and Methods. We mapped 1,040,345 unique MLV vector integration sites (445,319 from the 3′LTR and 595,026 from the 5′LTR) from the ex vivo-transduced human CD34+ cells. There were 2,583 integration sites for which we isolated both the 3′LTR and the 5′LTR junctions, suggesting that the infected cells had a very large and diverse set of integration sites and that most of the integration sites we isolated represent independent events. In most of the analyses, the 3′LTR and 5′LTR data sets were analyzed separately and the results compared to validate the data. As expected, the results of these separate analyses were highly consistent.
MLV vector integration sites are highly enriched at TSS and active promoters, yet these sites account for only a fraction of the integration sites.
In a previous study, we showed that TSS were preferred targets for MLV vector integration compared to either random or HIV lentivector integration sites (8). For this study, we compared the 1 million MLV vector integration sites in CD34+ cells to ∼150,000 HIV lentivector integration sites obtained from a control sample of HIV lentivector-transduced human CD34+ cells using the same method. Approximately 15% of the MLV vector integration sites were found within ±1 kb of TSS in both the 3′LTR and 5′LTR MLV vector data sets (Fig. 1). Only 1.3% of the computer-generated random control sites were found in these same regions. This means that there is approximately a 10-fold enrichment of MLV vector integration sites near TSS (Fig. 1A). In contrast to MLV vector integration, HIV lentivector integration slightly disfavors TSS (1.1%). Because of the high density of the data, we were able to calculate integration frequency at single-base-pair resolution around TSS. The results showed that MLV vector integration sites have a bimodal distribution near TSS, peaking at the bp +500 and the bp −500 positions (Fig. 1B). The upstream peak is larger than the downstream peak. Of note, there is a sharp dip in MLV vector integration sites at TSS (bp −80 to bp +20 region). HIV integration is profoundly disfavored near TSS and is more enriched downstream in the gene body than in the region upstream of TSS (Fig. 1B). The histone H3K4me3 modification marks active promoters (22, 23), and we asked whether the MLV vector shows a preference for active promoters. TSS were divided into active and inactive promoters based on whether an H3K4me3 peak was present near the TSS. In CD34+ cells, 17,600 TSS are marked by H3K4me3 and classified as active promoters, while 5,000 TSS are not marked by H3K4me3 and are classified as inactive promoters (Broad Institute Human Reference Epigenome Mapping Project) (24). Active TSS/promoters comprise ∼15% of the total MLV vector integration sites, whereas inactive TSS/promoters comprise only 0.14% of the total MLV vector integration sites. While the active TSS regions have 10 times more MLV vector integration sites than the random control, the inactive TSS regions have 2-fold fewer MLV vector integration sites than the random control. We also sorted promoters based on gene expression levels measured by microarray in CD34+ cells (GSM981288). Promoters were put into bins of 100 based on their level of expression (Fig. 1C). The MLV vector integration frequencies showed strong positive correlation with the level of gene expression (R2 = 0.90).
FIG 1.
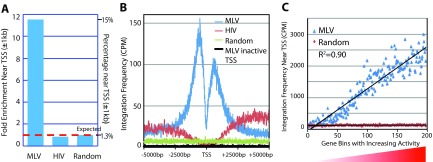
MLV vector integration sites are highly enriched at active TSS and promoter regions. (A) MLV vector and HIV lentivector integration frequencies in the region near TSS (±1 kb) are compared to random sites and represented as fold enrichment on the left axis; percentages of total integration sites are on the right axis. (B) Mapping of integration sites from MLV vector, HIV lentivector, and a random selection within 5,000 bp upstream and downstream of TSS. MLV integration sites peak at both the promoter region upstream of active TSS (−500 bp) and the region downstream of TSS (+500 bp). In contrast, no such peaks are observed near inactive TSS/promoters, which have few, if any, H3K4me3 marks (black). There is a sharp dip at the region immediately adjacent to the TSS. HIV integration is reduced near TSS and increases downstream of TSS in the gene body. (C) Promoters are sorted into bins of 100 each based on gene expression level in CD34+ cells. MLV vector integrations are counted in each bin with the ±1-kb region of promoters/TSS.
Although MLV vector integration sites are highly enriched at TSS/active promoters, this only accounts for ∼15% of the total integration sites. Only ∼25% of the total integration sites are accounted for if the regions are extended to a ±2.5-kb region around the TSS.
MLV vector integration sites form tight clusters at previously unidentified regions across the genome.
Visual inspection of the high-density map of the distribution of MLV vector integration sites in the genome showed tight clusters (Fig. 2A). Clustering analysis, using model-based analysis for ChIP-seq (MACS) software generated ∼60,000 MLV vector integration site peak regions across the genome (P < 0.001), with an average peak size of 970 bp. Many of the clusters of MLV vector integration sites are not near TSS. Some are in introns or at the end of the genes; others are in intergenic regions or in gene deserts (Fig. 2A). The MLV vector peaks represent only a small fraction of the human genome (55.8 Mb total for all peaks, or 1.9% of the human genome), suggesting that MLV vector integration targets specific regions of the genome.
FIG 2.

MLV vector integration sites form tight clusters that colocalize with enhancers and promoters. (A) MLV vector integration clusters on chr11. Integration sites are represented by small ticks with colors denoting the orientation of the provirus. Red represents positive-strand orientation, and blue represents negative-strand orientation. Some clusters colocalize with promoters/TSS (yellow box). Some are within introns (pink box). Others are intergenic (blue box). However, all MLV integration clusters colocalize with epigenetic marks for active enhancers and promoters, including H3K4me1, H3K27ac, and H3K4me3. (B) Percentage and fold enrichment of MLV and HIV vector integration sites within peaks of specific epigenetic marks identified by ChIP-seq in CD34+ cells. Fold enrichment was compared to frequencies of random (Rnd) integration sites. (C) Venn diagrams showing the overlap of MLV vector integration site peaks with H3K4me1 peaks or the overlap of random peaks with H3K4me1 peaks. The majority of the MLV vector integration site peaks (89%) overlap a subset of H3K4me1 peaks. Base pairs that overlap are shown in parentheses. (D) Percentage of integration sites associated with active/inactive enhancers identified by H3K4me1 alone or H3K4me1 and H3K27ac together. A total of 87% of MLV integration sites are within enhancers marked by both H3K4me1/H3K27ac or H3K4me1 alone. (E) Integration site distribution around the peaks of specific epigenetic marks. Integration frequencies at each base surrounding the peak summit (±2 kb) were calculated and are presented as heatmaps. MLV vector integration is associated with H3K4me1, H2AZ, and H3K4me3. Integration of the HIV lentivector is associated with H3K36me3. Both MLV and HIV vectors avoid repressed regions.
MLV vector integration site clusters are strongly associated with active enhancers.
Several studies have reported an association of epigenetic marks, including histone modifications, with retroviral integrations (25–30). We compared the distribution of the MLV vector integration sites with the distribution of epigenetic marks that have been reported for human hematopoietic stem cells (GSE12646 for CD133+ cells and GSE17312 for CD34+ cells). MLV vector integration site clusters showed the strongest association with H3K4me1, a known mark for enhancers (Fig. 2B). Of the 60,754 MLV vector peaks, 54,014 (89%) overlapped with H3K4me1 peaks. There is also a good correlation of the MLV vector integration site peaks with the size and boundaries of the H3K4me1 peaks. It is common in genome studies to extend the boundary of target regions to find overlapping peaks. However, we defined overlapping peaks using a strict physical overlap of the boundaries with no extensions. There were 50,412 MLV vector peaks that overlapped the corresponding H3K4me1 peaks by at least 80%. The total size of the overlapping regions of the H3K4me1 peaks and the MLV vector integration site peaks was 52.4 Mb out of the 55.8 Mb. The association is highly statistically significant (P = 0 by chi-square test). If the 60,754 peaks were randomly placed across the genome, only 7,941 of the peaks would overlap H3K4me1 peaks and the size of overlapped regions would be ∼5 Mb (Fig. 2C). H3K4me1 islands comprise the vast majority of the total MLV vector integration sites (86%) (Fig. 2A and D). In comparison, only 8.8% of the random sites and 25.6% of the HIV lentivector integration sites are found in these regions. Although H3K4me1 is an epigenetic mark for enhancers, it is also enriched near TSS/promoters (23). The H3K4me1 ChIP-seq data in CD34+ cells confirmed that the majority (80%) of sequences of the promoter region (within ±1 kb of TSS) also have H3K4me1 modifications; these could represent enhancers that are proximal to the TSS.
However, despite the fact that most MLV vector integration sites overlap H3K4me1 peaks, only a modest fraction (25%) of the H3K4me1 peaks overlap MLV vector integration site peaks. There are two simple explanations. The first is that the MLV vector data set is smaller than the H3K4me1 ChIP-seq data set. The H3K4me1 ChIP-seq data set has ∼18 million sites (reads), whereas the MLV vector integration data set has ∼1 million integration sites. Thus, it is possible that some MLV vector integration sites were missed; however, it is unlikely that 75% of the integration sites in H3K4me1 peaks were missed. The second explanation is that MLV vector targets only a fraction of the H3K4me1 marked enhancers. Just as promoters can be classified as active and inactive, enhancers can also be in an active or a poised state. Based on the preference for active promoters, we propose that the MLV vector has a preference for integrating in active enhancers. Active enhancers can be distinguished from poised enhancers by the presence of both the H3K4me1 mark and the H3K27ac mark instead of the H3K4me1 mark alone (31). In CD34+ cells, approximately 31,000 H3K4me1 peaks overlap H3K27ac peaks, denoting active enhancers. Although that is only ∼25% of the H3K4me1 peaks, these peaks have ∼70% of the total MLV vector integration sites, whereas the majority of the H3K4me1 peaks that represent inactive/poised enhancers account for only ∼17% of the MLV vector integration sites (Fig. 2D). This translates into an approximately 4-fold enrichment of MLV vector integration sites in active enhancers versus inactive enhancers. In contrast, the matched random data set showed no preference for active or inactive enhancers. Although the H3K4me1 mark was associated with the highest percentage of the total MLV integration sites, the H3K27ac mark had the highest level of enrichment (20-fold over random) for MLV integration sites.
In addition to histone modifications, histone variants are also important epigenetic marks. Histone H2AZ is commonly associated with enhancers and promoters (23, 32). In hematopoietic stem cells, many of the MLV vector integration site clusters overlap H2AZ peaks. More than half (52%) of the total MLV vector integration sites are within H2AZ peaks, whereas only 4.6% of the random sites are within the same region, showing that there is an ∼11-fold enrichment of MLV vector integration inside H2AZ islands (Fig. 2B).
MLV vector integration also showed a positive association with several other epigenetic marks that define active chromatin, including RNAPol II, H3K9me1, H3K27me1, H3K20me1, and H3K4me3. Again, H3K4me3, a histone mark that is associated with promoters, was highly enriched for MLV integration sites (14-fold over random integration) but was associated with only ∼20% of the MLV integration sites. MLV vector integration showed a strong negative association with the repressive histone marks H3K9me3 and H3K27me3 and no association or only a weak negative association with H3K36me3, which marks the bodies of actively transcribed genes. These data clearly demonstrate that active enhancers are the major targets of MLV vector integration.
In contrast, HIV lentivector integration showed a moderate preference for H3K4me1 and H3K27ac marked enhancers (Fig. 2B and D). HIV lentivector integration showed strong associations with H3K36me3, H4K20me1, H3K9me1, and H3K27me1, which mark the bodies of actively transcribed genes (Fig. 2B) (23). Figure 2E shows MLV vector and HIV lentivector integration site distributions in the region (±2 kb) near peaks of three positive regulatory epigenetic marks (H3K4me1, H2AZ, and H3K4me3), a mark for the bodies of active genes (H3K36me3), and a mark for repressed regions (H3K9me3).
MLV vector integration site clusters are cell type specific.
Based on the observation that the MLV vector primarily targets active enhancers, and because the activity of many enhancers is cell type specific (33), we predicted that the distribution of integration sites would show strong cell type specificity. To test this hypothesis, we compared our MLV vector data set in CD34+ cells to the published MLV data set from activated CD4+ T cells (21). Both the CD34+ data set and the CD4+ data set had very similar global preferences, such as enrichment at TSS and enhancers. There are ∼120,000 and ∼96,000 H3K4me1 peaks in CD34+ cells and CD4+ cells, respectively, and about 1/3 of these peaks overlap. We identified CD34+ cell-specific and CD4+ cell-specific peak regions by removing all of the overlapping peaks. We then calculated the fraction of MLV integrations from these two cell types in the cell type-specific H3K4me1 peaks. Fold enrichment was calculated by comparison to a random control. As shown in Fig. 3A, MLV vector integrations in CD34+ cells show a 7-fold enrichment in CD34+ cell-specific H3K4me1 regions compared to the random data set. In contrast, MLV vector integrations in CD34+ cells show a 2-fold lower frequency than the random level in CD4+ cell-specific H3K4me1 regions, and the MLV integration sites identified in CD4+ cells show a 4-fold enrichment in CD4+ cell-specific H3K4me1 peaks but not in CD34+ cell-specific H3K4me1 peaks. Similarly, MLV integrations show cell type-specific enrichment in H3K27ac peaks.
FIG 3.

MLV integration sites are cell type specific. (A) MLV integration site enrichment in cell type-specific H3K4me1 and H3K27ac peaks. (Left) MLV vector integration in CD34+ cells is enriched in CD34+ cell-specific H3K4me1 peaks, whereas MLV integration in CD4+ cells is enriched only in CD4+ cell-specific H3K4me1 peaks. (Right) A similar cell type-specific preference was seen for H3K27ac peaks. (B) MLV integration sites are clustered at the enhancer for the LMO2 gene in CD34+ cells but not in CD4+ cells. In CD34+ cells, the enhancer region shows marks that are characteristic of active enhancers: high levels of H3K4me1, H3K27ac, and H3K4me3 marks and a low level of the repressive mark H3K27me3. However, in CD4+ cells, the levels of the active marks are much lower and the level of the repressive mark H3K27me3 is higher. (C) CD34+ cell-specific MLV vector integration site cluster near the HOXA10 gene. No MLV integration sites were found in this region in CD4+ cells. (D and E) CD4+ cell-specific MLV integration site clusters near genes expressed in CD4+ cells. The CD4+ cell-specific clusters have a much smaller number of integrations than the CD34+ cell-specific clusters. (E) No integration sites were found in the same window in CD34+ cells.
The cell type preferences not only can be detected at a global level but also are obvious in the individual clusters. For example, integration near the LMO2 gene, which has caused leukemia in patients (1), showed very strong cell type specificity. It was proposed that activation of LMO2 gives the cells a growth advantage and is a major contributor to leukemia. However, our data show that LMO2 is a preferential target for integration of the MLV vector in CD34+ cells without any growth selection (Fig. 3B). Out of the ∼1 million MLV vector integration sites, 1,273 were found in this region, comprising almost 0.12% of the total integration sites in CD34+ cells. Only 41 sites in the matched random control data set were found in the same region, suggesting that there is a 30-fold enrichment for MLV vector integrations in LMO2 in CD34+ cells. Furthermore, there were no integration sites in this region in the CD4+ cell data set. Although the CD4+ data set is smaller (n = 31,982), this difference is extremely significant (P < 1 × 10−100 by chi-square test). The histone modifications are much different between this region in CD34+ cells and that in CD4+ cells. There is a large enhancer region upstream of LMO2 which has extensive H3K4me1 and H3K27ac marks in CD34+ cells. In CD4+ cells, the level of H3K4me1 is much lower, and the level of the repressive mark H3K27me3 is much higher in this region. These results suggest that the chromatin around the LMO2 gene is in an activated state in CD34+ cells but in a repressed state in CD4+ cells. As would be expected from this difference, microarray data showed that the level of LMO2 RNA was 77-fold lower in CD4+ cells than in CD34+ cells. Similarly, HOXA10 is a preferred target for MLV integration in CD34+ cells but not in CD4+ cells. The level of HOXA10 RNA was 250-fold lower in CD4+ cells than in CD34+ cells, and the positive marks on the enhancer present in CD34+ cells were absent from CD4+ cells (Fig. 3C). The gene ITK (IL-2-induced T cell kinase) shows the opposite effect (Fig. 3D). There are high levels of ITK RNA in CD4+ cells but not in CD34+ cells (350-fold difference). There are much higher levels of the active enhancer marks H3K4me1 and H3K4Ac in CD4+ cells than in CD34+ cells. The propensity of MLV to integrate near ITK is much higher in CD4+ cells than in CD34+ cells (adjusted for differences in the sample sizes). TCF7 (Fig. 3E) and IL2RG are other examples of genes whose RNA levels are higher in CD4+ cells than in CD34+ cells. In each case there is preferential integration of MLV in CD4+ cells compared to that in CD34+ cells.
Not surprisingly, there were some MLV integration clusters that were present in both CD4+ cells and CD34+ cells. These occur at enhancers that are active in both cell types, for example, enhancers associated with housekeeping genes. In general, enhancer elements marked by H3K4me1 and H3K27ac in both CD34+ cells and CD4+ cells have more integration sites than cell type-specific enhancers. The relative proportion of integrations in these shared clusters varied depending on the enhancer activity in the two cell types.
Comparison of MLV vector integration sites ex vivo and in vivo.
To investigate the potential risk of clonal expansion associated with the MLV vector in gene therapy trials, human CD34+ cells infected with the MLV vector were injected into NOD-SCID γ-immunodeficient mice to allow in vivo stable engraftment, expansion, and differentiation of the transduced cells. After 8 weeks, the mice were euthanized, and CD45+ human cells were recovered from the mouse bone marrow and analyzed by flow cytometry. There was 20 to 60% engraftment of human cells in these mice. Integration site libraries were prepared from both ex vivo and in vivo samples (see Materials and Methods). A total of 16,293 unique integration sites were mapped from the in vivo library and compared to the integration sites in the ex vivo library. The integration sites in the human cells recovered from the mice showed integration site preferences for active promoters and enhancers that were similar to those of the ex vivo library. Evidence for clonal outgrowth was assessed at two levels. First, the frequency at each hot spot was calculated. Most of the hot spots observed in the in vivo library were present in the ex vivo library (r = 0.65 for the integration frequencies in the same hot spots in the two data sets), suggesting that the integration sites in cells recovered after 2 months of growth in mice were similar to the sites in the founder population. The LMO2 gene was a hot spot for integration in both libraries. The relative frequencies of the integrations at some hot spots are enriched or reduced, but there are diverse hot spots in the in vivo library and no obvious clonal expansion was observed. Clonal expansion can also be detected by measuring the relative frequency of specific unique integration sites. We can unambiguously identify clonally expanded cells that carry the same integration site, because shearing the DNA prior to PCR amplification produces distinct breakpoints in the amplified host DNA. We found no highly expanded clones after 2 months of growth in the mouse model. The most abundant clones were less than 0.5% of the population based on sequence counts. For example, the integration site at chr1 position +26083757 in gene Man1c1 was recovered 21 different times out of a total of 5,862 independent 5′LTR integration events, suggesting that at least 21 cells (0.35% of the sample) were derived from the same founder cell. This suggests that 2 months is not a sufficient period of time for small differences in the growth potential of the transduced human CD34+ transplanted cells to cause a significant clonal expansion in the xenograft NOD-SCID gamma C mouse model.
DISCUSSION
MLV integration highly favors regions near TSS (8). However, the mechanisms that underlie that preference have remained elusive. To find host proteins that target MLV integration, Studamire and Goff identified multiple transcription regulators and chromatin binding proteins that interact with MLV IN using the yeast two-hybrid system (12). Recently, bromodomain and extraterminal domain (BET) proteins (including Brd2, Brd3, and Brd4) were identified as the major cellular proteins that interact with MLV IN (9–11). BET proteins interact specifically with MLV IN but not HIV IN. A bimodal tethering model was proposed in which the C-terminal ET domains of the BET proteins bind MLV IN and target MLV integration to the TSS through the N-terminal BET protein bromodomain's interaction with acetylated H3 and H4 tails at the TSS. However, TSS regions only comprise a small fraction of the MLV vector integration sites. Our results show that active enhancers are the major targets of MLV vector integration. This model is compatible with reports that BET proteins are the major targeting protein for MLV integration, and the model explains the vast majority of the MLV vector integration sites. Our experiments were done with an MLV vector. However, the viral integration machinery used by the vector is identical to that used by intact MLV, and the parental virus will have the same integration site preferences and targeting pattern as the vector.
Histone acetylation plays a key role in regulating chromatin states and gene expression (34). Acetylation is generally associated with transcriptional activation. Acetylated histones are found not only at TSS/promoters but also at active enhancers. BET proteins are known to bind acetylated histone tails (14). Recently, Zhang et al. showed that Brd4 localizes to active enhancers in CD4+ T cells and that enhancer binding is lineage specific (35). These results, taken together with the interaction of the BET protein with MLV IN, explain the enrichment of MLV vector integration sites at active promoters and enhancers (Fig. 4). Thus, BET proteins bind to MLV IN in the preintegration complex (PIC) and target it to specific histone acetyl marks at enhancers and promoters. This mechanism allows MLV to integrate preferentially in active enhancers and ensures that the provirus is in an optimal environment for expression in a variety of cell types.
FIG 4.
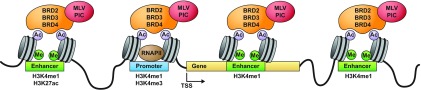
MLV integration targeting model. The MLV preintegration complex (PIC) is targeted to active enhancer and promoter regions through interaction with BET proteins (BRD2, BRD3, and BRD4), which interact with histone acetyl modifications in active enhancers and promoters.
MLV integration is highly enriched near TSS, because histone acetyl marks are enriched near TSS. However, our high-resolution map of MLV vector integration shows that the region immediately adjacent to the TSS is not a preferred target for integration (Fig. 1B). The explanation is that, although histone acetylation is enriched near the TSS of active genes, TSS are nucleosome free and there are no histone acetyl marks for BET proteins to bind. Although it is reasonably clear that the Brd2, Brd3, and Brd4 proteins bind to acetylated residues on histone tails, exactly which modified histone residues are most tightly bound by these three Brd proteins, and the degree to which the binding sites of the various Brd proteins are influenced by other interactions, is not well understood (15).
Our results provide a model for MLV vector integration targeting and have potential applications for genome research. MLV can infect a broad range of different cell types at high efficiency, and it is easy to map millions of integration sites. MLV integration can be used to identify cell type-specific enhancers/promoters and/or to study the in vivo function of BET protein binding sites.
Our findings also provide another level of explanation for LMO2 as the target of insertional mutagenesis in the hematopoietic stem cell gene therapy trials with MLV-based vectors. In most of the leukemia cases in the SCID-X1 and Wiskott-Aldrich MLV vector gene therapy trials, LMO2 misregulation was caused by the insertion of a DNA copy of the MLV vector, which is thought to confer a growth advantage by the action of enhancers and activators within the vector on the nearby gene. The CD34+ cell-specific enhancer at the large LMO2 locus makes the LMO2 locus a major hot spot for integration of the MLV vector. In a typical gene therapy trial, ∼100 million vector-infected CD34+ cells are injected into a patient. If each of the cells was independently infected at the rate we observed for integrations in this region (0.12%), there would be ∼120,000 infused cells that have a copy of the MLV vector integrated in the LMO2 locus, considerably increasing the risk of ectopic LMO2 expression. This cell type-specific preference for MLV vector integration into LMO2 suggests that the risk of LMO2 insertional activation is reduced in other types of cells. Indeed, Biasco et al. compared the effects of using the same MLV-based vector in two clinical trials for ADA SCID, one in which peripheral blood lymphocytes (PBL) were transduced and one in which CD34+ hematopoietic stem cells (HSC) were transduced (30). They found that LMO2 was a common integration site (CIS) in the HSC model but not the PBL model. They also reported cell type-specific integration preferences at other targets, which can be explained by our findings.
Our results with the large number of unselected integration sites for an MLV vector are also valuable for the gene therapy field. This data set provides a baseline for the integration site preferences of an MLV vector in CD34+ cells. We have calculated the top targeted genes/regions with their normalized frequencies (see Table S1 in the supplemental material). This information can be used to interpret in vivo data. For example, if we were to look only at the integration sites from our in vivo mouse model library, LMO2 would be identified as a prominent CIS. However, this does not mean there was clonal expansion associated with LMO2 during the 2-month engraftment period in the murine xenograft model. It is simply a founder effect of the integration site preference of the vector during ex vivo transduction of CD34+ cells. When we compared the frequency of MLV vector integration sites near LMO2 in the ex vivo and in vivo data, there was no significant increase in the first 2 months of in vivo growth. Because MLV integration strongly favors active enhancers and promoters, it is possible that integration poses a smaller immediate risk of insertional mutagenesis in the CD34+ cells than previously thought, because many of the key target genes (like LMO2) are already expressed at a high level. The risk of insertional mutagenesis will become greater when these cells differentiate/reprogram and need to shutdown genes like LMO2. Thus, insertional mutagenesis in the clinical setting of gene transfer into CD34+ cells could be more a problem of failing to shut down instead of turning on genes like LMO2. The physiology of the specific genetic disorder being treated with MLV vector likely also plays a role in subsequent growth pressures and selective advantages for certain cell types arising in the patient from the transduced CD34+ cells. It may also be possible to alter the risk posed by insertion at some of the known hot spots by using BET protein inhibitors, such as JQ1, during the ex vivo transduction (11). Such inhibitors could reduce the frequency of MLV vector integration in the important regulatory elements, likely at some cost to the overall transduction efficiency, unless new inhibitors that only affect integration site selectivity can be developed.
Supplementary Material
ACKNOWLEDGMENTS
This work has been supported in part by the Intramural Program of the National Institute of Allergy and Infectious Diseases (NIAID), National Institutes of Health (NIH), under project Z01-AI-000644. This work was also funded in part with federal funds from the National Cancer Institute, National Institutes of Health, under contract no. HHSN261200800001E, and by funding from the Intramural Program of the National Cancer Institute. This work was supported in part by funding from Johnson & Johnson Research Pty. Limited (a subsidiary of the Johnson & Johnson group of companies) in the context of a Cooperative Research and Development Agreement (CRADA AI-0167) with NIAID.
The contents of this publication do not necessarily reflect the views or policies of the Department of Health and Human Services, and mention of trade names, commercial products, or organizations does not imply endorsement by the U.S. government.
Footnotes
Published ahead of print 5 February 2014
Supplemental material for this article may be found at http://dx.doi.org/10.1128/JVI.00011-14.
REFERENCES
- 1.Hacein-Bey-Abina S, Garrigue A, Wang GP, Soulier J, Lim A, Morillon E, Clappier E, Caccavelli L, Delabesse E, Beldjord K, Asnafi V, MacIntyre E, Dal Cortivo L, Radford I, Brousse N, Sigaux F, Moshous D, Hauer J, Borkhardt A, Belohradsky BH, Wintergerst U, Velez MC, Leiva L, Sorensen R, Wulffraat N, Blanche S, Bushman FD, Fischer A, Cavazzana-Calvo M. 2008. Insertional oncogenesis in 4 patients after retrovirus-mediated gene therapy of SCID-X1. J. Clin. Investig. 118:3132–3142. 10.1172/JCI35700 [DOI] [PMC free article] [PubMed] [Google Scholar]
- 2.Howe SJ, Mansour MR, Schwarzwaelder K, Bartholomae C, Hubank M, Kempski H, Brugman MH, Pike-Overzet K, Chatters SJ, de Ridder D, Gilmour KC, Adams S, Thornhill SI, Parsley KL, Staal FJ, Gale RE, Linch DC, Bayford J, Brown L, Quaye M, Kinnon C, Ancliff P, Webb DK, Schmidt M, von Kalle C, Gaspar HB, Thrasher AJ. 2008. Insertional mutagenesis combined with acquired somatic mutations causes leukemogenesis following gene therapy of SCID-X1 patients. J. Clin. Investig. 118:3143–3150. 10.1172/JCI35798 [DOI] [PMC free article] [PubMed] [Google Scholar]
- 3.Witzel MGW, Braun CJ, Boztug K, Paruzynski A, Albert MH, Schwarzer A, Modlich U, Beier R, Göhring G, Naundorf S, Kühlcke K, Rose M, Fraser C, Mathias L, Ferrari R, Abboud MR, Al-Herz W, Kondratenko I, Maródi L, Schlegelberger B, Baum C, Schmidt M, von Kalle C, Klein C. 2013. Hematopoietic stem cell gene therapy for Wiskott-Aldrich syndrome. Blood 122:718 http://bloodjournal.hematologylibrary.org/content/122/21/718.abstract [Google Scholar]
- 4.Ott MG, Schmidt M, Schwarzwaelder K, Stein S, Siler U, Koehl U, Glimm H, Kuhlcke K, Schilz A, Kunkel H, Naundorf S, Brinkmann A, Deichmann A, Fischer M, Ball C, Pilz I, Dunbar C, Du Y, Jenkins NA, Copeland NG, Luthi U, Hassan M, Thrasher AJ, Hoelzer D, von Kalle C, Seger R, Grez M. 2006. Correction of X-linked chronic granulomatous disease by gene therapy, augmented by insertional activation of MDS1-EVI1, PRDM16 or SETBP1. Nat. Med. 12:401–409. 10.1038/nm1393 [DOI] [PubMed] [Google Scholar]
- 5.Schroder AR, Shinn P, Chen H, Berry C, Ecker JR, Bushman F. 2002. HIV-1 integration in the human genome favors active genes and local hotspots. Cell 110:521–529. 10.1016/S0092-8674(02)00864-4 [DOI] [PubMed] [Google Scholar]
- 6.Ciuffi A, Llano M, Poeschla E, Hoffmann C, Leipzig J, Shinn P, Ecker JR, Bushman F. 2005. A role for LEDGF/p75 in targeting HIV DNA integration. Nat. Med. 11:1287–1289. 10.1038/nm1329 [DOI] [PubMed] [Google Scholar]
- 7.Cherepanov P, Ambrosio AL, Rahman S, Ellenberger T, Engelman A. 2005. Structural basis for the recognition between HIV-1 integrase and transcriptional coactivator p75. Proc. Natl. Acad. Sci. U. S. A. 102:17308–17313. 10.1073/pnas.0506924102 [DOI] [PMC free article] [PubMed] [Google Scholar]
- 8.Wu X, Li Y, Crise B, Burgess SM. 2003. Transcription start regions in the human genome are favored targets for MLV integration. Science 300:1749–1751. 10.1126/science.1083413 [DOI] [PubMed] [Google Scholar]
- 9.Gupta SS, Maetzig T, Maertens GN, Sharif A, Rothe M, Weidner-Glunde M, Galla M, Schambach A, Cherepanov P, Schulz TF. 2013. Bromo- and extraterminal domain chromatin regulators serve as cofactors for murine leukemia virus integration. J. Virol. 87:12721–12736. 10.1128/JVI.01942-13 [DOI] [PMC free article] [PubMed] [Google Scholar]
- 10.De Rijck J, de Kogel C, Demeulemeester J, Vets S, El Ashkar S, Malani N, Bushman FD, Landuyt B, Husson SJ, Busschots K, Gijsbers R, Debyser Z. 2013. The BET family of proteins targets moloney murine leukemia virus integration near transcription start sites. Cell Rep. 5:886–894. 10.1016/j.celrep.2013.09.040 [DOI] [PMC free article] [PubMed] [Google Scholar]
- 11.Sharma A, Larue RC, Plumb MR, Malani N, Male F, Slaughter A, Kessl JJ, Shkriabai N, Coward E, Aiyer SS, Green PL, Wu L, Roth MJ, Bushman FD, Kvaratskhelia M. 2013. BET proteins promote efficient murine leukemia virus integration at transcription start sites. Proc. Natl. Acad. Sci. U. S. A. 110:12036–12041. 10.1073/pnas.1307157110 [DOI] [PMC free article] [PubMed] [Google Scholar]
- 12.Studamire B, Goff SP. 2008. Host proteins interacting with the Moloney murine leukemia virus integrase: multiple transcriptional regulators and chromatin binding factors. Retrovirology 5:48. 10.1186/1742-4690-5-48 [DOI] [PMC free article] [PubMed] [Google Scholar]
- 13.Kanno T, Kanno Y, Siegel RM, Jang MK, Lenardo MJ, Ozato K. 2004. Selective recognition of acetylated histones by bromodomain proteins visualized in living cells. Mol. Cell 13:33–43. 10.1016/S1097-2765(03)00482-9 [DOI] [PubMed] [Google Scholar]
- 14.Nakamura Y, Umehara T, Nakano K, Jang MK, Shirouzu M, Morita S, Uda-Tochio H, Hamana H, Terada T, Adachi N, Matsumoto T, Tanaka A, Horikoshi M, Ozato K, Padmanabhan B, Yokoyama S. 2007. Crystal structure of the human BRD2 bromodomain: insights into dimerization and recognition of acetylated histone H4. J. Biol. Chem. 282:4193–4201. 10.1074/jbc.M605971200 [DOI] [PubMed] [Google Scholar]
- 15.Hnilicova J, Hozeifi S, Stejskalova E, Duskova E, Poser I, Humpolickova J, Hof M, Stanek D. 2013. The C-terminal domain of Brd2 is important for chromatin interaction and regulation of transcription and alternative splicing. Mol. Biol. Cell 24:3557–3568. 10.1091/mbc.E13-06-0303 [DOI] [PMC free article] [PubMed] [Google Scholar]
- 16.Kang EM, Choi U, Theobald N, Linton G, Long Priel DA, Kuhns D, Malech HL. 2010. Retrovirus gene therapy for X-linked chronic granulomatous disease can achieve stable long-term correction of oxidase activity in peripheral blood neutrophils. Blood 115:783–791. 10.1182/blood-2009-05-222760 [DOI] [PMC free article] [PubMed] [Google Scholar]
- 17.Zhou S, Mody D, DeRavin SS, Hauer J, Lu T, Ma Z, Hacein-Bey Abina S, Gray JT, Greene MR, Cavazzana-Calvo M, Malech HL, Sorrentino BP. 2010. A self-inactivating lentiviral vector for SCID-X1 gene therapy that does not activate LMO2 expression in human T cells. Blood 116:900–908. 10.1182/blood-2009-10-250209 [DOI] [PMC free article] [PubMed] [Google Scholar]
- 18.Throm RE, Ouma AA, Zhou S, Chandrasekaran A, Lockey T, Greene M, De Ravin SS, Moayeri M, Malech HL, Sorrentino BP, Gray JT. 2009. Efficient construction of producer cell lines for a SIN lentiviral vector for SCID-X1 gene therapy by concatemeric array transfection. Blood 113:5104–5110. 10.1182/blood-2008-11-191049 [DOI] [PMC free article] [PubMed] [Google Scholar]
- 19.Zhang Y, Liu T, Meyer CA, Eeckhoute J, Johnson DS, Bernstein BE, Nusbaum C, Myers RM, Brown M, Li W, Liu XS. 2008. Model-based analysis of ChIP-Seq (MACS). Genome Biol. 9:R137. 10.1186/gb-2008-9-9-r137 [DOI] [PMC free article] [PubMed] [Google Scholar]
- 20.Quinlan AR, Hall IM. 2010. BEDTools: a flexible suite of utilities for comparing genomic features. Bioinformatics 26:841–842. 10.1093/bioinformatics/btq033 [DOI] [PMC free article] [PubMed] [Google Scholar]
- 21.Roth SL, Malani N, Bushman FD. 2011. Gammaretroviral integration into nucleosomal target DNA in vivo. J. Virol. 85:7393–7401. 10.1128/JVI.00635-11 [DOI] [PMC free article] [PubMed] [Google Scholar]
- 22.Hon GC, Hawkins RD, Ren B. 2009. Predictive chromatin signatures in the mammalian genome. Hum. Mol. Genet. 18:R195–R201. 10.1093/hmg/ddp409 [DOI] [PMC free article] [PubMed] [Google Scholar]
- 23.Barski A, Cuddapah S, Cui K, Roh TY, Schones DE, Wang Z, Wei G, Chepelev I, Zhao K. 2007. High-resolution profiling of histone methylations in the human genome. Cell 129:823–837. 10.1016/j.cell.2007.05.009 [DOI] [PubMed] [Google Scholar]
- 24.Bernstein BE, Stamatoyannopoulos JA, Costello JF, Ren B, Milosavljevic A, Meissner A, Kellis M, Marra MA, Beaudet AL, Ecker JR, Farnham PJ, Hirst M, Lander ES, Mikkelsen TS, Thomson JA. 2010. The NIH Roadmap Epigenomics Mapping Consortium. Nat. Biotechnol. 28:1045–1048. 10.1038/nbt1010-1045 [DOI] [PMC free article] [PubMed] [Google Scholar]
- 25.Wang GP, Ciuffi A, Leipzig J, Berry CC, Bushman FD. 2007. HIV integration site selection: analysis by massively parallel pyrosequencing reveals association with epigenetic modifications. Genome Res. 17:1186–1194. 10.1101/gr.6286907 [DOI] [PMC free article] [PubMed] [Google Scholar]
- 26.Aiuti A, Biasco L, Scaramuzza S, Ferrua F, Cicalese MP, Baricordi C, Dionisio F, Calabria A, Giannelli S, Castiello MC, Bosticardo M, Evangelio C, Assanelli A, Casiraghi M, Di Nunzio S, Callegaro L, Benati C, Rizzardi P, Pellin D, Di Serio C, Schmidt M, Von Kalle C, Gardner J, Mehta N, Neduva V, Dow DJ, Galy A, Miniero R, Finocchi A, Metin A, Banerjee PP, Orange JS, Galimberti S, Valsecchi MG, Biffi A, Montini E, Villa A, Ciceri F, Roncarolo MG, Naldini L. 2013. Lentiviral hematopoietic stem cell gene therapy in patients with Wiskott-Aldrich syndrome. Science 341:1233151. 10.1126/science.1233151 [DOI] [PMC free article] [PubMed] [Google Scholar]
- 27.Biffi A, Montini E, Lorioli L, Cesani M, Fumagalli F, Plati T, Baldoli C, Martino S, Calabria A, Canale S, Benedicenti F, Vallanti G, Biasco L, Leo S, Kabbara N, Zanetti G, Rizzo WB, Mehta NA, Cicalese MP, Casiraghi M, Boelens JJ, Del Carro U, Dow DJ, Schmidt M, Assanelli A, Neduva V, Di Serio C, Stupka E, Gardner J, von Kalle C, Bordignon C, Ciceri F, Rovelli A, Roncarolo MG, Aiuti A, Sessa M, Naldini L. 2013. Lentiviral hematopoietic stem cell gene therapy benefits metachromatic leukodystrophy. Science 341:1233158. 10.1126/science.1233158 [DOI] [PubMed] [Google Scholar]
- 28.Eidahl JO, Crowe BL, North JA, McKee CJ, Shkriabai N, Feng L, Plumb M, Graham RL, Gorelick RJ, Hess S, Poirier MG, Foster MP, Kvaratskhelia M. 2013. Structural basis for high-affinity binding of LEDGF PWWP to mononucleosomes. Nucleic Acids Res. 41:3924–3936. 10.1093/nar/gkt074 [DOI] [PMC free article] [PubMed] [Google Scholar]
- 29.Cattoglio C, Pellin D, Rizzi E, Maruggi G, Corti G, Miselli F, Sartori D, Guffanti A, Di Serio C, Ambrosi A, De Bellis G, Mavilio F. 2010. High-definition mapping of retroviral integration sites identifies active regulatory elements in human multipotent hematopoietic progenitors. Blood 116:5507–5517. 10.1182/blood-2010-05-283523 [DOI] [PubMed] [Google Scholar]
- 30.Biasco L, Ambrosi A, Pellin D, Bartholomae C, Brigida I, Roncarolo MG, Di Serio C, von Kalle C, Schmidt M, Aiuti A. 2011. Integration profile of retroviral vector in gene therapy treated patients is cell-specific according to gene expression and chromatin conformation of target cell. EMBO Mol. Med. 3:89–101. 10.1002/emmm.201000108 [DOI] [PMC free article] [PubMed] [Google Scholar]
- 31.Creyghton MP, Cheng AW, Welstead GG, Kooistra T, Carey BW, Steine EJ, Hanna J, Lodato MA, Frampton GM, Sharp PA, Boyer LA, Young RA, Jaenisch R. 2010. Histone H3K27ac separates active from poised enhancers and predicts developmental state. Proc. Natl. Acad. Sci. U. S. A. 107:21931–21936. 10.1073/pnas.1016071107 [DOI] [PMC free article] [PubMed] [Google Scholar]
- 32.Creyghton MP, Markoulaki S, Levine SS, Hanna J, Lodato MA, Sha K, Young RA, Jaenisch R, Boyer LA. 2008. H2AZ is enriched at polycomb complex target genes in ES cells and is necessary for lineage commitment. Cell 135:649–661. 10.1016/j.cell.2008.09.056 [DOI] [PMC free article] [PubMed] [Google Scholar]
- 33.Ernst J, Kheradpour P, Mikkelsen TS, Shoresh N, Ward LD, Epstein CB, Zhang X, Wang L, Issner R, Coyne M, Ku M, Durham T, Kellis M, Bernstein BE. 2011. Mapping and analysis of chromatin state dynamics in nine human cell types. Nature 473:43–49. 10.1038/nature09906 [DOI] [PMC free article] [PubMed] [Google Scholar]
- 34.Shahbazian MD, Grunstein M. 2007. Functions of site-specific histone acetylation and deacetylation. Annu. Rev. Biochem. 76:75–100. 10.1146/annurev.biochem.76.052705.162114 [DOI] [PubMed] [Google Scholar]
- 35.Zhang W, Prakash C, Sum C, Gong Y, Li Y, Kwok JJ, Thiessen N, Pettersson S, Jones SJ, Knapp S, Yang H, Chin KC. 2012. Bromodomain-containing protein 4 (BRD4) regulates RNA polymerase II serine 2 phosphorylation in human CD4+ T cells. J. Biol. Chem. 287:43137–43155. 10.1074/jbc.M112.413047 [DOI] [PMC free article] [PubMed] [Google Scholar]
Associated Data
This section collects any data citations, data availability statements, or supplementary materials included in this article.