

ABSTRACT
Congenital human cytomegalovirus (HCMV) infection is a major cause of central nervous system structural anomalies and sensory impairments. It is likely that the stage of fetal development, as well as the state of differentiation of susceptible cells at the time of infection, affects the severity of the disease. We used human embryonic stem (ES) cell-derived primitive prerosette neural stem cells (pNSCs) and neural progenitor cells (NPCs) maintained in chemically defined conditions to study HCMV replication in cells at the early stages of neural development. In contrast to what was observed previously using fetus-derived NPCs, infection of ES cell-derived pNSCs with HCMV was nonprogressive. At a low multiplicity of infection, we observed only a small percentage of cells expressing immediate-early genes (IE) and early genes. IE expression was found to be restricted to cells negative for the anterior marker FORSE-1, and treatment of pNSCs with retinoic acid restored IE expression. Differentiation of pNSCs into NPCs restored IE expression but not the transactivation of early genes. Virions produced in NPCs and pNSCs were exclusively cell associated and were mostly non-neural tropic. Finally, we found that viral genomes could persist in pNSC cultures for up to a month after infection despite the absence of detectable IE expression by immunofluorescence, and infectious virus could be produced upon differentiation of pNSCs to neurons. In conclusion, our results highlight the complex array of hurdles that HCMV must overcome in order to infect primitive neural stem cells and suggest that these cells might act as a reservoir for the virus.
IMPORTANCE Human cytomegalovirus (HCMV) is a betaherpesvirus that is highly prevalent in the population. HCMV infection is usually asymptomatic but can lead to severe consequences in immunosuppressed individuals. HCMV is also the most important infectious cause of congenital developmental birth defects. Manifestations of fetal HCMV disease range from deafness and learning disabilities to more severe symptoms such as microcephaly. In this study, we have used embryonic stem cells to generate primitive neural stem cells and have used these to model HCMV infection of the fetal central nervous system (CNS) in vitro. Our results reveal that these cells, which are similar to those present in the developing neural tube, do not support viral replication but instead likely constitute a viral reservoir. Future work will define the effect of viral persistence on cellular functions as well as the exogenous signals leading to the reactivation of viral replication in the CNS.
INTRODUCTION
Human cytomegalovirus (HCMV) is the most important infectious cause of congenital developmental birth defects, with the central nervous system (CNS) being a main target. The incidence of fetal transmission is between 1 and 4% of live births. At birth, 5 to 10% of in utero-infected infants display symptoms of CMV inclusion disease, which can range from mild to severe and is often lethal. Neural developmental abnormalities include microcephaly, intracranial calcification, ventriculomegaly, microphthalmia, deafness, blindness, and motor disabilities. Approximately 10% of infected infants do not show symptoms of HCMV disease at birth but will later develop milder forms of brain disorders, including hearing loss and learning disabilities (1, 2). However, the reasons for these broad differences in sequelae are not known. It is assumed that both the stage of fetal development and the state of differentiation of susceptible cells at the time of infection are important determinants (1, 3). Although the developing brain has been shown to be a major site of viral replication, there have been very few histological studies on human fetal brain specimens, and the identity and location of the infected cells, the contribution of specific cell types to CNS developmental defects, and the relative contribution of infection of the CNS to the neuropathology compared to that of other organs, such as the placenta, remain to be determined.
To study the susceptibility of neural lineage cells to HCMV, several investigators have used in vitro-expanded neural progenitor cells obtained from aborted fetuses (fNPCs) and have shown that the cells are fully susceptible to HCMV replication (4–8). Permissivity increases with extended passaging of the cells (9). Recently, rosette-type neural stem cells (R-NSCs) and neural progenitor cells (NPCs) generated in vitro from induced pluripotent stem cells (iPSCs) were also used as models to study HCMV replication in neural cells, and similar results were obtained (10). One difficulty in interpreting the results of these studies is that the cell populations were poorly characterized, contained cells at different neural developmental stages, and could not be stably maintained in culture. It is therefore difficult to determine which cell types in these heterogeneous populations are responsible for conferring permissivity to HCMV replication.
In the studies reported here, we used human embryonic stem (ES) cells and chemically defined culture conditions with media containing small-molecule inhibitors as well as recombinant growth factors to generate homogeneous and well-defined populations of primitive neural stem cells (pNSCs) and NPCs. We conducted a thorough investigation of HCMV infection and replication in four lines of pNSCs and NPCs by monitoring viral entry, nuclear import of viral DNA and tegument proteins, viral gene expression, and production of infectious virus. We found that HCMV replication in pNSCs was restricted at the levels of immediate-early gene (IE) expression, transition to early gene expression, virus production, and infectivity of progeny virus in neural progenitor cells. IE expression in pNSCs was confined to cells that lacked the anterior marker FORSE-1. Pretreatment of pNSCs with retinoic acid induced a posterior mesencephalic identity, downregulated the FORSE-1 antigen expression, and restored IE expression. Differentiation to NPCs also alleviated some of the restriction on IE expression, but there was still a significant block in the transition to early gene expression, as well as a defect in neural infectivity of progeny virions. Finally, we found that viral genomes could persist in pNSCs for an extended period of time after infection despite the absence of detectable IE expression based on immunofluorescence and quantitative PCR, and infectious virus could be produced upon differentiation of infected pNSCs to neurons. Our results show that HCMV replication is inhibited at several levels in primitive cells of the neural lineage and suggest that these cell populations might act as a reservoir for the virus in the CNS.
MATERIALS AND METHODS
Cell culture.
Human foreskin fibroblasts (HFFs) and human aortic endothelial cells were maintained as previously described (11). The human ES cells Hues6, Hues16, and H9 were maintained in mTeSR1 medium (Stem Cell Technologies) on Matrigel-coated dishes (BD Biosciences).
Differentiation of human ES cells into pNSCs was performed as previously described by Li et al. (12). Unless otherwise stated, all cell culture reagents were from Invitrogen. Briefly, Hues6 (passage 30), Hues16 (passage 27), and H9 (passage 54) ES cells were seeded at ca. 20% confluence on Matrigel-coated dishes. Two days after seeding, neural induction was started by replacing the ES growth medium with neural growth medium (1:1 Neurobasal/Advanced Dulbecco modified Eagle medium F-12 [DMEM/F12], N-2 supplement, B-27 supplement without vitamin A, 1% GlutaMAX, 100 U of penicillin/ml, 100 μg of streptomycin/ml, 0.05% bovine serum albumin) supplemented with 10 ng of recombinant human leukemia inhibitory factor (hLIF; Millipore)/ml, 3 μM CHIR99021 (Stemgent), 2 μM SB431542 (Stemgent) and 0.5 μM compound E (EMD Chemicals). After 7 days of neural induction, cells were harvested with Accutase and reseeded 1:4 on Geltrex (Invitrogen)-coated dishes in neural growth medium supplemented with 10 ng of hLIF/ml, 2 μM SB431542, and 3 μM CHIR99021. Afterward, pNSCs were routinely passaged at ratios of 1:6 to 1:12. For the first few initial passages, the ROCK inhibitor Y-27632 (Calbiochem) was added to the neural growth medium at a concentration of 5 μM for 16 h in order to increase cell viability. Hues9-derived pNSCs were kindly provided by Kang Zhang (12) and were maintained as described above.
NPCs were differentiated from pNSCs by a 4-day treatment with 10 ng of hLIF/ml and 20 ng of fibroblast growth factor 2 (FGF2)/ml in neural growth medium on Geltrex-coated dishes. After differentiation, NPCs were harvested with Accutase and reseeded on Geltrex-coated dishes in neural growth medium supplemented with 10 ng of hLIF/ml and 20 ng of FGF2/ml and subsequently infected. Unless otherwise indicated, NPCs were never maintained for multiple passages and were always generated de novo for each experiment.
For neuronal differentiation, Hues9 pNSCs were seeded on Geltrex/poly-l-ornithine-coated coverslips and differentiated for 28 days in DMEM/F-12, N-2, B-27, 300 ng of cyclic AMP (cAMP; Sigma-Aldrich)/ml, 0.2 mM vitamin C (Sigma-Aldrich), 10 ng of brain-derived neurotrophic factor (BDNF)/ml, 10 ng of glial cell line-derived neurotrophic factor (GDNF)/ml, 10 ng of IGF1 (R&D Systems)/ml, 1 ng of transforming growth factor (TGF-β3; R&D Systems)/ml, and 0.5 mM db-cAMP (Sigma-Aldrich). Half of the volume of medium was replaced every other day.
Virus stocks and titration.
The clinical viral isolates TB40E and Hillcrest1 were maintained in human aortic endothelial cells as described previously (11). To obtain higher titers, viral stocks were prepared after one round of replication in HFFs. The laboratory viral strain Towne was maintained and prepared in HFFs. Virus-containing supernatants were first centrifuged at 500 × g to remove cellular debris, and virions were pelleted by ultracentrifugation at 100,000 × g for 1 h at 4°C through a 20% sorbitol cushion. Viral pellets were resuspended in neural growth medium and stored in small aliquots at −80°C. Viral stocks were titrated by standard plaque assays in HFFs. Multiplicities of infection (MOIs) were calculated from the numbers of PFU in HFFs.
Analysis of viral production, release, and tropism.
For the analysis of infectious virus production, 105 pNSCs or NPCs were seeded in each Geltrex-coated well of a six-well plate. HFFs were used as positive controls. The day after seeding, pNSCs were infected with TB40E at an MOI of 5, and NPCs and HFFs were infected at an MOI of 0.5. At 6 h postinfection (p.i.), cells were washed extensively with phosphate-buffered saline (PBS), and fresh growth medium was added. For each time point, supernatants were harvested, subjected to centrifugation at 500 × g, and frozen at −80°C in 1% dimethyl sulfoxide. To extract cell-associated viruses, cells were first harvested with Accutase, washed once in PBS, and frozen at −80°C. Cells were then thawed on ice, resuspended in 100 μl of PBS, and sonicated in pulses of 30 s in a cup horn until no intact cells remained (as determined by trypan blue staining). Viral preparations were titrated by plaque assay in HFFs. To determine the tropism of viral particles, 5 × 10⁴ HFFs, pNSCs, and NPCs were seeded on coverslips. At 24 h after seeding, cells were infected with serial dilutions of released or cell-associated viral preparations. Cells were extensively washed with PBS at 6 h p.i., and fresh growth medium was added to cells. Cells were fixed at 24 h, and viral infectivity was determined by immunofluorescence assay (IFA) using an antibody (CH160) against the major IE proteins IE1 and IE2 (hereinafter referred to as IE).
Flow cytometry.
For flow cytometry analysis of neural stem cell marker expression, pNSCs were harvested with Accutase, stained with the Live/Dead Near IR cell viability dye (Invitrogen), and fixed/permeabilized with Cytofix/Cytoperm (BD Biosciences). Five hundred thousand cells were then incubated with the fluorochrome-conjugated primary antibodies diluted in Perm/Wash buffer (BD Biosciences) for 1 h on ice. Antibodies used were V450-conjugated anti-Sox2 (BD Biosciences), phycoerythrin-conjugated anti-PAX6 (BD Biosciences), allophycocyanin-conjugated anti-Nestin (Miltenyi Biotec), and peridinin chlorophyll protein-Cy5.5-conjugated anti-Ki67 (BD Biosciences). The corresponding fluorochrome-conjugated isotypic immunoglobulins were used as negative controls. Multiparametric flow cytometry was performed on a BD FACSCanto II flow cytometer. The data were analyzed and processed using the FlowJo software.
Phase-contrast, epifluorescence, and confocal microscopy.
Live-cell phase-contrast bright-field images were acquired using an inverted Zeiss Axiovert microscope with a 10× objective lens. For immunofluorescence analyses, cells (seeded on coverslips) were fixed with 4% paraformaldehyde, permeabilized with 0.2% Triton X-100, and incubated in blocking buffer (2% bovine serum albumin in PBS). Cells were then incubated with various primary antibodies diluted in blocking buffer and washed with PBS prior to incubation with 1:500 Alexa Fluor-conjugated secondary antibodies (Invitrogen). Cells were then washed in PBS and mounted on a slide using ProLong Gold Antifade reagent (Invitrogen) for epifluorescence microscopy or Vectashield reagent (Vector Laboratories) for confocal microscopy. For immunofluorescence analyses of ES cells and neuronal cultures, we used a modified procedure to increase antibody penetration. Briefly, after fixation with 4% paraformaldehyde, the cells were permeabilized in permeabilization/blocking buffer (0.1% Triton X-100 and 10% normal goat serum in PBS) and were then incubated with primary antibodies diluted in permeabilization/blocking buffer, followed by incubation with Alexa Fluor-conjugated secondary antibodies (diluted 1:1,000 in PBS supplemented with 0.1% Triton X-100). Slides were then mounted as described above.
Antibodies against viral antigens included mouse anti-IE (IE1 and IE2; clone CH160 [Virusys], 1:500), mouse anti-IE1 (1:50, obtained from B. Britt, University of Alabama, Birmingham), mouse anti-UL83 (clone CH12 [Virusys], 1:1,000), mouse anti-UL44 (clone CH13 [Virusys], 1:1,000), mouse anti-UL57 (clone CH167 [Virusys], 1:250), mouse anti-UL82 (clone 10G11, 1:5, obtained from T. Shenk, Princeton University), and mouse anti-UL99 (clone CH19 [Virusys], 1:250). Antibodies against cellular antigens included mouse anti-FORSE-1 (Developmental Studies Hybridoma Bank, no dilution), rabbit anti-Otx2 (Millipore, 1:200), mouse anti-N-cadherin (BD Biosciences, 1:200), mouse anti-AP2 (Developmental Studies Hybridoma Bank, 1:100), rat anti-HoxB4 (Developmental Studies Hybridoma Bank, 1:50), mouse anti-PML (Santa Cruz Biotechnology, 1:50), rabbit anti-PML (Santa Cruz Biotechnology, 1:100); rabbit anti-hDaxx (Sigma-Aldrich, 1:1000); rabbit anti-ATRX (Santa Cruz Biotechnology, 1:50); goat anti-ATRX (Santa Cruz Biotechnology, 1:25), rabbit anti-GFAP (Millipore, 1:500), mouse anti-S100β (Sigma-Aldrich, 1:2,000), rabbit anti-DCX (Cell Signaling, 1:200); rabbit anti-Oct4 (Cell Signaling, 1:200), rabbit anti-Nurr1 (Santa Cruz Biotechnology, 1:50), and mouse anti-βIII tubulin (clone Tuj1 [Covance], 1:500). For most experiments, images were acquired using a Nikon Eclipse epifluorescence microscope equipped with a 20× dry objective lens and a charge-coupled device camera. Where noted, confocal images were acquired using a resonance scanner on a Leica SP5 confocal system equipped with a 60× glycerol objective lens. Sections (59 nm thick) were acquired with 35% overlap to obtain precise high-resolution three-dimensional reconstructions of cells. All images were analyzed with ImageJ software and processed using Photoshop such that no features were deleted/added.
FISH.
Fluorescence in situ hybridization (FISH) was performed as previously described (13) with minor modifications. At various times postinfection, cells were fixed for 5 min with a modified Clarke's fixative (95% ethanol and 5% acetic acid) at −20°C. Cells were then washed with PBS and blocked with hybridization buffer (50% formamide, 10% dextran sulfate, 4× SSC [1× SSC is 0.15 M NaCl plus 0.015 M sodium citrate]) for 30 min at 37°C. The Alexa Fluor 594-labeled probes were generated by nick translation using a FISH tag DNA kit (Invitrogen) and AD169 HB5 BAC as the template. After blocking, coverslips were sealed with rubber cement with 5 μl of prediluted probes (8 ng/μl) in hybridization buffer, and samples were heat denatured for 2 min at 95°C. Hybridization was accomplished overnight at 37°C in a humidified chamber. The cells were subsequently washed with 2× SSC for 5 min at 60°C and then for 5 min at room temperature. Cellular genomic DNA was counterstained with Hoechst 33342. After several washes in PBS, coverslips were mounted with Vectashield reagent (Vector Laboratories), and the cells were analyzed by confocal microscopy.
Entry assay.
To monitor viral entry in cells, a quantitative PCR-based approach was used. At 6 h p.i., the cells were washed with ice-cold 40 mM citrate in PBS (pH 3.0) for 1 min and then washed three times with ice-cold PBS. The cells were then harvested with Accutase, diluted with neural growth medium, and washed again with PBS. To stringently remove extracellular virions, the cells were finally treated with 0.5 mg of pronase E (Calbiochem)/ml for 5 min at 37°C, diluted with medium containing 10% fetal bovine serum, and then washed with PBS. Parallel infections performed at 4°C were used as controls to ensure that residual amounts of extracellular viral DNA were negligible. DNA was extracted using a QIAamp DNA blood minikit (Qiagen). The levels of viral and cellular DNA were monitored by amplification of a UL77 sequence and a GAPDH (glyceraldehyde-3-phosphate dehydrogenase) promoter sequence, respectively, using TaqMan quantitative PCR master mix (Invitrogen) in an ABI Prism 7000 sequence detection system. Levels of UL77 and GAPDH promoter copies were established by the semiquantitative standard curve method. The numbers of viral genomes were normalized to those of cellular genomes.
Infectious center assay.
Infectious center assays were performed by first infecting pNSCs or NPCs at an MOI of 20. One day after infection, the cells were harvested, washed extensively, mixed at a 1:25 ratio with fresh noninfected cells, and reseeded on Geltrex-coated coverslips. Cultures were fixed at various time points after reseeding and analyzed by IFA as described above.
Viral DNA persistence assays.
Hues9 pNSCs (105) were seeded on Geltrex and infected 24 h later with TB40E at an MOI of 5. At various time points after the infection, cells were harvested. At each harvest time point, 105 cells were reseeded on Geltrex to propagate the infected culture, and 2 × 10⁵ cells were processed for IE immunofluorescence as described above. DNA was extracted from the remainder of the cells by using the QIAamp DNA blood minikit (Qiagen). The levels of viral and cellular DNA were monitored by amplification of a UL77 sequence, a UL46 sequence, and a GAPDH promoter sequence using TaqMan quantitative PCR as described above. DNA from noninfected pNSCs was concurrently extracted and analyzed by PCR to control for cross-contamination between samples. The viral genome standard curve was based on serial dilutions of a highly purified HB5 BAC preparation diluted in 500 ng of pNSC genomic DNA. The assay was optimized such that when the samples were run in triplicate, one copy of the viral genome could be detected using this standard curve. The standard curve for the number of cells in each sample was based on analysis of serial dilutions of highly purified pNSC genomic DNA using TaqMan quantitative PCR for amplification of the GAPDH promoter sequence.
For clonogenic assays, pNSCs were harvested at 24 h p.i. (MOI of 5) and were seeded in Geltrex-coated 96-well plates at low density (0.5 cell/well). Special care was taken to exclude wells with multiple clones or with signs of differentiation. At the indicated time points, DNA was extracted using DNAzol (Invitrogen). Carrier DNA (100 μg of genomic DNA from native pNSCs) was used when extracting DNA from cell-free virus or from random wells. Approximately 95% of each DNA sample was analyzed (in three separate reactions) for the presence of viral genomes by quantitative PCR as described above. The sum of the number of viral genomes was computed and was interpreted as the number of viral genomes per colony. The remaining 5% of the DNA sample was used to monitor the number of cellular genomes as described above. RNA was extracted from clones by using TRIzol (Invitrogen) and was precipitated in the presence of 100 μg of glycogen (Fermentas) and carrier RNA (from 500 pNSCs). Approximately 45% of each RNA sample was reverse transcribed using an IE1-specific primer and SuperScript VILO RT (Invitrogen) in iScript Select buffer (Bio-Rad) at 42°C for 90 min. Negative non-RT controls were generated the same way with 45% of the RNA sample but in the absence of RT. IE1 expression was monitored by TaqMan quantitative PCR using an amplicon spanning the junction between exons 3 and 4. PCR was performed in four separate reactions to cover 45% of the RNA sample. Positive controls were generated on RNA extracted from the equivalent of 1 IE+ pNSC (24 h p.i.) diluted in 25,000 uninfected pNSCs. Relative levels of expression and limits of detection were calculated using a standard curve constructed from a dilution series of cDNA from pNSCs at 24 h p.i. To control for recovery and quality of the RNA, the remaining 10% of the RNA sample was reverse transcribed with SuperScript VILO RT in VILO RT buffer [containing random hexamers and poly(dT) oligonucleotides]. G6PD expression was monitored in these samples by TaqMan quantitative PCR. Cell number equivalents were determined using a standard curve constructed from RNA extracted from known cell numbers.
RESULTS
Generation of human ES cell-derived primitive neural stem and progenitor cells.
To study HCMV infection in neural progenitors under well-defined conditions, we took advantage of a recently developed protocol to differentiate human embryonic stem (ES) cells into a highly homogeneous population of primitive prerosette neural stem cells (pNSCs) and neural progenitor cells (NPCs) (12). Briefly, ES cells were differentiated into pNSCs by a 7-day treatment with leukemia inhibitory factor (hLIF), a GSK3 inhibitor (CHIR99021), a TGF-β/activin receptor inhibitor (SB431542), and a Notch inhibitor (compound E). Differentiated cells were then maintained with hLIF, CHIR99021, and SB431542 on Geltrex-coated surfaces. These primitive cells retained ES cell-like clonogenic properties (Fig. 1A), were nonpolarized, and possessed N-cadherin+ tight cell-cell junctions (Fig. 1B). However, the cells did not express the pluripotency markers noggin and Oct4 (12). Further characterization of the pNSCs by flow cytometry with antibodies to specific markers showed that the cells proliferated (94% expressed Ki67), maintained one marker of pluripotency (98% expressed Sox2), and retained their neural lineage identity (99% expressed Nestin, and 96% expressed the neural-specific transcription factor Pax6) for more than 20 passages (Fig. 1C).
FIG 1.

Characterization of human Hues9 ES cell-derived pNSCs and NPCs. (A) Representative bright-field phase-contrast images of live pNSC and NPC cultures using a 10× objective lens. (B) Expression of N-cadherin (red) in pNSC colonies and lack of expression in NPCs as detected by IFA. (C) Flow cytometry analysis of the expression of Sox2, Pax6, Nestin, and Ki67 in pNSCs. (D) Expression of the neuronal marker βIII-tubulin (green) in pNSCs differentiated for 4 weeks in neuronal differentiation medium, as detected by IFA. (E) Expression of GFAP (green) and S100β (red) in NPCs generated de novo from pNSCs (5 days) or cultured for 5 weeks in matrix-free conditions as neurospheres as detected by IFA. For panels B, D, and E, nuclei were counterstained with Hoechst (blue). IFA images were acquired by epifluorescence microscopy, and those shown are representative of multiple fields. Scale bar, 25 μm.
The pNSCs are thought to represent a very primitive neural developmental stage, coinciding with the formation of the neural plate and fold but preceding the closure of the neural tube, which involves radial polarization of the neuroepithelium (12). Moreover, pNSCs are highly neurogenic and can be efficiently differentiated, even at high passage numbers (>25), to neurons that are βIII-tubulin+ and show axonal projections (Fig. 1D). These pNSCs can also be rapidly differentiated to S100β+ NPCs following a short treatment with FGF2 (Fig. 1A, B, and E). Analogous to what has been reported for fetal NPCs (9), long-term expansion of NPCs led to a gradual transition from neurogenic to gliogenic potential. Figure 1E shows that after 5 days in culture, all NPCs expressed S100β (red) but not the astroglial marker GFAP (green), whereas after 5 weeks in culture the NPCs coexpressed S100β and GFAP.
HCMV does not efficiently spread in pNSCs and NPCs.
To investigate the replication of HCMV in ES cell-derived neural stem and progenitor cells, we first infected Hues9-derived pNSCs and NPCs at a low MOI (0.1) with the clinical viral isolate TB40E and monitored IE1 and UL83 expression over time by IFA. For comparative purposes, the replication of HCMV in highly permissive HFFs was followed in parallel. As expected, TB40E readily infected HFFs (ca. 10% of the cells expressed IE1 at 48 h p.i.), and viral spread to neighboring cells was apparent at 96 h p.i. (Fig. 2). In contrast, very few pNSCs expressed IE1 at 48 h p.i. Moreover, it was rare to find an IE1+ cell that coexpressed UL83 (Fig. 2, see inset image for pNSCs) or UL44 (data not shown), and no evidence of viral spread could be detected. Infection of NPCs yielded approximately the same percentage of IE1+ cells as observed for HFFs. However, as was the case with pNSCs, only a very small number of IE1+ cells were also positive for expression of UL44 (data not shown) or UL83 (Fig. 2). When multiple fields were examined, less than 5% of the fields showed any immunofluorescence staining characteristic of plaquelike viral spread (Fig. 2, see insert for NPCs). These results indicate that Hues9-derived pNSCs and NPCs are very inefficient at supporting viral replication following a low-MOI infection.
FIG 2.

Spread of HCMV is very inefficient in Hues9-derived pNSCs and NPCs. IFA analysis with antibodies to IE1 (green) and UL83 (red) of HFFs, pNSCs, and NPCs infected with TB40E at an MOI of 0.1 and harvested at 48, 96, and 168 h p.i. Nuclei were counterstained with Hoechst (blue). Images were acquired by epifluorescence microscopy, and those shown are representative of multiple fields. Arrows point to rare IE1+ pNSCs. Inserts show rare UL83-positive pNSCs and NPCs. Scale bar, 100 μm.
Infection of pNSCs requires endothelium-tropic virus, and IE expression is impaired at a low MOI.
We then sought to investigate in greater detail the steps at which HCMV infection was restricted in pNSCs and NPCs. Given the decreased percentage of IE1+ pNSCs relative to that of NPCs when cells were infected at a low MOI, we assessed using the CH160 antibody the percentage of IE1/IE2-positive (IE+) cells after infection in Hues9-derived pNSCs and NPCs over a range of MOIs. NPCs and pNSCs were seeded on Geltrex-coated coverslips and were infected 24 h later with TB40E. At low MOIs (0.1 and 0.5), the percentage of IE+ cells was significantly less (5- to 7-fold) for pNSCs than for NPCs (Fig. 3A and B). As the MOI increased, the relative difference in infectivity between pNSCs and NPCs decreased. Nevertheless, even at a high MOI, a significant percentage of Hues9 pNSCs did not express IE. Approximately 25% of pNSCs expressed IE at an MOI of 5, and 40% expressed IE at an MOI of 20. Infecting at the time of cell seeding or 2 days postseeding did not significantly change the percentage of IE+ cells (data not shown). We also examined the infection of Hues9 pNSCs and NPCs with another clinical isolate and showed that this restriction of IE expression in pNSCs was not unique to TB40E (Fig. 3C). Moreover, infection at an MOI of 1 with the laboratory isolate Towne revealed even more restriction for IE expression in both pNSCs and NPCs compared to TB40E, suggesting that “endothelial” tropism was required for efficient IE expression in these primitive neural cells (Fig. 3D and E).
FIG 3.

IE expression is restricted in pNSCs at a low MOI. (A) Hues9 pNSCs and NPCs infected with TB40E at an MOI of 0.5 were analyzed by IFA at 24 h p.i. for IE (IE1 and IE2) expression (red) using the CH160 antibody. Nuclei were counterstained with Hoechst (blue). Images were acquired by epifluorescence microscopy. The results shown are representative of multiple experiments. Scale bar, 100 μm. (B) Quantification of the percentages of IE+ pNSCs and NPCs at 24 h after infection with TB40E at the different MOIs. Five randomly chosen fields (each containing approximately 150 to 200 cells) from two coverslips were quantified for each condition. The results shown are the means and standard deviations of the five fields obtained in one experiment. The results were reproduced in a second independent experiment. (C) Quantification of the percentage of IE+ pNSCs and NPCs at 24 h after infection with the Hillcrest1 clinical strain at an MOI of 0.1. (D) Hues9-derived pNSCs and NPCs infected with TB40E or Towne at an MOI of 1.0 were analyzed at 24 h p.i. for IE expression (green) by IFA. (E) Quantification of the percentages of IE+ pNSCs and NPCs following TB40E and Towne infection at an MOI of 1. (C and E) Quantifications were performed as described above. The results shown are the means and standard deviations of three independent experiments. Statistical significance was determined by paired Student t tests.
Viral entry into the cell and nuclear import of viral genomes are comparable for NPCs and pNSCs.
There were several possible explanations for the relatively low percentage of pNSCs that expressed IE, including defective viral entry or nuclear import of viral DNA, establishment of heterochromatin on viral DNA, or the absence of a transcription factor(s) required for efficient RNA synthesis driven by the major IE promoter/enhancer. To identify which of these events might be involved, viral entry was first monitored over a range of MOIs in Hues9-derived pNSCs and NPCs using a quantitative PCR assay to measure intracellular viral DNA at early times after infection. Parallel entry assays were performed at 4°C to ensure that the majority of the detected PCR signal was from intracellular viral DNA and not residual extracellular genomes (data not shown). Pairwise comparison of the relative copies of viral genomes at 6 h p.i. did not show any significant difference in entry efficiency for pNSCs and NPCs at all MOIs tested (Fig. 4A).
FIG 4.

Viral entry and nuclear import are not compromised in pNSCs. (A) Hues9 pNSCs and NPCs were seeded and infected 24 h later with TB40E at MOIs of 0.1, 0.5, and 5. At 6 h p.i., intracellular DNA was extracted as described in Materials and Methods, and the numbers of viral and cellular genomes in each sample were determined by quantitative real-time PCR using amplicons in the viral UL77 gene and the cellular GAPDH promoter, respectively. Viral genome levels were normalized between samples based on the number of copies of the GAPDH promoter. The graph in the top panel shows the relative number of viral genomes in pNSCs (white bar) and NPCs (gray bar) for each MOI. The data were normalized with the relative number of viral genomes in pNSCs at an MOI of 0.1, which was set to 1. In the bottom panel, the data are presented as the number of viral genomes in NPCs relative to pNSCs at a given MOI and show that at each MOI the same number of viral genomes had entered the NPCs and pNSCs, giving a ratio of 1. (B) pNSCs, NPCs, and HFFs were infected with TB40E at an MOI of 1, and at 12 h p.i. the nuclear import of viral genomes was determined by DNA FISH with probes directed against the viral genome (red) as described in Materials and Methods. Nuclei were counterstained with Hoechst (blue). Images were acquired by confocal microscopy. Confocal sections shown are representative of multiple fields.
To determine whether the intracellular viral genomes detected by quantitative PCR could be efficiently imported into the nuclei of pNSCs, DNA FISH assays were performed. HFFs and Hues9-derived pNSCs and NPCs were infected with TB40E at an MOI of 1 (Fig. 4B), and cells were fixed at several time points after infection. Fixed cells were subsequently hybridized with fluorescently labeled DNA probes against the viral genome, and the localization of viral genomes was determined by confocal microscopy. As expected, there was no signal in any of the uninfected cells. At 12 h p.i., viral DNA was readily detected in the nuclei of the infected HFFs, pNSCs, and NPCs, and there was no significant difference in the number of viral genomes present. These results suggest that nuclear import of the viral genomes is not defective in pNSCs.
Impaired relocalization of ATRX and nuclear import of UL82 correlate with defective IE expression in pNSCs.
ATRX and hDaxx, two components of PML bodies (also known as ND10 or nuclear bodies), have been shown previously to play a major role in silencing viral genomes by inducing the deposition and methylation of histones on the viral DNA (reviewed in reference 14). To determine whether inefficient relocalization of hDaxx and/or the absence of its degradation in pNSCs might be responsible for the IE expression defect, Hues9 NPCs and pNSCs were infected with TB40E at an MOI of 0.5, and the localization of hDaxx was monitored by IFA. As shown in Fig. 5A, hDaxx foci were dispersed at 6 h p.i. in the nuclei of both NPCs and pNSCs (nuclei are outlined for easier viewing). Similar results were seen at high MOIs (data not shown). Western blot analysis at 8 h p.i. showed that the decrease in the levels of hDaxx was comparable in pNSCs, NPCs, and HFFs (Fig. 5B). In NPCs, ATRX was efficiently redistributed at both low (MOI = 0.5) (Fig. 5C) and high (data not shown) MOIs. In contrast, the redistribution of ATRX was inefficient in pNSCs (Fig. 5C). Importantly, the percentage of pNSCs and NPCs displaying dispersed ATRX at 6 h p.i. was approximately equivalent to the percentage of cells expressing IE at 24 h p.i. (8 and 45%, respectively). Similar results were obtained for ATRX localization at 12 h and 24 h p.i. (data not shown), suggesting that inefficient disruption of ATRX foci could be responsible for impaired IE expression in pNSCs. However, we were not able to address this possibility directly, since knocking down the expression of ATRX in pNSCs significantly reduced cell growth kinetics and induced cell death (data not shown). The preferential relocalization of hDaxx in pNSCs relative to that of ATRX was not a result of mislocalization of these two proteins, as hDaxx and ATRX foci colocalized in both pNSCs and NPCs (data not shown).
FIG 5.

Inefficient nuclear import of pp71/UL82 in pNSCs correlates with impaired redistribution of ATRX but not hDaxx. (A) Immunofluorescence analysis with an antibody to hDaxx (green) shows redistribution at 6 h p.i. in the nuclei of Hues9 pNSCs and NPCs infected with TB40E at an MOI of 0.5. Images were acquired by confocal microscopy. Representative maximum z-axis projections are shown. Individual nuclei are delineated with dashed lines. (B) Western blot analysis of hDaxx in mock-infected and infected (MOI = 0.5) HFFs, NPCs, and pNSCs harvested at 8 h p.i. shows decreased levels of hDaxx in all infected cells. An antibody to tubulin was used as a sample loading control. Long and short exposures of the hDaxx blot are shown. (C) Immunofluorescence analysis with an antibody to ATRX (green) shows localization in nuclei of mock and infected cells as described for panel A. Arrows point to individual nuclei in infected NPCs showing redistribution of ATRX. (D) Immunofluorescence analysis with an antibody to viral pp71/UL82 (red) to show localization at 2 h p.i. in HFFs, pNSCs, and NPCs infected at an MOI of 5. Nuclei were counterstained with Hoechst (blue). Images were acquired by confocal microscopy. Representative confocal sections are shown. Arrows point to the rare foci of pp71 in the nuclei of infected pNSCs.
Given that the virion-associated matrix protein UL82 (pp71) has been shown to be responsible for the dispersion of hDaxx and ATRX foci in fibroblasts, we next assessed whether UL82 was efficiently transported into the nuclei of infected cells. NPCs, pNSCs, and HFFs were infected at an MOI of 5, and the cells were processed for immunofluorescence analysis 2 h later (Fig. 5D). Infected HFFs showed significant accumulation of UL82 foci in the nucleus, and fewer foci were detected in the NPCs. In contrast, UL82 foci could hardly be detected in pNSCs at 2 h p.i. Performing the same analysis at earlier or later time points did not improve the strength of the signal, suggesting that nuclear import of UL82 was impaired in pNSCs. These results suggest that the lower levels of nuclear UL82 observed in pNSCs might be sufficient to induce relocalization of hDaxx, but not ATRX. In the case of the NPCs, although import of UL82 into the nucleus was less efficient than in HFFs, a threshold level may have been reached to allow the dispersion of both hDaxx and ATRX.
pNSCs derived from different ES cell lines are defective for IE gene expression at a low MOI but, at a high MOI, segregate into two groups of permissivity based on the presence of the anterior marker FORSE-1.
To determine whether the low level of HCMV infection was specific to pNSCs and NPCs derived from Hues9 ES cells, we extended this analysis to pNSCs and NPCs derived from Hues6, Hues16, and H9 ES cells (Fig. 6). As was observed for cells derived from the Hues9 ES cells, infection at an MOI of 0.5 of the pNSCs and NPCs derived from the other 3 lines of ES cells consistently yielded a significantly lower percentage of IE+ cells in pNSCs compared to NPCs. Interestingly, at a higher MOI (MOI of 5), the pattern of infection of the pNSC lines segregated into two groups. Similar to what was observed for the Hues9-derived pNSCs, less than 40% of the Hues16 pNSCs were IE+ at 24 h p.i., suggesting that IE expression was still restricted even at high MOIs. In contrast, there were consistently 2- to 2.5-fold more IE+ cells (ca. 75 to 80% of the population) in the H9 and Hues6 pNSC cultures following infection at an MOI of 5.
FIG 6.
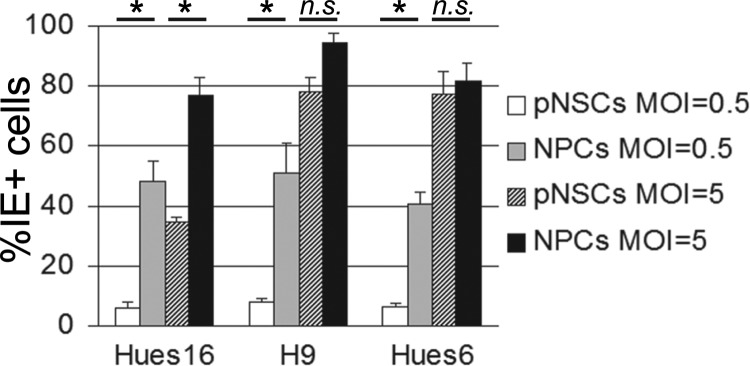
pNSCs derived from different ES cell lines are defective for IE gene expression at a low MOI, but at a high MOI they segregate into two groups of permissivity. Hues16-, H9-, and Hues6-derived pNSCs and NPCs were seeded on coverslips and infected 24 h later with TB40E at an MOI of 0.5 or 5. Cells were analyzed by IFA at 24 h p.i. for IE expression, and the percentage of IE+ cells was determined as described for Fig. 3. The results shown are the means and standard deviations of three independent experiments. Statistical significance (*, P < 0.05) was determined by one-way analysis of variance (ANOVA), followed by Tukey's multiple comparison tests on all pairwise comparisons; selected significance values are shown.
The results presented above suggested that a subset of Hues9 and Hues16 pNSCs, comprising ca. 50% of the total population, is inherently resistant to IE expression. The chemically defined culture conditions used to maintain pNSCs resulted in a highly homogeneous population of cells that express bona fide neural stem cells markers (Fig. 1) and possess a mesencephalic (midbrain) identity (12) (data not shown). All of the pNSC lines tested herein showed a similar homogeneous expression of the midbrain markers Nurr1, as well as the anterior transcription factor Otx2 (data not shown). Immunofluorescence analysis of the pNSC lines also showed that the proportion of cells expressing the neuronal precursor marker DCX (0 to 2%) and the astroglial marker GFAP (none detected) was negligible and could not account for the observed discrepancy in IE expression at a high MOI. Thus, the difference in permissivity for IE expression was not likely due to further differentiation of the Hues6 and H9 pNSCs, nor to a major change in anterior/posterior identity.
The original characterization of the Hues9 pNSCs by Li et al. (12) revealed that these cells showed heterogeneous immunofluorescence staining for the anterior marker FORSE-1, and we were able to confirm this (Fig. 7A). This heterogeneity in FORSE-1 staining could be recapitulated at the single-cell level in a clonogenic assay, confirming that the differential FORSE-1 expression is intrinsic to Hues9 pNSCs and does not represent different subpopulations of cells (Fig. 7B). Surprisingly, costaining of infected Hues9 pNSCs for FORSE-1 and IE expression showed that IE expression was largely restricted, even at high MOI, to pNSCs with low or no FORSE-1 staining (Fig. 7B). In addition, analysis of FORSE-1 expression in the “more permissive” Hues6- and H9-derived pNSCs by immunofluorescence revealed that these cell lines were negative for this marker (Fig. 7C). In contrast, as was the case for Hues9 pNSCs, the “less permissive” Hues16-drived pNSCs displayed heterogeneous staining for FORSE-1 (Fig. 7C). Moreover, NPCs were also found to be negative for the presence of the FORSE-1 epitope (Fig. 7A). We separated Hues9 pNSCs based on their FORSE-1 expression using magnetic beads, but the cells were able to reestablish FORSE-1 heterogeneity within 24 h, therefore precluding any direct analysis of viral infection and IE expression in the sorted populations (data not shown).
FIG 7.

IE expression is generally confined to pNSCs with low expression of the FORSE-1 epitope. (A) Immunofluorescence analysis of Hues9 pNSCs and NPCs with the monoclonal antibody FORSE-1 (green). Nuclei were counterstained with Hoechst (blue). Images were acquired by epifluorescence microscopy, and those shown are representative of multiple fields. (B) Immunofluorescence analysis with antibodies to FORSE-1 (green) and viral IE (red) of Hues9 pNSCs infected with TB40E at various MOIs (or mock infected), as indicated on the figure panel, and harvested at 24 h p.i. Images were acquired by epifluorescence microscopy, and those shown are representative of multiple fields. (C) Hues16, Hues6, and H9 pNSCs were seeded and stained with the FORSE-1 antibody as described in panel A. Scale bars, 100 μm.
Treatment of pNSCs with the caudalizing agent all-trans retinoic acid results in a higher level of IE expression.
Since FORSE-1 is a marker of rostral (anterior) positioning (15), the above results suggested that cells that had characteristics reflecting more caudal (posterior) positioning in the mesencephalon might correlate with enhanced IE expression. To address this possibility, Hues9 pNSCs were treated for 3 weeks with the caudalizing agent all-trans retinoic acid (RA), effectively abolishing FORSE-1 expression (Fig. 8A). Importantly, RA did not induce the differentiation of pNSCs, as determined by immunofluorescence with antibodies to N-cadherin (Fig. 8B), and DCX (Fig. 8C) did not affect the proliferation and clonogenic capacities of these cells (Fig. 8B) and did not change their mesencephalic identity as indicated by staining with antibody to Nurr1 (Fig. 8D).
FIG 8.

Pretreatment with retinoic acid (RA) restores IE expression in pNSCs. (A) Hues9 pNSCs (pNSCs) and pNSCs pretreated for 3 weeks with retinoic acid (RA) were seeded on coverslips and 48 h later analyzed by IFA with a FORSE-1 monoclonal antibody (green). (B) pNSCs and RA-pretreated pNSCs were analyzed 5 days after seeding on coverslips by IFA with an antibody against N-cadherin. (C and D) RA-pretreated pNSCs (RA) and pNSCs were seeded on coverslips and 48 h later analyzed by IFA with antibodies against DCX (green) (C) and Nurr1 (green) (D). (E) pNSCs and RA-pretreated pNSCs were seeded on coverslips and infected 24 h later with TB40E at an MOI of 0.5, either supplemented or not with 1 μM RA during infection, as indicated on the figure panel. Cells were analyzed by IFA at 24 h p.i. with antibody against IE (green). (A to E) Nuclei were counterstained with Hoechst (blue). Images were acquired by epifluorescence microscopy. The images shown are representative of multiple fields. Scale bar, 100 μm. (F) pNSCs and RA-pretreated pNSCs were infected 24 h after seeding on coverslips with TB40E at an MOI of 0.5. At 6 h p.i., cells were analyzed by IFA with an antibody against ATRX (green). Individual nuclei are delineated with dashed lines, and the arrow shows a RA-pretreated infected cell with a small amount of redistribution of nuclear ATRX. Images were acquired by confocal microscopy. Representative maximum z-axis projections are shown.
Infection of RA-pretreated cells with TB40E revealed that IE expression was restored at both low (MOI of 0.5) (Fig. 8E) and high (data not shown) MOIs. Because IE expression has previously been shown to be directly enhanced by RA via binding of the retinoic acid receptor to a retinoic acid response element in the major immediate-early promoter (MIEP) (16–18), we sought to determine whether the increased IE expression in Hues9 pNSCs was truly due to the induction of a caudal cellular identity or whether it was simply the result of a direct enhancement of the MIEP. To distinguish between these two possibilities, both untreated and RA-pretreated Hues9 pNSCs were infected in the presence or absence of RA (Fig. 8E). When pNSCs were exposed to RA only during the infection, there was only a minor effect on the percentage of IE-expressing cells. In contrast, infection of RA-pretreated pNSCs in the absence of RA resulted in a major increase of IE-expressing cells that could be further increased when the RA-pretreated cells were maintained in the presence of RA during the infection. These results suggest that establishment of a more posterior cellular identity in Hues9 pNSCs leads to increased IE expression. However, there also may be a direct effect of RA on the MIEP in the context of the caudal environment, since the maximal effect on IE expression is obtained when RA is maintained during the infection.
Surprisingly, infection in the presence of RA of pNSCs pretreated with RA only modestly increased the number of cells showing relocalization of ATRX (Fig. 8F), suggesting that the activation of IE transcription in RA-treated pNSCs might bypass the need for dispersion of the transcriptional repressor. Indeed, in RA-treated pNSCs (infected in the presence of RA), IE expression could be detected as early as 6 h p.i. by immunofluorescence. In contrast, IE expression was barely detectable in untreated pNSCs, as well as in NPCs, by 12 h p.i. (data not shown). Overall, these results indicate that a caudal (posterior) identity may be more favorable for IE expression in the initial stages of formation of the neural tube by pNSCs. However, as pNSCs differentiate to NPCs, IE expression becomes efficient even in the absence of caudal patterning cues.
Progression to early gene expression is inefficient in pNSCs and NPCs but increases in NPCs with extended culture.
During the initial characterization of TB40E replication in pNSCs and NPCs (Fig. 2), a major difference in the number of IE1-expressing cells and those also expressing early (UL44) or late genes (UL83) was noted. To investigate in more detail this apparent defect in the transition from IE to early gene expression, we infected HFFs and Hues9-derived pNSCs and NPCs at different MOIs and monitored the percentage of IE1+ cells coexpressing UL44 at 72 h p.i. (Fig. 9A and B). At low MOIs, only a small percentage of IE1+ cells also expressed UL44 in NPCs, compared to HFFs. This defect could be partially overcome by performing infection at high MOIs (Fig. 9B). In pNSCs, because of highly restricted IE expression, the number of UL44 expressing cells was much lower than in NPCs for a given MOI. However, when the number of IE+ cells was normalized (by infecting pNSCs at an MOI of 5 and NPCs at an MOI of 0.5), the percentage of IE1+ pNSCs that also expressed UL44 was similar to that of NPCs (Fig. 9B, compare the percentage of IE-positive cells that are UL44+ at an MOI of 0.5 for NPCs [black bar] to the percentage of IE-positive cells that are UL44+ at an MOI of 5 for pNSCs [gray bar]). Even at very high MOIs, the transition to early gene expression was lower in NPCs and pNSCs than in HFFs (Fig. 9A and B). Performing the analyses at earlier or later time points did not significantly alter the results (data not shown). It should be noted that the percentage of IE+ cells in these experiments (72 h p.i.) was lower than that observed at 24 h p.i. (Fig. 3A and B), since noninfected cells were able to expand significantly during the two time intervals. Importantly, the defect was also observed with the early gene UL57, as well as the early-late gene UL83 and the late gene UL99 (data not shown), and was not unique to TB40E, since it was also observed with another clinical isolate (data not shown). Taken together, these results show that the transition from IE to early gene expression was severely compromised in Hues9 pNSCs and NPCs.
FIG 9.

Transition to early and late gene expression is impaired in pNSCs and NPCs but increases in NPCs upon extended culture. (A) Hues9 pNSCs, NPCs, and HFFs were seeded on coverslips and infected 24 h later with TB40E at different MOIs. At 72 h p.i., cells were analyzed by IFA with monoclonal antibodies against IE1 (green) and UL44 (red). Nuclei were counterstained with Hoechst (blue). Images were acquired by epifluorescence microscopy. Only representative images obtained for an MOI of 0.5 (HFFs and NPCs) and 5 (pNSCs) are displayed. Infection results obtained with an MOI of 5 are displayed for pNSCs to provide a comparable number of IE1+ cells. Phenotypes displayed were reproduced in several independent experiments. Scale bar, 100 μm. (B) Quantification of the percentages of UL44+ cells among IE1+ cells obtained for various MOIs in panel A. Five randomly chosen fields (each containing approximately 600 to 700 cells) from two coverslips were quantified for each condition. The results shown are the means and standard deviations obtained in one experiment. The results were reproduced in a second independent experiment. (C) Hues16-, H9-, and Hues6-derived NPCs were infected 24 h after seeding with TB40E at an MOI of 0.5 or 5. Cells were stained as described above, and the percentage of UL44+ cells among IE1+ cells was quantified as described above. The results shown are the means and standard deviations of three independent experiments. Statistical significance was determined by one-way ANOVA, followed by Tukey's multiple-comparison tests between infections at the same MOI, and significance values are shown for comparisons to Hues16-derived NPCs (*, P < 0.05 for an MOI of 0.5; **, P < 0.05 for an MOI of 5). (D) De novo-generated Hues9 NPCs (5 days) and 5-week-old NPCs (5 weeks) were infected 24 h after seeding with TB40E at an MOI of 0.1. Cells were stained as described above, and the percentage of UL44+ cells among IE1+ cells was quantified and presented as in panel C. Results of three independent experiments were combined, and the statistical significance was determined by using a paired Student t test.
This analysis was also extended to pNSCs and NPCs derived from other ES lines (Hues16, Hues6, and H9). As was observed for Hues9 pNSCs and NPCs, increasing the MOI in Hues16 pNSCs (data not shown) and NPCs (Fig. 9C) partially restored the transition to early genes. However, this transition was approximately 2.5- to 3-fold more efficient at both low and high MOIs in H9- and Hues6-derived pNSCs (data not shown) and NPCs (Fig. 9C, P < 0.05).
This block in early gene expression at low MOIs in pNSCs and NPCs was not a result of a defect in the disruption of PML bodies by IE1, since PML was relocalized efficiently in all IE1+ pNSCs and NPCs irrespective of their UL44 expression status (data not shown). Interestingly, when Hues9 NPCs were maintained in culture for 5 weeks prior to infection, they showed an enhanced transition to early gene expression (Fig. 9D), suggesting that NPCs have to be strictly maintained at low passages in order to observe this restriction. An increase in permissivity as NPCs were maintained in culture was also recently reported by Pan et al. (9). It should be noted that although treatment of Hues9 pNSCs with the caudalizing agent RA eliminated the IE expression defect, it did not significantly impact the transition to early gene expression (data not shown). This suggests that while the restriction of IE and early gene expression appears to cosegregate in different pNSC lines, the mechanisms underlying the two restriction points likely differ.
pNSCs produce low titers of cell-associated virus, and the virus shows reduced replication in neural cells relative to virus produced in HFFs.
Given that a high MOI can overcome the IE and early gene expression defect, infectious center assays were performed to determine whether Hues9 pNSCs and NPCs could produce virus that would spread to adjacent cells. pNSCs and NPCs were infected with TB40E at an MOI of 20. At 24 h p.i., infected cells were harvested and reseeded with uninfected cells. Viral spread was then monitored by staining with antibodies against IE1, UL44, and UL83 at several time points after reseeding. As expected, these infectious center assays performed at high MOIs in pNSCs and NPCs showed an increased percentage of IE1+ cells transitioning to early and late gene expression (Fig. 10A and data not shown). However, even under these conditions, we did not detect any evidence of spread in pNSCs (Fig. 10A, an arrow highlights a UL44+ pNSC that did not initiate viral spread even at day 7 p.i.). In NPCs, plaquelike structures consisting of IE1+ cells surrounding a central UL83+ or UL44+ cell could be detected by 7 days p.i. Nevertheless, these surrounding IE1+ cells rarely coexpressed early or late genes (Fig. 10A). In addition, ca. 25% of UL44+ NPCs did not show any evidence of viral spread even at day 7 p.i (Fig. 10A, arrow), and an additional 25% of UL44+ NPCs had only very few IE+ cells immediately surrounding the central UL44+ cell. These results suggest that in addition to the restriction points identified at the level of IE (pNSCs only) and early (pNSCs and NPCs) gene expression, there might be additional factors preventing efficient spread of HCMV in these cells.
FIG 10.

Analysis of virion production, release, and tropism in pNSCs and NPCs. (A) Hues9 pNSCs and NPCs were infected with TB40E at an MOI of 20 and were processed for a viral infectious center assay as described in Materials and Methods. At various time points after infection (only day 7 is shown), cells were analyzed by IFA with monoclonal antibodies against IE1 (green) and UL44 (red). Nuclei were counterstained with Hoechst (blue). Images were acquired by epifluorescence microscopy, and those shown are representative of multiple fields. Arrows point to IE1+/UL44+ pNSCs and NPCs that did not spread virus to neighboring cells. Scale bar, 100 μm. (B) pNSCs and NPCs were infected 24 h postseeding with TB40E at an MOI of 5 (pNSCs) or 0.5 (NPCs). At 120 h p.i., supernatants and cells were harvested and processed as described in Materials and Methods. Virus titers in cell extracts were determined by plaque assay in HFFs and are expressed as PFU per cell relative to titers obtained in pNSCs (set at 1). There was no detectable infectious virus in the supernatants, and thus results are only shown for cell-associated virus. The results in the graph are the average of three independent experiments. Differences are statistically significant (P < 0.05) according to a paired Student t test. (C) HFFs and NPCs were seeded on coverslips and 24 h later infected with dilutions of cell-associated virions obtained from infected HFFs and NPCs (prepared as described for panel A). Two days after infection, cells were analyzed by IFA with a monoclonal antibody against IE (red). Nuclei were counterstained with Hoechst (blue). Images were acquired by epifluorescence microscopy. Scale bar, 100 μm. (D) Quantification of the percentage of IE+ NPCs relative to HFFs obtained in C). The results shown represent the averages of three independent experiments. Differences were statistically significant (P < 0.01) according to a paired Student t test.
To determine whether pNSCs and NPCs could produce significant amounts of infectious virus, supernatant and cells were harvested at several time points after an initial infection at MOIs of 5 in pNSCs and 0.5 in NPCs and HFFs. The two different MOIs were used to obtain an equivalent percentage of IE+ cells at 24 h p.i. The levels of both cell-free and cell-associated virus produced in these cells at various time points were then determined by plaque assay in HFFs. We were unable to detect infectious virus released into the supernatant from either pNSCs or NPCs at any time point in the assay (data not shown). At the peak of the infection (120 h), however, cell-associated virus could be detected in both pNSCs and NPCs (Fig. 10B). Strikingly, even when the percentage of IE+ cells was the same by using differential MOIs, there was a 6-fold decrease (P < 0.05) in the titers of cell-associated virus in pNSCs (average titers of 0.4 PFU/cell) compared to NPCs (average titers of 2.5 PFU/cell) (Fig. 10B). In contrast, the cell-associated titers produced in HFFs were on the order of 12 PFU/cell (data not shown). Although the titer of cell-associated virus in NPCs was significantly lower than in HFFs, it should nevertheless have been sufficient to promote expression of UL44 or UL83 in neighboring newly infected IE1+ cells, suggesting that newly formed virions were either not transmitted very efficiently or were poorly infectious in neural cells. To determine whether virions produced in pNSCs and NPCs were as infectious in NPCs as in HFFs, cell-associated virions were collected as described above. Serial dilutions of cell-associated virion preparations (harvested from pNSCs, NPCs, and HFFs) were then used to infect HFFs and NPCs, and IE expression was monitored by immunofluorescence at 24 h p.i. (Fig. 10C). Cell-associated virions produced in HFFs showed a marginal increase (1.4-fold) in infectivity in NPCs (Fig. 10C and D) compared to HFFs. Strikingly, NPC-associated (Fig. 10C and D) and pNSC-associated virus (data not shown) was significantly less infectious in NPCs than in HFFs, suggesting that the tropism of virions was altered. Quantification of the percentage of IE-expressing cells showed a 5-fold decrease (P < 0.01) in infectivity in NPCs compared to HFFs (Fig. 10D). Performing similar experiments with an initial infection at an MOI of 20 increased cell-associated titers but did not significantly improve the poor neural infectivity of NPC- and pNSC-associated virus (data not shown).
Viral genomes persist in pNSCs for an extended period of time, and infectious virus can be produced upon differentiation to neurons.
As shown above, viral infection in pNSCs was largely nonprogressive and did not appear to induce overt cell death. Thus, we sought to determine whether these primitive neural cells could act as a reservoir for the virus. In two independent experiments, we infected Hues9-derived pNSCs with TB40E at an MOI of 5 and extracted DNA at various time points following infection. The number of viral genomes was then monitored in the population of infected pNSCs by sensitive quantitative real-time PCR assays capable of detecting one copy of the viral genome (Fig. 11A). In parallel, pNSC cultures were analyzed for IE expression by IFA. The results were very similar in both experiments. The number of IE+ pNSCs gradually decreased as the experiment progressed, (ca. 10% at 3 days p.i. and 0.5% at 7 days p.i.) and became undetectable by 12 to 14 days p.i. (based on an analysis of 200,000 cells). At 72 h p.i. the average viral genome copy number per cell in the population was approximately 50 (Fig. 11B). This number gradually decreased as the experiment progressed, due to cell division in the population. However, although no IE gene expression could be detected by IFA, ∼2 copies of viral genome per 10,000 cells could still be detected 1 month postinfection (after approximately 25 cell doublings). The results were the same with two independent qPCR amplicons within the HCMV genome (in the UL77 and UL46 coding sequences) 50 kbp apart (Fig. 11B), suggesting that the viral genome likely persists in its entirety. Initially, the maintenance of viral genomes in pNSCs appeared passive, since viral genomes were neither selected for nor against (i.e., the average viral genome copy number per cell decreased proportionally with cellular division, see the black bars in Fig. 11B). However, it appeared that at day 19 or 20 there was no further decrease in the average copy number per cell, although cell division continued, suggesting that the viral genome was stably associated with the cell.
FIG 11.

Viral genome persistence in pNSCs. (A) A viral genome standard curve was generated by serial dilution of a highly purified HB5 BAC preparation, diluted in 500 ng of native pNSC genomic DNA. The TaqMan quantitative PCR assay was optimized such that one copy of the viral genome could be detected. Two amplification reactions of sequences in the UL77 and UL46 genes were developed. A representative example of the standard curve using the UL77 amplicon is shown. (B) Hues9 pNSCs were infected with TB40E at an MOI of 5. At various time points after infection (as indicated), cells were harvested, DNA was extracted, and quantitative real-time PCR was performed to determine the number of viral genomes per 10,000 cells. PCR assays were performed in triplicate, and the average of these is represented on the graph. The results of two independent experiments are shown. Two separate amplicons in the highly conserved coding region of the UL77 and UL46 genes were used for quantification of viral genomes. Based on the averaged viral genome copy numbers obtained at day 6 p.i. (left panel) or at day 3 p.i. (right panel), the expected theoretical number of genomes for each subsequent time point was calculated assuming a neutral selection model. (C) Hues9 pNSCs were infected with TB40E at an MOI of 5. At 24 h p.i., cells were harvested and reseeded at low density (0.5 cell/well) in 96-well plates for clonogenic expansion. At the indicated time points postexpansion, DNA was extracted from pNSC clones, and quantitative real-time PCR was performed as described above. PCR assays were performed in triplicate (95% of the DNA sample was analyzed) and the sum of these is represented on the graph. Three independent experiments were performed. The total numbers of clones analyzed and number of clones positive for viral DNA are shown for each time point. The number of viral genomes from individual clones is presented in dot plots. Only clones positive for viral DNA are depicted. The median number of viral genomes in positive clones is shown as a line for each time points. Differences were not statistically significant according to a Mann-Whitney test. (D) Hues9 pNSCs were infected and clonally expanded as described for panel C. At the indicated time points postexpansion, DNA was extracted from pNSC clones, and quantitative real-time PCR was performed as described above. For the day 1 (D1) time point, DNA was extracted from random wells, whereas for the other time points, DNA was extracted from wells with visible colonies. The results are depicted in dot plots as described for panel C. Statistical significance was determined by a Kruskal-Wallis test combined with Dunn's multiple comparison test. (E) Hues9 pNSCs were infected and clonally expanded as described for panel C. At the indicated time points postexpansion, RNA was extracted from pNSC clones, reverse transcribed using an IE1-specific primer and quantitative real-time PCR was performed to monitor IE1 expression as described in Materials and Methods. PCR assays were performed in quadruplicate (45% of the RNA sample was used), and the averages of these are represented in the graph. Two independent experiments were performed. The number of clones analyzed for each experiment is shown. Positive controls were generated using RNA extracted from 1 IE+ pNSCs (24 h p.i.) diluted in 25,000 native pNSCs. The relative levels of expression for each clone (shown as individual dots) and limits of detection (light dashed line, set at 1) were calculated using a standard curve constructed from a dilution series of infected pNSC cDNA. Mean levels of IE1 RNA in lytically infected single pNSCs at 24 h p.i. were 57.6-fold higher (bold dashed line) than the limit of detection of the assay (light dashed line).
Because interpretation of the average viral genome copy number in polyclonal populations can sometimes be misleading and because very low levels of IE1 RNA could still be detected up to 17 days p.i. in the polyclonal populations (data not shown), we performed a second set of experiments to monitor the persistence of viral genomes in pNSCs at the single-cell level using clonogenic assays. Hues9-derived pNSCs were infected with TB40E at an MOI of 5 as described above. At 24 h p.i., when there were ca. 40% IE+ cells, cells were harvested and reseeded at very low density (average of 0.5 cell/well) in 96-well plates to allow the generation of a colony derived from a single infected pNSC. At the end of 2 or 3 weeks, the entire DNA sample from a colony was divided into three aliquots for quantitative PCR analysis. The results showed that at 3 weeks postexpansion, ca. 50% of colonies harbored viral genomes (Fig. 11C, left panel). The median copy number in the colonies was 2.5 viral genomes. In two other independent experiments, comparison of viral genome number in pNSC colonies at 2 weeks postexpansion versus 3 weeks postexpansion (Fig. 11C, middle and right panels) showed that differences in the percentage of colonies positive for viral DNA were comparable (78% of colonies were positive at 3 weeks compared to 58% at 2 weeks). The number of viral genomes per colony also was similar, with a median of 3 viral genomes at 3 weeks compared to 2 viral genomes at 2 weeks (difference not statistically significant). To exclude the possibility that this apparent maintenance of viral genomes was due to the persistence of input cell-free virus affixed to the basement matrix, 5 PFU equivalents of Accutase-treated virus were “seeded” in 10 wells, and DNA was extracted (using carrier DNA) 24 h later. Quantitative PCR analysis of these samples showed that none of the wells had residual cell-free viral DNA. In contrast, approximately 120 viral genomes could be amplified in a positive control in which DNA was directly extracted from 1 PFU of virus plus carrier (data not shown). Therefore, these results indicate that HCMV genomes persisted in colonies derived from an individual infected pNSC with high efficiency.
Given the discrepancy between the average viral genome numbers at 72 h p.i. at the population level (approximately 50 copies) and the median copy number at 2 or 3 weeks after clonal expansion (2 to 3 copies), we performed an additional clonogenic experiment to evaluate whether there was a potential loss of viral genetic material before the viral genome became stably associated with the cells. DNA was harvested at 1 day postseeding from random wells and at 7 and 14 days postseeding from wells that contained a visible colony. Viral genome numbers were determined as described above. As shown in Fig. 11D, the median number of viral genomes at 1 day postseeding was 16.8 versus 15.3 at 1 week postseeding. In contrast, at 2 weeks postseeding the median number of genomes had decreased to 2.5, which was significantly lower than the median at 1 day postseeding (P < 0.05). These results indicate that after an initial loss of viral genetic material in the first 2 weeks of clonal expansion, viral genomes were then stably maintained.
In all of the above clonogenic assays, we noted that although the majority of the colonies contained 2 to 3 viral genomes by 14 days postseeding, 9 to 28% of the positive clones contained between 10 and 150 viral genomes. We do not know whether this was due to a single cell containing a high number of viral genomes, or a greater number of cells in a colony that stably maintained a few genomes.
To determine whether the long-term maintenance of viral genomes in these clonogenic assays was due to a low-level persistent infection, we monitored IE1 expression levels in clonally expanded infected pNSCs from two independent experiments using a very sensitive quantitative reverse transcription-PCR (qRT-PCR) assay. As a positive control to establish the levels of IEI expression in cells initially infected at an MOI of 5, the infected pNSCs (at 24 h p.i.) were diluted such that RNA extracted from a single infected pNSC was used in the qRT-PCR assay. Importantly, in six independent assays, we determined that the IE1 expression levels in a single cell at 24 h p.i. were an average of 57.6-fold above the limit of detection (Fig. 11E). In contrast, IE1 expression could be detected in only 2 clones (out of 16) at 1 week postseeding and in 2 clones at 2 weeks (out of a total 37 clones from two independent experiments) (Fig. 11E). Although one of these clones displayed levels of IE1 comparable to the level seen in a single cell at 24 h p.i., IE1 was barely detectable in the remaining three positive clones. We were able to readily detect cellular glucose 6-phosphate dehydrogenase transcripts in all clones, ruling out the possibility that there were inhibitors of the PCR in the samples. It was technically not feasible to quantify viral genome copies in the same clones, but based on the data presented in Fig. 11C and D, it is expected that the percentage of clones containing viral genomes was ca. 65% (average of seven assays, ranging from 50 to 87%). The approximate number of clones in Fig. 11E containing viral DNA would be 10 out of 16 at day 7 and 24 out of 37 at day 14. The percentage of clones containing viral DNA and also expressing IE1 was therefore ca. 20% at 1 week postseeding (2 out of 10) and 8% at 2 weeks (2 out of 24). The majority of the clones had levels of IE1 expression (if any) below the limit of detection; i.e., at least 57-fold below the levels of IE1 at 24 h p.i. (Fig. 11E). Therefore, these results suggest that the stable maintenance of viral genomes in 50% of the total clonal population (that is to say in 80 to 90% of clones positive for viral DNA) was unlikely to be due to the persistence of a single pNSC expressing IE1.
The ability of pNSCs to act as a reservoir (either latent or maintaining low-level infection) for the virus was evaluated by placing individual infected pNSC clones (after 2 weeks of expansion) under conditions that promote differentiation into neurons. In the first experiment, we monitored viral replication by IFA of differentiated clones at 3 weeks after differentiation. In 1 of 17 differentiated clones, we detected evidence of viral replication and spread, as defined by a plaque consisting of IE+ cells surrounding a central UL99+ cell (Fig. 12). In no cases did we observe evidence of viral spread in pNSCs when maintained in an undifferentiated state (Fig. 10A). In the second experiment, we investigated whether infectious virus was formed in the differentiated neurons by sonicating the clones at 3 weeks after differentiation and placing the lysate on HFFs. We found that lysate from 1 of 24 individual clones produced greater than 10 plaques on HFFs (Fig. 12B). In contrast, no infectious virus could be detected from lysates of infected pNSC clones harvested at 14 days after seeding prior to differentiation. The frequency of viral reactivation in these experiments is higher than that observed in the myeloid in vitro latency model, in which reactivation occurs in 1 in 10,000 infected cells (19).
FIG 12.

Reactivation of HCMV replication upon neuronal differentiation of infected pNSC clones. Hues9 pNSCs were infected with TB40E at an MOI of 5. At 24 h p.i., cells were harvested and reseeded at low density (0.5 cell/well) in 96-well plates for clonogenic expansion. At 2 weeks postexpansion, the clones were harvested, seeded in 12-well plates (1 clone/well), and allowed to differentiate into neurons for 3 weeks. Reactivation of HCMV replication was monitored by immunofluorescence analysis of the differentiated clones or by inoculation of HFFs with a sonicate of differentiated clones. (A) Immunofluorescence analysis of a clone showing reactivation of HCMV replication. Cells were stained with monoclonal antibodies against UL99 (green) and IE (red) protein. Nuclei were counterstained with Hoechst (blue). Images were acquired by epifluorescence microscopy. Scale bar, 100 μm. (B) Table summarizing the results of two reactivation experiments and displaying the total number of clones analyzed, as well as the number of clones positive for HCMV replication. Clones were considered positive for HCMV replication when at least one plaque-like structure consisting of IE+ cells surrounding a central UL99+ cell could be detected or when greater than 10 plaques could be detected in HFFs inoculated with cell sonicate.
Overall, our results indicate that primitive neural stem and progenitor cells have restricted permissivity for HCMV, and viral replication is compromised in these cells. They further suggest that primitive cells of the neural lineage might constitute a reservoir for HCMV in the CNS.
DISCUSSION
HCMV is the major infectious cause of congenital birth defects, and it has been proposed that direct infection of cells of the neural lineage during development might be responsible. Although very few aborted fetuses have been examined immunohistologically for HCMV viral antigens in brain slices, it appears that most cell types in the brain are susceptible to infection. The region of the brain showing the highest levels of viral antigens is the subventricular zone of the lateral ventricles in the telencephalon (reviewed in reference 1).
Several animal models have been developed to address the mechanisms by which CMV might disrupt highly ordered cerebral developmental processes (3, 20, 21). However, given the artificial routes of CMV infection in most of these models as well as the weak sequence homology between human and animal CMV genomes, it is unclear whether the described mechanisms of CNS developmental defects and hearing loss in animal models accurately recapitulate the human disease.
As an alternative approach, other investigators have developed in vitro models of HCMV infection of human neural cells in culture. In most studies, NPCs isolated from aborted fetuses (fNPCs) were expanded in vitro. These fNPCs were shown to be fully permissive to HCMV infection and replication (4–8), but there were inconsistencies in the kinetics of replication, the presence of cell-free virus, as well as the infectivity of laboratory strains of virus. Importantly, infection of fNPCs inhibited their self-renewal (22), as well as their differentiation into neurons and astrocytes. Recently, D'Aiuto et al. (10) used induced pluripotent stem cells (iPSCs) to generate rosette-type neural stem cells (R-NSCs) and NPCs. Late antigens could be detected following infection of iPSC-derived R-NSCs and NPCs, and further neuronal cell differentiation was inhibited (10). While in all studies in vitro-differentiated astrocytes were able to fully support HCMV replication (4–6, 23), the results of infection of neurons differentiated in vitro varied considerably (4–6, 10). The mechanisms underlying HCMV-induced in vitro differentiation defects also appeared to differ. Some investigators found significant HCMV-induced apoptosis of infected neural cells (7, 8, 10, 23), whereas others did not (5, 6, 22). Moreover, Luo et al. as well as D'Aiuto et al. found that HCMV infection of NPCs considerably downregulated expression of neural genes (10, 22). The reasons for these discrepancies in viral replication and cellular phenotypes are not readily apparent but may be related to the presence of a heterogeneous population of cells that includes cell types at different levels of maturation, as well as to the use of culture conditions that do not support long-term maintenance of defined cellular identities.
In the studies reported here, we created several lines of highly homogeneous primitive prerosette neural stem cells (pNSCs) from human ES cells using chemically defined conditions. Since we were concerned that the results could be specific to a particular source of ES cells, we analyzed HCMV infection in pNSCs and NPCs derived from four different ES cell lines. The main advantages of these pNSCs are that they can be stably maintained in culture for dozens of passages without a decrease in self-renewal capacity and neural multipotency. The cells are also clonogenic, form tight junctions with neighboring cells, do not show radial polarization, and possess a mesencephalic identity (Fig. 1). These pNSCs can also be easily converted to de novo NPCs, avoiding the need to maintain and expand this rapidly evolving cell population. The NPCs constitute a more differentiated population of cells that are initially proneurogenic (i.e., they differentiate mainly into neurons) but gradually mature into astroglial precursors cells after several weeks in culture (24).
We found that infection of pNSCs with HCMV at a low MOI was restricted for IE gene expression, for the transition to early gene expression, and for the production of infectious virus. Surprisingly, pNSC-derived NPCs were still restricted at low MOIs for the transition to early gene expression and therefore could not support efficient viral replication. The infectivity of viral particles produced in NPCs was also significantly lower in cells of the neural lineage compared to HFFs. At a high MOI, the restriction imposed at the individual steps of the viral life cycle decreased, but even under these conditions, we could not detect multiple cycles of viral spread. Taken together, these data show that pNSCs and NPCs cannot efficiently support productive HCMV infection. These results are in contrast to those obtained in fetal NPCs and in iPSC-derived R-NSCs and NPCs, which appear to be fully permissive for HCMV replication. Other differences observed between our study and previously published results are the absence of cell-free virus produced in infected ES cell-derived pNSCs and NPCs and the requirement for viral endothelial cell tropism for efficient IE expression.
There are multiple possibilities that could explain the discrepancies between these previous results and the present data obtained using ES cell-derived pNSCs and NPCs. The most important factors are probably the MOI and the purity, homogeneity, and passage history of the cell populations. In most of the prior studies, a significant proportion of the cells expressed markers of more differentiated cells, such as DCX (neuronal precursor cells), GFAP (radial glial cells, astroglial cells, and astrocytes), and βIII-tubulin (immature and mature neurons). In contrast, in the pNSC and NPC populations used here only 1 to 2% of the cells were positive for DCX, and none expressed GFAP or βIII-tubulin (data not shown). Interestingly, a defect in the transition to early and late gene expression at a low MOI, a requirement for endothelial cell tropism for optimal IE expression, and the absence of released virus were also observed in fNPCs in the study by Odeberg et al. (7). Importantly, these fNPCs were obtained from fetuses aborted early in gestation (5 to 12 weeks), were maintained in culture for a limited number of passages, and showed high neurogenic potential with little expression of GFAP. The expression of GFAP in NPC populations expanded in vitro reflects their maturation to a more gliogenic state (24). It is therefore possible that gliogenic NPCs might be a neural precursor population fully permissive for HCMV infection. Indeed, expansion of Hues9-derived NPCs for 5 weeks resulted in a significant proportion of GFAP+ NPCs. These in vitro-expanded gliogenic NPCs were significantly more permissive for the transition to early gene expression at low MOIs, suggesting that astroglial precursor cells, but not primitive neurogenic NPCs, would be permissive to HCMV replication. Alternatively, other more differentiated cells, such as DCX-positive neuronal precursor cells present in fNPCs at variable levels, could also contribute to the increased permissivity for HCMV replication.
The nature of the restriction mechanisms in human ES cell-derived primitive neural stem and progenitor cells, as well as the cellular factors involved, are only correlative at this stage, but the observed MOI dependency of the restriction bears the hallmarks of intrinsic antiviral factors. The inefficient transition to early gene expression observed in pNSCs and NPCs at a low MOI is reminiscent of the phenotypes of mutant IE1 viruses (25). One of the main functions of IE1 is the disruption of PML bodies, leading to enhanced transcription of IE2 and efficient progression to early gene expression. IE1 is dispensable at a high MOI, but not at a low MOI, and exogenously disrupting PML bodies restores replication of the mutant virus (25–27). However, we did not observe any defects in the disruption of PML bodies in IE1+ pNSCs and NPCs (data not shown).
IE expression is the result of a complex interplay between specific cellular transcription factors and transcriptional repressors. The restrictive roles of hDaxx and ATRX in IE expression following HCMV infection have been recently characterized. ATRX and hDaxx have been shown to induce the deposition of transcriptionally repressive histones on the MIEP. It has been postulated that the high activity of ATRX and its cofactor hDaxx might be a determining factor in the establishment of latency at the expense of lytic replication (reviewed in reference 14). In permissive cells, the HCMV tegument protein UL82 (pp71) induces the relocalization of hDaxx and ATRX to stimulate expression of lytic genes such as IE1 and IE2 (14, 28–30). In some cell types, such as CD34+ hematopoietic stem cells or the NTera2 embryonic carcinoma cell line, a defect in the nuclear import of UL82 has been implicated in the maintenance of the transcriptionally repressive activity of the ATRX-hDaxx complex and the rapid establishment of latency (31, 32). Surprisingly, we observed a very efficient relocalization of hDaxx but not of ATRX in infected pNSCs. The proportion of cells displaying relocalized ATRX correlated with the proportion of IE-expressing pNSCs and NPCs. These results were unexpected given the observed sequential relocalization of ATRX first and hDaxx second in HFFs (28). Moreover, although we did observe a significant reduction in the nuclear import of pp71 in pNSCs compared to NPCs, the levels were a priori sufficient to induce hDaxx relocalization. These data suggest that the lower levels of nuclear pp71 observed in pNSCs might be responsible for the inefficient relocalization of ATRX. The ease at which the clinical isolate TB40E was able to relocalize hDaxx in pNSCs is in contrast to previous results obtained in CD34+ hematopoietic stem cells and in the NTera2 embryonic carcinoma cell line (31, 32). The basis for these discrepancies is not clear but might be related to the strain of virus or to the fundamental differences in the composition of PML bodies. Indeed, in contrast to many other cell types, hDaxx and ATRX foci are mostly excluded from PML bodies in ES cells, pNSCs, and NPCs during G1 and are instead located at heterochromatin loci (33, 34; data not shown). Nevertheless, given the fundamental role of hDaxx in the maintenance of pluripotency and multipotency in ES and neural stem cells, respectively (35, 36), our results suggest that HCMV might impact cell function even in the absence of productive infection of the targeted cells.
Our results highlight two distinct and possibly independent mechanisms regarding the restriction of IE expression in pNSCs. First, at a low MOI, IE expression is inefficient in pNSCs compared to NPCs. Second, the behavior of HCMV in pNSCs following a high-MOI infection was found to be dependent on the cellular genetic background. We found that pNSC lines could be subdivided into two groups with respect to IE expression following a high-MOI infection. The more permissive cell lines (derived from H9 and Hues6 ES cells) showed ∼3-fold more IE-positive cells than the pNSCs derived from the Hues9 and Hues16 ES cells. Importantly, viral entry and nuclear import of viral DNA were as efficient in all of the pNSCs as in NPCs, confirming that the restriction in IE protein expression was not at the DNA level.
Interestingly, we found that IE expression, even following infection at a high MOI, in restrictive pNSC lines was confined to a subpopulation of cells that did not express detectable levels of the FORSE-1 epitope, and FORSE-1 was not detectable in the permissive Hues6 and H9 pNSCs or in the NPCs. FORSE-1 is an antibody that recognizes a specific, as-yet-undefined configuration of the Lewis X glycan (15). In rat embryos, FORSE-1 stains the anterior portion of the neural tube and developing brain, and its epitope appears to be primarily present on two neutral glycolipids (37). It is thought that the FORSE-1 epitope might coordinate cell-cell interaction and that its intracellular signaling would help establish an anterior identity. It remains unclear in our system whether the FORSE-1 epitope directly induces cell signaling detrimental for IE expression or whether its presence merely correlates with a repressive transcriptional state. It is possible that this dichotomy in permissivity is inherent to the specific ES cell lineages and may reflect subtle differences in gene expression and signaling. It is tempting to speculate that similar differences in virus permissiveness between fetuses might in part account for the wide divergence in neurological defects following congenital HCMV infection. Nevertheless, pretreatment of Hues9 pNSCs with the caudalizing morphogen RA effectively downregulated the FORSE-1 epitope and restored IE expression. Although the effects of RA on IE expression are probably multifactorial and not solely related to the expression of FORSE-1, the high concentration of RA present in the posterior part of the developing brain suggests that very early in the development of the neural tube, a caudal microenvironment might be more beneficial for the virus. It is worth noting that motor neurons, sensory neurons, inner ear cells, retinal cells, and the lateral telencephalon (containing the lateral ventricles) all require a high concentration of RA for their proper development (38–40). These RA-rich microenvironments might enhance viral replication and therefore contribute to the specific motor and sensorineural defects observed during congenital CMV disease.
An intriguing possibility is that the restriction to lytic replication in pNSCs might lead to persistence of a low-level infection or establishment of latency. Based on their inability to support HCMV and MCMV replication, neurons have been previously proposed to be the sites of latency in the CNS, but there is no experimental evidence supporting that claim. Instead, the current data suggest that neural stem cells might constitute the site of latency in the CNS. Indeed, when brain slices from latently infected mice were cultured for extended periods of time, reactivated murine CMV IE expression was mainly detected in immature neural stem cells lining the ventricular cavities (41). Our observations that the HCMV genome persisted in individual pNSCs in vitro for an extended period of time support the idea that cells in the early stages of neural development might constitute a reservoir of virus in the CNS. Specifically, our results showed that a minimum of 50% of individual pNSCs at 24 h p.i. were able to maintain a few copies of the HCMV genome in a clonal population for up to 3 weeks. Importantly, the majority of these infected pNSC clones at 2 weeks p.i. had undetectable levels of IE1 RNA (at least 56-fold lower than those of lytically infected cells at 24 h p.i.), indicating that these were likely latent. Moreover, we noted that a few colonies did have a higher copy number of viral genomes, and one colony had levels of IE1 RNA that were comparable to that present in a single pNSC at 24 h p.i. Differentiation of infected pNSC clones into neurons allowed the “reactivation” of lytic replication and spread in 4 to 5% of clones assayed. Although the frequency of these “reactivation” events may appear low, it is greater than the frequency of reactivation (1 in 10,000 cells) observed in the in vitro myeloid latency models (19). At this time, we do not know whether these events represent reactivation of latent virus upon neuronal differentiation, spread from rare cells that had maintained IE expression, or spread from rare cells that had reactivated IE expression at the pNSC stage. Nevertheless, these results show that pNSCs could provide a reservoir, whether it be a latent or low-level persistent infection, for the virus.
In conclusion, the creation of several lines of highly homogeneous primitive pre-rosette neural stem cells and neural progenitor cells from human ES cells was instrumental in modeling HCMV replication in the early stages of neural cell differentiation. Our results revealed that these cells, which are similar to those present in the developing neural tube, are restricted for viral replication and likely constitute a viral reservoir. Further work will help define the cellular factors involved in limiting viral replication in these cells, the effects of the virus on cell function and differentiation, and the physiological cues necessary for the reactivation of HCMV in the CNS.
ACKNOWLEDGMENTS
This study was supported by a grant from the California Institute for Regenerative Medicine to D.H.S. and G.W.Y.
We thank Kang Zhang and Sharon Lim for the kind gift of the Hues9-derived pNSCs and their invaluable technical help with neural stem cell culture.
Footnotes
Published ahead of print 22 January 2014
REFERENCES
- 1.Cheeran MC, Lokensgard JR, Schleiss MR. 2009. Neuropathogenesis of congenital cytomegalovirus infection: disease mechanisms and prospects for intervention. Clin. Microbiol. Rev. 22:99–126. 10.1128/CMR.00023-08 [DOI] [PMC free article] [PubMed] [Google Scholar]
- 2.Malm G, Engman ML. 2007. Congenital cytomegalovirus infections. Semin. Fetal Neonatal Med. 12:154–159. 10.1016/j.siny.2007.01.012 [DOI] [PubMed] [Google Scholar]
- 3.Tsutsui Y. 2009. Effects of cytomegalovirus infection on embryogenesis and brain development. Congenit. Anom. (Kyoto) 49:47–55. 10.1111/j.1741-4520.2009.00222.x [DOI] [PubMed] [Google Scholar]
- 4.Cheeran MC, Hu S, Ni HT, Sheng W, Palmquist JM, Peterson PK, Lokensgard JR. 2005. Neural precursor cell susceptibility to human cytomegalovirus diverges along glial or neuronal differentiation pathways. J. Neurosci. Res. 82:839–850. 10.1002/jnr.20682 [DOI] [PubMed] [Google Scholar]
- 5.Luo MH, Schwartz PH, Fortunato EA. 2008. Neonatal neural progenitor cells and their neuronal and glial cell derivatives are fully permissive for human cytomegalovirus infection. J. Virol. 82:9994–10007. 10.1128/JVI.00943-08 [DOI] [PMC free article] [PubMed] [Google Scholar]
- 6.McCarthy M, Auger D, Whittemore SR. 2000. Human cytomegalovirus causes productive infection and neuronal injury in differentiating fetal human central nervous system neuroepithelial precursor cells. J. Hum. Virol. 3:215–228 [PubMed] [Google Scholar]
- 7.Odeberg J, Wolmer N, Falci S, Westgren M, Seiger A, Soderberg-Naucler C. 2006. Human cytomegalovirus inhibits neuronal differentiation and induces apoptosis in human neural precursor cells. J. Virol. 80:8929–8939. 10.1128/JVI.00676-06 [DOI] [PMC free article] [PubMed] [Google Scholar]
- 8.Odeberg J, Wolmer N, Falci S, Westgren M, Sundtrom E, Seiger A, Soderberg-Naucler C. 2007. Late human cytomegalovirus (HCMV) proteins inhibit differentiation of human neural precursor cells into astrocytes. J. Neurosci. Res. 85:583–593. 10.1002/jnr.21144 [DOI] [PubMed] [Google Scholar]
- 9.Pan X, Li XJ, Liu XJ, Yuan H, Li JF, Duan YL, Ye HQ, Fu YR, Qiao GH, Wu CC, Yang B, Tian XH, Hu KH, Miao LF, Chen XL, Zheng J, Rayner S, Schwartz PH, Britt WJ, Xu J, Luo MH. 2013. Later passages of neural progenitor cells from neonatal brain are more permissive for human cytomegalovirus infection. J. Virol. 87:10968–10979. 10.1128/JVI.01120-13 [DOI] [PMC free article] [PubMed] [Google Scholar]
- 10.D'Aiuto L, Di Maio R, Heath B, Raimondi G, Milosevic J, Watson AM, Bamne M, Parks WT, Yang L, Lin B, Miki T, Mich-Basso JD, Arav-Boger R, Sibille E, Sabunciyan S, Yolken R, Nimgaonkar V. 2012. Human induced pluripotent stem cell-derived models to investigate human cytomegalovirus infection in neural cells. PLoS One 7:e49700. 10.1371/journal.pone.0049700 [DOI] [PMC free article] [PubMed] [Google Scholar]
- 11.Durose JB, Li J, Chien S, Spector DH. 2012. Infection of vascular endothelial cells with human cytomegalovirus under fluid shear stress reveals preferential entry and spread of virus in flow conditions simulating atheroprone regions of the artery. J. Virol. 86:13745–13755. 10.1128/JVI.02244-12 [DOI] [PMC free article] [PubMed] [Google Scholar]
- 12.Li W, Sun W, Zhang Y, Wei W, Ambasudhan R, Xia P, Talantova M, Lin T, Kim J, Wang X, Kim WR, Lipton SA, Zhang K, Ding S. 2011. Rapid induction and long-term self-renewal of primitive neural precursors from human embryonic stem cells by small molecule inhibitors. Proc. Natl. Acad. Sci. U. S. A. 108:8299–8304. 10.1073/pnas.1014041108 [DOI] [PMC free article] [PubMed] [Google Scholar]
- 13.Sourvinos G, Tavalai N, Berndt A, Spandidos DA, Stamminger T. 2007. Recruitment of human cytomegalovirus immediate-early 2 protein onto parental viral genomes in association with ND10 in live-infected cells. J. Virol. 81:10123–10136. 10.1128/JVI.01009-07 [DOI] [PMC free article] [PubMed] [Google Scholar]
- 14.Reeves M, Sinclair J. 2013. Regulation of human cytomegalovirus transcription in latency: beyond the major immediate-early promoter. Viruses 5:1395–1413. 10.3390/v5061395 [DOI] [PMC free article] [PubMed] [Google Scholar]
- 15.Tole S, Kaprielian Z, Ou SK, Patterson PH. 1995. FORSE-1: a positionally regulated epitope in the developing rat central nervous system. J. Neurosci. 15:957–969 [DOI] [PMC free article] [PubMed] [Google Scholar]
- 16.Angulo A, Ghazal P. 1995. Regulation of human cytomegalovirus by retinoic acid. Scand. J. Infect. Dis. Suppl. 99:113–115 [PubMed] [Google Scholar]
- 17.Angulo A, Suto C, Boehm MF, Heyman RA, Ghazal P. 1995. Retinoid activation of retinoic acid receptors but not of retinoid X receptors promotes cellular differentiation and replication of human cytomegalovirus in embryonal cells. J. Virol. 69:3831–3837 [DOI] [PMC free article] [PubMed] [Google Scholar]
- 18.Angulo A, Suto C, Heyman RA, Ghazal P. 1996. Characterization of the sequences of the human cytomegalovirus enhancer that mediate differential regulation by natural and synthetic retinoids. Mol. Endocrinol. 10:781–793. 10.1210/me.10.7.781 [DOI] [PubMed] [Google Scholar]
- 19.Umashankar M, Petrucelli A, Cicchini L, Caposio P, Kreklywich CN, Rak M, Bughio F, Goldman DC, Hamlin KL, Nelson JA, Fleming WH, Streblow DN, Goodrum F. 2011. A novel human cytomegalovirus locus modulates cell type-specific outcomes of infection. PLoS Pathog. 7:e1002444. 10.1371/journal.ppat.1002444 [DOI] [PMC free article] [PubMed] [Google Scholar]
- 20.Schleiss MR. 2006. Nonprimate models of congenital cytomegalovirus (CMV) infection: gaining insight into pathogenesis and prevention of disease in newborns. ILAR J. 47:65–72. 10.1093/ilar.47.1.65 [DOI] [PubMed] [Google Scholar]
- 21.Schleiss MR, McVoy MA. 2010. Guinea pig cytomegalovirus (GPCMV): a model for the study of the prevention and treatment of maternal-fetal transmission. Future Virol. 5:207–217. 10.2217/fvl.10.8 [DOI] [PMC free article] [PubMed] [Google Scholar]
- 22.Luo MH, Hannemann H, Kulkarni AS, Schwartz PH, O'Dowd JM, Fortunato EA. 2010. Human cytomegalovirus infection causes premature and abnormal differentiation of human neural progenitor cells. J. Virol. 84:3528–3541. 10.1128/JVI.02161-09 [DOI] [PMC free article] [PubMed] [Google Scholar]
- 23.Lokensgard JR, Cheeran MC, Gekker G, Hu S, Chao CC, Peterson PK. 1999. Human cytomegalovirus replication and modulation of apoptosis in astrocytes. J. Hum. Virol. 2:91–101 [PubMed] [Google Scholar]
- 24.Krencik R, Weick JP, Liu Y, Zhang ZJ, Zhang SC. 2011. Specification of transplantable astroglial subtypes from human pluripotent stem cells. Nat. Biotechnol. 29:528–534. 10.1038/nbt.1877 [DOI] [PMC free article] [PubMed] [Google Scholar]
- 25.Greaves RF, Mocarski ES. 1998. Defective growth correlates with reduced accumulation of a viral DNA replication protein after low-multiplicity infection by a human cytomegalovirus ie1 mutant. J. Virol. 72:366–379 [DOI] [PMC free article] [PubMed] [Google Scholar]
- 26.Ahn JH, Hayward GS. 2000. Disruption of PML-associated nuclear bodies by IE1 correlates with efficient early stages of viral gene expression and DNA replication in human cytomegalovirus infection. Virology 274:39–55. 10.1006/viro.2000.0448 [DOI] [PubMed] [Google Scholar]
- 27.Tavalai N, Papior P, Rechter S, Leis M, Stamminger T. 2006. Evidence for a role of the cellular ND10 protein PML in mediating intrinsic immunity against human cytomegalovirus infections. J. Virol. 80:8006–8018. 10.1128/JVI.00743-06 [DOI] [PMC free article] [PubMed] [Google Scholar]
- 28.Lukashchuk V, McFarlane S, Everett RD, Preston CM. 2008. Human cytomegalovirus protein pp71 displaces the chromatin-associated factor ATRX from nuclear domain 10 at early stages of infection. J. Virol. 82:12543–12554. 10.1128/JVI.01215-08 [DOI] [PMC free article] [PubMed] [Google Scholar]
- 29.Saffert RT, Kalejta RF. 2006. Inactivating a cellular intrinsic immune defense mediated by Daxx is the mechanism through which the human cytomegalovirus pp71 protein stimulates viral immediate-early gene expression. J. Virol. 80:3863–3871. 10.1128/JVI.80.8.3863-3871.2006 [DOI] [PMC free article] [PubMed] [Google Scholar]
- 30.Reeves M, Woodhall D, Compton T, Sinclair J. 2010. Human cytomegalovirus IE72 protein interacts with the transcriptional repressor hDaxx to regulate LUNA gene expression during lytic infection. J. Virol. 84:7185–7194. 10.1128/JVI.02231-09 [DOI] [PMC free article] [PubMed] [Google Scholar]
- 31.Saffert RT, Penkert RR, Kalejta RF. 2010. Cellular and viral control over the initial events of human cytomegalovirus experimental latency in CD34+ cells. J. Virol. 84:5594–5604. 10.1128/JVI.00348-10 [DOI] [PMC free article] [PubMed] [Google Scholar]
- 32.Saffert RT, Kalejta RF. 2007. Human cytomegalovirus gene expression is silenced by Daxx-mediated intrinsic immune defense in model latent infections established in vitro. J. Virol. 81:9109–9120. 10.1128/JVI.00827-07 [DOI] [PMC free article] [PubMed] [Google Scholar]
- 33.Butler JT, Hall LL, Smith KP, Lawrence JB. 2009. Changing nuclear landscape and unique PML structures during early epigenetic transitions of human embryonic stem cells. J. Cell Biochem. 107:609–621. 10.1002/jcb.22183 [DOI] [PMC free article] [PubMed] [Google Scholar]
- 34.Chang FT, McGhie JD, Chan FL, Tang MC, Anderson MA, Mann JR, Choo AKH, Wong LH. 2013. PML bodies provide an important platform for the maintenance of telomeric chromatin integrity in embryonic stem cells. Nucleic Acids Res. 41:4447–4458. 10.1093/NAR/gkt114 [DOI] [PMC free article] [PubMed] [Google Scholar]
- 35.Lewis PW, Elsaesser SJ, Noh KM, Stadler SC, Allis CD. 2010. Daxx is an H3.3-specific histone chaperone and cooperates with ATRX in replication-independent chromatin assembly at telomeres. Proc. Natl. Acad. Sci. U. S. A. 107:14075–14080. 10.1073/pnas.1008850107 [DOI] [PMC free article] [PubMed] [Google Scholar]
- 36.Goldberg AD, Banaszynski LA, Noh KM, Lewis PW, Elsaesser SJ, Stadler S, Dewell S, Law M, Guo X, Li X, Wen D, Chapgier A, DeKelver RC, Miller JC, Lee YL, Boydston EA, Holmes MC, Gregory PD, Greally JM, Rafii S, Yang C, Scambler PJ, Garrick D, Gibbons RJ, Higgs DR, Cristea IM, Urnov FD, Zheng D, Allis CD. 2010. Distinct factors control histone variant H3.3 localization at specific genomic regions. Cell 140:678–691. 10.1016/j.cell.2010.01.003 [DOI] [PMC free article] [PubMed] [Google Scholar]
- 37.Allendoerfer KL, Durairaj A, Matthews GA, Patterson PH. 1999. Morphological domains of Lewis-X/FORSE-1 immunolabeling in the embryonic neural tube are due to developmental regulation of cell surface carbohydrate expression. Dev. Biol. 211:208–219. 10.1006/dbio.1999.9308 [DOI] [PubMed] [Google Scholar]
- 38.Rhinn M, Dolle P. 2012. Retinoic acid signaling during development. Development 139:843–858. 10.1242/dev.065938 [DOI] [PubMed] [Google Scholar]
- 39.Cvekl A, Wang WL. 2009. Retinoic acid signaling in mammalian eye development. Exp. Eye Res. 89:280–291. 10.1016/j.exer.2009.04.012 [DOI] [PMC free article] [PubMed] [Google Scholar]
- 40.Frenz DA, Liu W, Cvekl A, Xie Q, Wassef L, Quadro L, Niederreither K, Maconochie M, Shanske A. 2010. Retinoid signaling in inner ear development: a “Goldilocks” phenomenon. Am. J. Med. Genet. A 152A:2947–2961. 10.1002/ajmg.a.33670 [DOI] [PMC free article] [PubMed] [Google Scholar]
- 41.Tsutsui Y, Kawasaki H, Kosugi I. 2002. Reactivation of latent cytomegalovirus infection in mouse brain cells detected after transfer to brain slice cultures. J. Virol. 76:7247–7254. 10.1128/JVI.76.14.7247-7254.2002 [DOI] [PMC free article] [PubMed] [Google Scholar]