

ABSTRACT
Lytic infection by herpesviruses induces cell cycle arrest at the G1/S transition. This appears to be a function of multiple herpesvirus proteins, but only a minority of herpesvirus proteins have been examined for cell cycle effects. To gain a more comprehensive understanding of the viral proteins that contribute to G1/S arrest, we screened a library of over 200 proteins from herpes simplex virus type 1, human cytomegalovirus, and Epstein-Barr virus (EBV) for effects on the G1/S interface, using HeLa fluorescent, ubiquitination-based cell cycle indicator (Fucci) cells in which G1/S can be detected colorimetrically. Proteins from each virus were identified that induce accumulation of G1/S cells, predominantly tegument, early, and capsid proteins. The identification of several capsid proteins in this screen suggests that incoming viral capsids may function to modulate cellular processes. The cell cycle effects of selected EBV proteins were further verified and examined for effects on p53 and p21 as regulators of the G1/S transition. Two EBV replication proteins (BORF2 and BMRF1) were found to induce p53 but not p21, while a previously uncharacterized tegument protein (BGLF2) was found to induce p21 protein levels in a p53-independent manner. Proteomic analyses of BGLF2-interacting proteins identified interactions with the NIMA-related protein kinase (NEK9) and GEM-interacting protein (GMIP). Silencing of either NEK9 or GMIP induced p21 without affecting p53 and abrogated the ability of BGLF2 to further induce p21. Collectively, these results suggest multiple viral proteins contribute to G1/S arrest, including BGLF2, which induces p21 levels likely by interfering with the functions of NEK9 and GMIP.
IMPORTANCE Most people are infected with multiple herpesviruses, whose proteins alter the infected cells in several ways. During lytic infection, the viral proteins block cell proliferation just before the cellular DNA replicates. We used a novel screening method to identify proteins from three different herpesviruses that contribute to this block. Several of the proteins we identified had previously unknown functions or were structural components of the virion. Subsets of these proteins from Epstein-Barr virus were studied for their effects on the cell cycle regulatory proteins p53 and p21, thereby identifying two proteins that induce p53 and one that induces p21 (BGLF2). We identified interactions of BGLF2 with two human proteins, both of which regulate p21, suggesting that BGLF2 induces p21 by interfering with the functions of these two host proteins. Our study indicates that multiple herpesvirus proteins contribute to the cell proliferation block, including components of the incoming virions.
INTRODUCTION
Herpesviruses are extremely successful DNA viruses that alternate between latent and lytic modes of infection to establish lifelong persistence in the host. Herpesviruses are divided into alpha, beta, and gamma classes typified by the human herpesviruses herpes simplex type 1 (HSV-1), cytomegalovirus (CMV), and Epstein-Barr virus (EBV), respectively. Lytic infection by HSV-1, CMV, and EBV involves expression of approximately 80 (HSV-1 and EBV) to 200 (CMV) proteins that function to manipulate cellular processes, including cell cycle progression, DNA damage responses, apoptosis, and immune responses. For all three viruses, lytic infection has been shown to result in cell cycle arrest (1), and most studies indicate that cells arrest in late G1 phase or at the G1/S interface such that host DNA replication is blocked (2–8). The observation that this arrest occurs prior to host DNA synthesis is thought to provide a favorable environment for viral DNA replication and may also enable immediate early viral gene expression (9–12). Therefore, understanding how herpesviruses induce G1/S arrest is important for understanding lytic infections of this class of virus.
To date, several immediate early (IE) and tegument proteins have been found to contribute to cell cycle arrest (1). This is not surprising, since their early expression or delivery into the cell makes them well positioned to alter the cellular environment to facilitate lytic infection. For example, the HSV-1 IE protein ICP0 has been shown to block cells from entering S phase (13, 14). In agreement with this observation, ICP0 induced the expression of the CDK inhibitor, p21, in both p53-dependent and p53-independent manners (14). However, studies with an ICP0-null virus showed that this virus can still induce G1/S arrest, indicating that other HSV-1 proteins must also contribute to this phenomenon (13). In keeping with this conclusion, ICP27 of HSV-1 was shown to be required for G1 arrest and to reduce cyclin D1 and Cdk4 levels in conjunction with ICP4 and Vhs (15). Interestingly, the CMV homologue of ICP27, UL69, also arrests cells in G1, although the mechanism remains uncharacterized (4, 16, 17). In addition, the CMV IE2 protein induces a G1 arrest by interacting with and stabilizing p53 (18–20). For EBV, the first two proteins expressed in lytic infection, BZLF1 (also called Zta) and BRLF1 (also called Rta), have been shown to induce G1 or G1/S arrest. BZLF1 does so by increasing p53, p21, and p27 levels (9, 21), while BRLF1 induces p21 and 14-3-3 alpha in the absence of p53 induction (22).
Although herpesviruses express 80 to 200 proteins during lytic infection, the functions of many of these proteins are not yet known. As a first step toward a more comprehensive understanding of the functions of herpesvirus proteins, we previously generated an expression library of 234 proteins from HSV-1, CMV, and EBV fused to a C-terminal sequential purification affinity (SPA) tag, which includes a FLAG tag (23, 24). The subcellular localization of each protein was determined by immunofluorescence microscopy for the FLAG tag, and the nuclear proteins were screened for effects on promyelocytic leukemia (PML) nuclear bodies, which are known to suppress lytic viral infection (23). This identified several proteins that altered or induced the loss of PML bodies and provided initial functional information for approximately 120 previously unstudied proteins (23, 25). This expression library provides a tool to explore the role of specific proteins in many viral processes, including G1/S arrest.
Traditionally, monitoring changes at the G1/S transition has been difficult since it represents a small proportion of the cell cycle and this interface cannot be distinguished by cellular morphology or by DNA content. Significant headway on this problem was made by Sakaue-Sawano et al. (26) through the generation of fluorescent, ubiquitination-based cell cycle indicator (Fucci) cells. Fucci cells are HeLa cells that express two fluorescently labeled probes; a truncated version of Cdt1 tagged with monomeric Kusabira orange (mKO2) and a truncated version of geminin tagged with monomeric Azami green (mAG) (26). Cdt1 and geminin expression oscillate during the cell cycle, with Cdt1 being expressed during G1 and geminin expressed during S/G2/M (27, 28). As a result, Fucci cells appear red during the G1 phase, green during the S/G2/M phases, and yellow at the G1/S interface when both Cdt1 and geminin are present. Therefore, these cells offer a simple, colorimetric-based method for detecting changes in the G1/S transition.
In our current study, we used the Fucci cells to screen our library of herpesvirus proteins for those that contribute to the G1/S cell cycle arrest typical of herpesvirus lytic infection. In this way, we identified several proteins from EBV, HSV-1, and CMV that increase the proportion of cells at G1/S. As expected, these included tegument and early proteins, but, unexpectedly, several capsid proteins were also found to induce G1/S accumulation, suggesting that incoming capsids might contribute to G1/S arrest. An uncharacterized EBV tegument protein, BGLF2, was among those with the most pronounced effects on the G1/S transition. We show that BGLF2 protein induces p21 accumulation independently of p53 and present evidence that this involves an interaction with the cellular proteins, NIMA-related protein kinase (NEK9) and GEM-interacting protein (GMIP).
MATERIALS AND METHODS
Cell lines.
Fucci cells are HeLa cells stably transformed with fluorescently tagged Cdt1 (mKO2-hCDT1) and geminin (mAG-hGem) as previously described (26). Fucci cells were cultured in Dulbecco's modified Eagle's medium (DMEM) supplemented with 10% fetal bovine serum (FBS). CNE2Z is a human EBV-negative nasopharyngeal carcinoma cell line (29) and was maintained in alpha-minimal essential medium with 10% FBS. H1299 is a p53-null, human non-small cell lung carcinoma cell line (30) that was cultured in RPMI 1640 medium containing 10% FBS. Media for all cells were also supplemented with penicillin-streptomycin (100 IU/ml).
Expression constructs and transfection.
Mammalian expression constructs for EBV (strain B95-8), HSV-1 (strain 17), and CMV (strain Ad169) were prepared by PCR amplification of predicted open reading frames (ORF) and subsequent insertion into the multiple cloning site of the PMZS3F vector as previously described (23). PMZS3F is a SPA-tagging vector comprised of a calmodulin-binding peptide, tobacco etch virus protease cleavage site, and triple-FLAG epitope expressed at the C-terminal end of the protein (24). PMZS3F-LacZ, expressing SPA-tagged β-galactosidase, is described in reference 31. Cells were transfected using either Lipofectamine 2000 (Invitrogen) or PolyJet transfection reagent (SignaGen Laboratories) at a ratio of 1 μg DNA to 2 μl transfection reagent, as outlined by the manufacturers. Cells were collected 24 h after transfection and processed as described below.
Antibodies.
Rabbit primary antibodies against p21 and phosphorylated p53 (on S15) were purchased from Cell Signaling. Mouse antibodies against p53 and rabbit antibody against E2F-associated phosphoprotein (EAPP) were from Santa-Cruz Biotechnology. Other primary antibodies used were mouse anti-FLAG (M2; Sigma-Aldrich), rabbit anti-FLAG (Bethyl Laboratories), and rabbit anti-GMIP (ab133975; Abcam). Rabbit peptide antibody against NEK9 was kindly provided by P. Whyte (McMaster University) and was previously described (32). Goat anti-mouse, goat anti-rabbit, and donkey anti-goat horseradish peroxidase-conjugated secondary antibodies were purchased from Santa Cruz Biotechnologies. Fluorescein isothiocyanate (FITC)-conjugated mouse anti-BrdU and Alexa Fluor-conjugated secondary antibodies were from BD Pharmingen and Invitrogen, respectively.
Immunofluorescence microscopy.
Cells seeded at 50% confluence on coverslips in 6-well tissue culture dishes were transfected with 2 μg of pMZS3F, pMZS3F-BORF2, or pMZS3F-BGLF2. Twenty-four hours later, cells were fixed in 3.7% formaldehyde (15 min), permeabilized in 1% Triton X-100 (15 min), and then blocked for 30 min in phosphate-buffered saline (PBS) containing 4% bovine serum albumin (BSA). Cells were incubated with primary antibody (in 5% BSA in PBS) against FLAG (M2; Sigma-Aldrich), NEK9, or GMIP and a corresponding Alexa Fluor-conjugated secondary antibody for 1 h (Alexa Fluor 488 for FLAG and Alexa Fluor 555 for NEK9 or GMIP). Coverslips were mounted onto slides with ProLong Gold antifade mounting medium (Invitrogen), and images were acquired using a Leica DM IRE2 inverted fluorescence microscope. Images were processed with OpenLab software (version 4.0.2). For Fucci analysis, mKO2-Cdt1 and mAG-geminin fluorescent expression was detected using Tx2 (560/40-nm band-pass [BP]) and yellow fluorescent protein (YFP; 500/20-nm BP) filter cubes, respectively. Cells expressing FLAG were detected by primary antibody incubation with mouse anti-FLAG (M2; Sigma-Aldrich) and goat anti-mouse Alexa Fluor 350 secondary antibody (360/40-nm BP filter).
Cell cycle analysis in Fucci cells.
Fucci cells were seeded in 10-cm tissue culture plates and transfected with 8 μg of expression plasmid using Lipofectamine 2000 (Invitrogen) as outlined by the manufacturer. Harvested cells were then fixed and permeabilized in 70% ethanol in PBS and stored at −20°C. Samples were blocked with 5% BSA in PBS for 30 min prior to incubation with rabbit anti-FLAG antibody (in 5% BSA in PBS with 0.5% Tween) and subsequently with goat anti-rabbit Alexa Fluor 647 secondary antibody, each for 1 h. Cells were analyzed using a FACSCalibur flow cytometer (Becton, Dickinson). Cdt1 (mKO2-hCDT1) and geminin (mAG-hGem) were excited using a 488-nm laser, and fluorescent signals were collected at 585 nm (585/42-nm BP filter, FL2) and 530 nm (530/30-nm BP filter, FL1). FLAG expression was detected using a 661/16-nm BP filter cube (FL4). Samples were initially sorted on the expression of the FLAG epitope, and then Cdt1 (G1), geminin (S/G2/M), or both (G1/S) were gated as described in Sakaue-Sawano et al. (26) in FLAG-positive and FLAG-negative populations. The data were analyzed using FlowJo software (Tree Star).
Cell cycle analysis by DNA content.
CNE2Z cells were transfected and harvested and then fixed and permeabilized in 70% ethanol as noted above. Cells were blocked with 5% BSA in PBS for 30 min prior to incubation with anti-FLAG antibody as described above. Samples were subsequently incubated in propidium iodide (PI; 50 μg/ml) with RNase A (100 μg/ml) prepared in PBS for 30 min at room temperature. Samples were analyzed using a FACSCanto II flow cytometer (Becton, Dickinson), with FLAG expression and PI stain collected using 660/20-nm and 695/40-nm BP filters, respectively. Samples were initially sorted on the expression of the FLAG epitope and then gated based on PI stain. The data were analyzed using FlowJo software (Tree Star), with the Dean-Jett-Fox model being used to generate and analyze the DNA content profiles.
BrdU incorporation.
CNE2Z cells were transfected as described above, and BrdU (10 μg/ml) was added to culture medium 24 h later for 45 min prior to harvesting. Cells were fixed, permeabilized, and blocked as described above and then incubated with 2 N HCl (20 min) followed by 0.1 M sodium borate (pH 8.5; 2 min) to denature the DNA. Samples were then incubated with mouse anti-BrdU-FITC and rabbit anti-FLAG primary antibodies for 1 h followed by incubation with goat-anti rabbit Alexa Fluor 647 secondary antibody for 45 min. Samples were incubated with PI and RNase A as noted above and then examined using a FACSCalibur flow cytometer (Becton, Dickinson), with FLAG expression, PI stain, and BrdU collected using 660/20-nm, 695/40-nm, and 525/50-nm BP filters, respectively. Samples were initially sorted based on the expression of the FLAG epitope and then gated based on PI stain or BrdU stain in FLAG-positive and FLAG-negative populations. The data were analyzed using FlowJo software (Tree Star). For DNA content profiles, the Dean-Jett-Fox model was used.
Western blotting.
Transfected cells were lysed in 9 M urea and 5 mM Tris (pH 6.5) as previously described (33). Equal amounts of total protein (40 μg) were separated on 10% SDS-PAGE gels and transferred to a polyvinylidene difluoride (PVDF) membrane (Millipore). Membranes were blocked for 1 h in 5% milk prepared in Tris-buffered saline with 0.5% Tween (TBS-T) and then incubated with primary antibody overnight at 4°C followed by secondary antibody for 1 h at room temperature. Protein bands were visualized using Western lighting chemiluminescent reagent (PerkinElmer) and exposed to photographic film (Amersham).
Immunoprecipitation.
Cells in three 10-cm tissue culture dishes were transfected and then harvested 24 h later and pooled. Samples were lysed, and IPs were performed as described by Salsman et al. (31) using 20 μl (bed volume) of mouse anti-FLAG resin (Sigma-Aldrich) with 1 mg of cell lysate diluted to 6 mg/ml with lysis buffer (150 mM Tris [pH 8.0], 150 mM NaCl, 0.1% Triton X-100, 5% glycerol, 2 mM EDTA, protease inhibitor cocktail [p8340; Sigma-Aldrich]). Western blot analyses were then performed as described above.
Quantitative PCR.
RNA was collected from transfected cells using the TRIzol reagent, according to the manufacturer's protocol (Invitrogen Life Technologies), and quantified by absorbance at 260 nm (A260) in a NanoDrop spectrophotometer (ND-1000; Thermo Scientific). Reverse transcription (RT)-PCR was conducted using 2 μg of RNA, 200 ng of random primers, and 200 U of Superscript III reverse transcriptase (Invitrogen) in a total volume of 20 μl in a PTC-100 thermocycler (MJ Research Inc.). For quantitative PCR (qPCR) analysis, cDNA was diluted 1:10 and then combined with LightCycler 480 DNA SYBR green I master mix (Roche; catalog no. 04707516001) and specific primer sets (0.5 μM) prior to processing in a Rotor-Gene qPCR machine (Corbett Research). The primers used to measure p21 and GAPDH transcripts were previously reported (34). Data were analyzed using the cycle threshold (ΔΔCT method), with transcript levels being normalized to GAPDH. p21 transcript levels determined after transfection with pMZS3F-BGLF2 were expressed as fold change over those determined after transfection with the pMZS3F empty vector. When etoposide treatment was used, it was added into the medium at a concentration of 5 mM for 24 h.
Mass spectrometry.
Five 15-cm dishes of CNE2Z cells were transfected with pMZS3F, pMZS3F-LacZ, or pMZS3F-BGLF2 (20 μg per plate) and, 24 h later, were harvested and pooled. Cells were lysed and immunoprecipitations were performed with anti-FLAG resin as in reference 31. Following IP, anti-FLAG resin was rinsed in 10 volumes of 50 mM ammonium bicarbonate (pH 8.0) containing 75 mM KCl. Protein was eluted from the resin with three washes of 0.5 M ammonium hydroxide (15 min each at 4°C with rotation). Samples were lyophilized in a SpeedVac (Savant DNA120; Thermo Electron Corp.) and washed with 400 μl of high-performance liquid chromatography (HPLC)-grade water (Gibco). Samples were lyophilized once more to remove traces of ammonium hydroxide and then subjected to trichloroacetic acid (TCA) precipitation, tryptic digestion, and tandem mass spectrometry (MS/MS) as previously described (35), except that desalting was performed using ZIP-TIPs according to the manufacturer's instructions (Millipore; catalog no. ZTC18M960). For protein and peptide identification, RAW files were submitted for database searching using X! TANDEM (version 2007.07.01.3) and TPP (version 4.3) under standard workflow and a modified UniProt/Swiss-Prot protein database FASTA file. The modification consisted of adding BSA (Swiss-Prot accession number P02769). Search parameters were set to allow for two missed cleavage sites, variable modification by methionine oxidation, and one fixed modification by cysteine carbamidomethylation. A 10-ppm filter was used for peptide identification. The search results were uploaded to ProHits (36) and compared using at least 99% TPP probability.
Silencing experiment.
Cells were seeded into 6-cm tissue culture dishes at 50% confluence and immediately transfected with 100 pmol of small interfering RNA (siRNA) against NEK9, GMIP, AllStars negative-control siRNA (Qiagen) using Lipofectamine 2000. Forty-eight hours later, cells were subjected to a second round of siRNA treatment. Twenty-four hours after this, cells were either harvested directly or transfected with pMZS3F or pMZS3F-BGLF2 using Lipofectamine 2000 and then harvested 24 h later. The NEK9-targeted siRNA was that reported by Pelka et al. (32) with the sequence GACCAUCCGUUCCAAUAGCTT. The GMIP-targeted siRNA was designed using the BLOCK-iT RNA interference (RNAi) designer (Invitrogen), and the sequence was GGAAGAGGUACAGUGACAUTT. siRNAs were synthesized by Invitrogen.
RESULTS
Identification of herpesvirus proteins that induce G1/S accumulation.
To gain a more comprehensive understanding of which herpesvirus proteins contribute to G1/S arrest of the cell cycle, we screened a plasmid library consisting of 234 FLAG-tagged open reading frames (ORFs) from HSV-1, EBV, and CMV for effects on Fucci cells (26). For a list of all the proteins in our screen, see Table S1 in Salsman et al. (23). Fucci cells express red (mKO2)-tagged Cdt1 in G1 and green (monomeric Azami green [mAG])-tagged geminin in S/G2/M. Expression of the two tagged proteins overlaps at G1/S, allowing detection of cells in this cell cycle phase by their yellow fluorescence. Fucci cells were transfected with individual plasmids from the library and imaged by fluorescence microscopy, using anti-FLAG antibody to detect cells expressing the viral protein. Cells in G1 and S/G2/M cell cycle phases were distinguished by the expression of red and green fluorophores, respectively. To identify cells in the G1/S phase, red and green layers for each image were overlaid, giving rise to cells expressing orange to yellow fluorescence (see the example in Fig. 1A). Effects of each expression plasmid on the cell cycle phases were quantified using flow cytometry. To this end, cells were stained with anti-FLAG antibody and sorted into FLAG-positive and FLAG-negative populations, which were then analyzed for red (G1), green (S/G2/M), and yellow/orange (G1/S) fluorescence as shown in Fig. 1B. The difference in the proportion of cells in each phase of the cell cycle was compared between FLAG-positive and FLAG-negative cells (see example in Fig. 1C), and the fold-change in each cell cycle phase was calculated. Control experiments in which Fucci cells were transfected with the empty plasmid were also conducted, and the percentage of G1/S cells in these cells was found to be very similar to that in untransfected cells (see Fig. 2C).
FIG 1.

Screening cell cycle progression using Fucci cells. (A) Fucci cells were transfected with pMZS3F-BORF1 or left untreated and then stained for the FLAG tag on BORF1 and imaged for mKO2 (G1 cells; red), mAG (S/G2/M cells; green), and FLAG (blue). An overlay of red and green image layers revealed cells in G1/S, which display a yellow to orange color (bottom). (B) Fucci cells transfected with pMZS3F-BORF1 and stained for the FLAG tag on BORF1 were FACS sorted into FLAG-positive and FLAG-negative cells (left) and then further separated based on the expression of mKO2-Cdt1 and AG-geminin (middle and right). (C) Cell cycle stages determined from FACS analysis (as for panel B) were quantified for FLAG-positive (BORF1) and FLAG-negative cells from three independent experiments.
FIG 2.

Cell cycle effects of EBV proteins in CNE2Z cells. CNE2Z cells were transfected with plasmids expressing FLAG-tagged BORF1 (A) or BGLF2 (B) and, 24 h later, were either pulse labeled with BrdU (top) or harvested directly and stained with propidium iodide (PI). Cells were sorted into FLAG-positive and FLAG-negative cells by FACS and then analyzed for BrdU (S phase) and PI (DNA content) in the top panels or PI alone (bottom). (C) A comparison of the cell cycle alterations caused by seven EBV proteins as determined in Fucci cells and in CNE2Z cells using the methods described for panels A and B. Fold-change relative to FLAG-negative cells is shown. Effects of the empty FLAG vector are shown in the top row.
The flow cytometry assay was used to analyze the cell cycle effects of 207 herpesvirus proteins in triplicate (the expression of the remaining 27 proteins being insufficient to generate reliable data), and the numbers of proteins from each virus that increased G1/S phase cells 1.8-fold or more are shown in Table 1. The 1.8-fold cutoff was chosen to limit further analyses to ∼20% of the screened proteins with the strongest effects. EBV had the highest proportion of proteins that induced G1/S accumulation, while CMV had the lowest. Many of the functionally characterized proteins that we identified as increasing G1/S 1.8-fold or more could be categorized as early, tegument, or capsid/capsid assembly proteins, while several were completely uncharacterized (Table 1). While it is not unexpected that early and tegument proteins have roles in altering the cell cycle, we were surprised to find that capsid proteins consistently did so. This suggests that, like the incoming tegument proteins, capsids that are delivered to the cell may have roles in altering cell cycle progression. Results with individual EBV, HSV-1, and CMV proteins that increase G1/S are shown in Tables 2, 3, and 4, respectively, along with their subcellular localization.
TABLE 1.
Summary of herpesvirus proteins that increase G1/S in Fucci cells
| Virus | No. of proteins examined | No. of proteins with G1/S change (≥1.8 fold) | No. of proteins increasing G1/S by category |
|||
|---|---|---|---|---|---|---|
| Early | Tegument | Capsid/capsid assembly | Unknown | |||
| EBV | 55 | 24 | 9 | 5 | 7 | 3 |
| HSV-1 | 47 | 11 | 2 | 2 | 3 | 4 |
| HCMV | 105 | 10 | 1 | 2 | 1 | 6 |
TABLE 2.
EBV proteins that increase G1/S in Fucci cells
| Protein | Subcellular localization | Category | Function | Fold increase | SD |
|---|---|---|---|---|---|
| BLLF3 | Nuclear | Replication | dUTPase | 2.5 | 0.34 |
| BDLF1 | Pancellular | Capsid | Minor capsid protein | 2.3 | 0.14 |
| BORF1 | Nuclear | Capsid | Capsid structural protein | 2.2 | 0.36 |
| BMRF1 | Nuclear | Replication | DNA polymerase accessory protein | 2.0 | 0.23 |
| BALF1 | Cytoplasmic | Early gene | Inhibits apoptosis | 2.0 | 0.13 |
| BYRF1 | Cytoplasmic | Uncharacterized | Unknown | 2.0 | 0.28 |
| BSRF1 | Subcytoplasmic | Tegument | Cytoplasmic egress facilitator 1 | 2.0 | 0.17 |
| BGLF2 | Pancellular | Tegument | Unknown, homologue of CMV UL94, HSV-1 UL16, KSHV ORF33 | 2.0 | 0.17 |
| BKRF4 | Nuclear | Tegument | Unknown | 2.0 | 0.33 |
| BDRF1 | Nuclear | Capsid assembly | Proteinase/scaffold protein | 2.0 | 0.36 |
| BCRF1 | Subcytoplasmic | Early gene | Immunomodulation, viral interleukin 10 (IL-10) | 2.0 | 0.15 |
| BBLF4 | Pancellular | Replication | Helicase-primase ATPase subunit | 2.0 | 0.21 |
| BGLF3 | Pancellular | Capsid assembly | Encapsidation chaperone protein | 1.9 | 0.35 |
| BARF1 | Subcytoplasmic | Early gene | Immunomodulation | 1.9 | 0.21 |
| BcRF1 | Subcytoplasmic | Uncharacterized | Unknown, herpesvirus UL87 family | 1.9 | 0.14 |
| BDLF4 | Pancellular | Capsid assembly | DNA packaging protein | 1.9 | 0.07 |
| BVRF2 | Nuclear | Capsid assembly | Proteinase/scaffold protein | 1.9 | 0.35 |
| BFLF2 | Nuclear | Early gene | Egress | 1.9 | 0.23 |
| BGLF4 | Cytoplasmic | Tegument | Serine/threonine kinase | 1.9 | 0.08 |
| BTRF1 | Pancellular | Uncharacterized | Unknown | 1.9 | 0.17 |
| BFRF3 | Nuclear | Capsid | Small capsid protein; capsid transport | 1.8 | 0.19 |
| BORF2 | Subcytoplasmic | Replication | Ribonucleotide-reductase, large subunit | 1.8 | 0.28 |
| BKRF3 | Pancellular | Replication | Uracil DNA glycolase | 1.8 | 0.14 |
| BBLF1 | Cytoplasmic | Tegument | Egress | 1.8 | 0.08 |
TABLE 3.
HSV-1 proteins that increase G1/S in Fucci cells
| Protein name | Subcellular localization | Category | Function | Fold increase | SD |
|---|---|---|---|---|---|
| UL56 | Nuclear | Uncharacterized | Unknown but reduces virulence | 2.1 | 0.22 |
| UL24 | Nuclear | Tegument | Localization of viral glycoproteins | 2.1 | 0.19 |
| ICP35 | Pancellular | Capsid assembly | Protease, interacts with major capsid protein (VP5) | 2.0 | 0.10 |
| ORF O | Cytoplasmic | Uncharacterized | Related to ORFP, antisense to 34.5 | 2.0 | 0.13 |
| UL26 | Nuclear | Capsid assembly | Maturation protease | 2.0 | 0.32 |
| UL42 | Nuclear | Replication | Processivity subunit of HSV DNA polymerase | 1.9 | 0.07 |
| UL32 | Cytoplasmic | Capsid assembly | Capsid transport to replication compartments | 1.9 | 0.21 |
| UL20.5 | Nuclear | Uncharacterized | Unknown | 1.9 | 0.35 |
| ICP34.5 | Pancellular | Tegument | Neurovirulence factor, immunomodulation | 1.9 | 0.28 |
| UL52 | Cytoplasmic | Replication | Part of helicase-primase complex | 1.8 | 0.19 |
| UL8.5 | Nuclear | Uncharacterized | Unknown | 1.8 | 0.29 |
TABLE 4.
CMV proteins that increase G1/S in Fucci cells
| Protein | Subcellular localization | Category | Function | Fold increase | SD |
|---|---|---|---|---|---|
| UL80 | Nuclear | Capsid assembly | Scaffold protein | 2.5 | 0.23 |
| UL69 | Nuclear | Tegument | RNA binding and shuttling, cell cycle modulation | 2.1 | 0.21 |
| UL96 | Pancellular | Uncharacterized | Unknown | 2.0 | 0.08 |
| UL76 | Nuclear | Tegument | Regulates expression of some viral genes, induces IL-8, protein sequestration to aggresomes | 2.0 | 0.28 |
| J1L | Cytoplasmic | Uncharacterized | Unknown | 2.0 | 0.16 |
| TRL5 | Nuclear | Uncharacterized | Unknown | 1.9 | 0.22 |
| UL101 | Nuclear | Replication | Putative subunit of helicase/primase complex | 1.9 | 0.00 |
| UL12 | Cytoplasmic | Uncharacterized | Unknown | 1.9 | 0.08 |
| UL3 | Nuclear | Uncharacterized | Unknown | 1.8 | 0.12 |
| Us30 | Cytoplasmic | Uncharacterized | Unknown | 1.8 | 0.22 |
Validation of cell cycle effects of selected EBV proteins.
In order to validate the cell cycle results seen in the Fucci cell screen, we selected seven EBV proteins for further study, representing the capsid, replication, and tegument classifications of the G1/S-inducing proteins. These included two replication proteins (BMRF1, BORF2), three functionally uncharacterized tegument proteins (BGLF2, BKRF4, BLRF2), and two capsid proteins (BORF1, BFRF3). Note that, because the BDLF1 capsid protein was expressed only in a very small proportion of cells, we did not conduct further studies on this protein. In addition, the BGLF4 kinase tegument protein was not studied further, since there are already many publications on its functions, including cell cycle effects (37, 38). We expressed the seven FLAG-tagged EBV proteins (by transient transfection) in CNE2Z cells, an EBV-negative nasopharyngeal carcinoma cell line that is biologically relevant for EBV because EBV infection induces this cancer. The cells were stained with anti-FLAG antibody and propidium iodide, and then the cellular DNA content of the FLAG-positive and FLAG-negative cells was analyzed by fluorescence-activated cell sorting (FACS) as a measure of cell cycle phases (as shown in Fig. 2A and B for BORF1 and BGLF2). Since G1/S cells have the same DNA content as G1 cells, we expected proteins that increased G1/S accumulation to display increased G1 DNA content and decreased S phase DNA content using this assay. This was confirmed to various degrees for all of the EBV proteins examined but was not seen when the FLAG epitope was expressed on its own as a negative control (Fig. 2C). We also quantified effects of the proteins on S phase by measuring incorporation of bromodeoxyuridine (BrdU) in FLAG-positive and FLAG-negative transfected CNE2Z cells (sorted by FACS), after pulse-labeling with this nucleotide analogue. Consistent with the DNA content analysis, all of the proteins decreased BrdU incorporation, indicating that fewer cells were in S phase (Fig. 2A, B, and C). These results are consistent with a role for these proteins in causing G1/S accumulation, indicating that this cell cycle effect is not particular to Fucci cells.
Five of the seven EBV proteins analyzed above have homologues in HSV-1 and CMV. To determine if the cell cycle effect of the EBV proteins is conserved in other herpesviruses, we compared the effects of the available homologues in the FACS-based colorimetric assay in Fucci cells. For each of the five EBV proteins, at least 1 homologue in HSV-1 or CMV also caused an increase in G1/S cells, suggesting a conservation of the cell cycle function (Table 5).
TABLE 5.
Comparison of EBV protein homologues for effects on G1/S progression in Fucci cells
| Viral protein function | EBV |
HSV-1 |
CMV |
|||
|---|---|---|---|---|---|---|
| Protein | G1/S (fold increase) | Protein | G1/S (fold increase) | Protein | G1/S (fold increase) | |
| Processivity factor | BMRF1 | 2.0 | UL42 | 1.9 | UL44 | 1.0 |
| Uncharacterized | BGLF2 | 2.0 | UL16 | 1.0 | UL94 | 1.6 |
| Ribonucleotide reductase, large subunit | BORF2 | 1.8 | UL39 | NDa | UL45 | 2.6 |
| Capsid | BDLF1 | 2.3 | UL18 | 1.2 | UL85 | 1.6 |
| Capsid | BORF1 | 2.0 | UL38 | 1.8 | UL46 | ND |
| Capsid | BFRF3 | 1.8 | UL35 | 1.5 | UL48A | ND |
ND, not determined; plasmid not present in the plasmid library.
Effects of EBV G1/S-inducing proteins on p53 and p21.
p53 plays an integral role in eliciting a G1/S arrest and utilizes several mechanisms to do so, including the induction of p21 expression (39). Considerable evidence indicates that manipulation of p53 and p21 is an important part of the mechanisms by which herpesviruses elicit cell cycle arrest (1). Therefore, we examined the effect of the set of G1/S-inducing EBV proteins on p53 levels, p53 activation by phosphorylation (at serine 15), and p21 levels (Fig. 3A). These proteins were examined in CNE2Z cells after transfection with the EBV expression plasmid, the pMZS3F empty plasmid as a negative control, or a BZLF1 expression plasmid. The latter served as a positive control, since BZLF1 is known to induce p53, leading to cell cycle arrest (9). In addition, etoposide treatment was used a positive control and, as expected, greatly increased the levels of p53, phosphorylated p53, and p21. Two EBV proteins consistently induced p53 levels, BMRF1 and BORF2, both of which are early proteins involved in DNA replication (Fig. 3A and B). However, neither of these proteins induced p21 above the pMZ3F negative control. In contrast, the BGLF2 tegument protein failed to induce p53 but substantially increased p21 levels (Fig. 3A and C).
FIG 3.
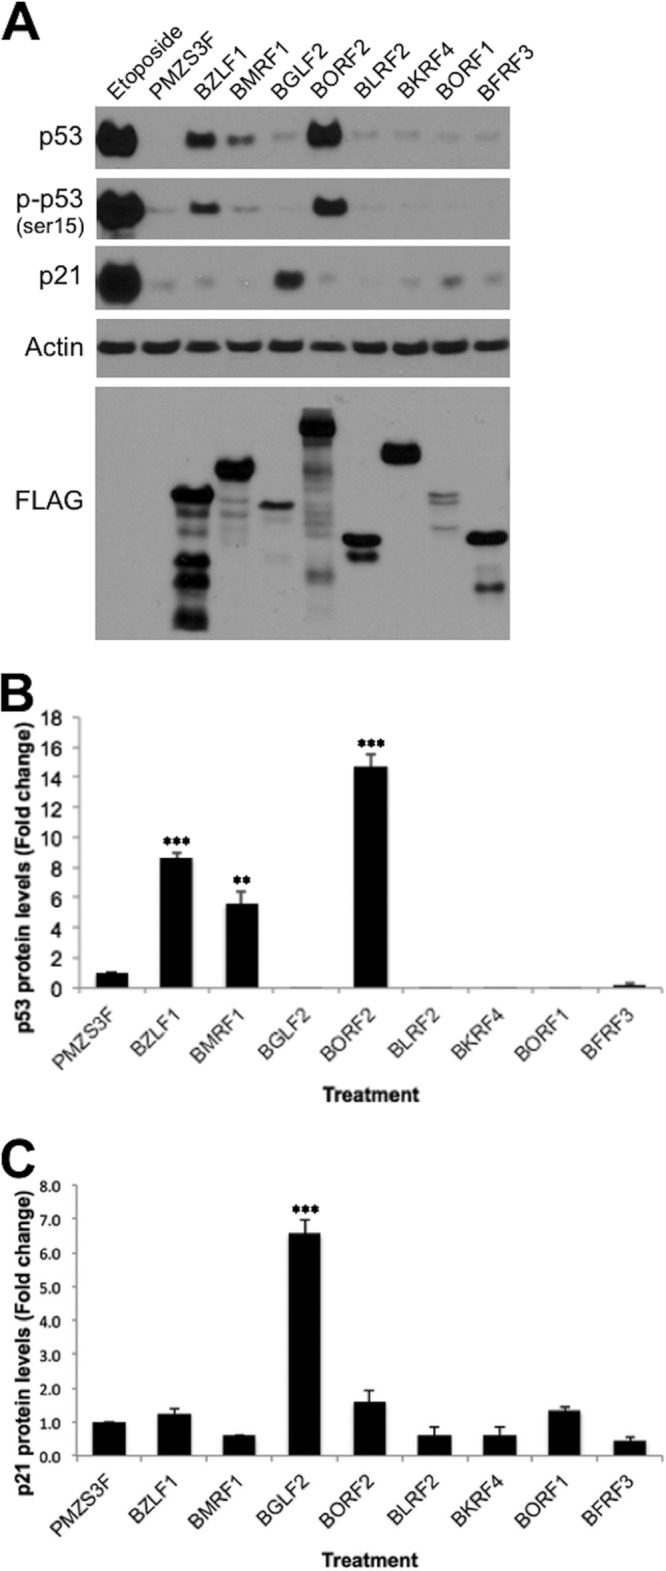
Effect of EBV proteins on p53 and p21. (A) CNE2Z cells were transfected with the indicated EBV expression plasmids or empty expression plasmid (pMZS3F), and, 24 h later, cell lysates were analyzed by Western blotting using antibodies specific to the indicated proteins or to the FLAG tag on the EBV proteins. CNE2Z cells treated with etoposide are shown as a positive control for p53 activation. p53 (B) and p21 (C) levels from CNE2Z cells transfected with expression plasmids as described for panel A were quantified from Western blots from three independent experiments. Average values with standard deviations are shown relative to pMZS3F samples, which were set to one.
BGLF2 induces p21 expression independently of p53 activation.
Since the p21 induction by BGLF2 was particularly striking and no functional studies have been published on this protein, we focused subsequent studies on this protein. Because our initial screen of G1/S effects was conducted in Fucci cells, we first examined whether BGLF2 had similar effects on p21 in this cell line. In keeping with the results in CNE2Z cells, transient expression of BGLF2 in Fucci cells increased the level of p21 without affecting p53 levels or phosphorylation at Ser 15, suggesting that p21 induction is independent of p53 (Fig. 4A). To test the requirement of p53 for p21 induction more directly, BGLF2 was expressed in H1299 p53-null cells, and effects on p21 were examined. As shown in Fig. 4B, p21 expression levels were increased when cells contained the BGLF2 expression plasmid relative to the empty plasmid control, confirming that BGLF2 can induce p21 independently from p53. The expression of E2F-associated phosphoprotein (EAPP) is also important for activating p21 transcription and can act independently of p53 (40, 41). Therefore, we also examined possible effects of BGLF2 on EAPP levels; however, BGLF2 did not significantly alter EAPP levels relative to those of the empty plasmid control (Fig. 4C).
FIG 4.

BGLF2 induces p21 protein levels in a p53-independent manner. (A) Fucci cells were transfected with pMZS3F or pMZS3F-BGLF2 and, 24 h later, cell lysates were analyzed by Western blotting for p53, phosphorylated p53 [p-p53 (ser15)], and p21, using actin as a loading control. (B and C) H1299 p53-null cells were transfected as described for panel A and then lysates were Western blotted for p21 (B) or EAPP (C) in addition to FLAG-BGLF2 and actin. CNE2Z (D) and H1299 (E) cells were transfected as described above, and then p21 transcript levels were determined by quantitative PCR and normalized to GAPDH. Average values with standard deviations are shown from three independent experiments.
We next examined whether the p53-independent induction of p21 by BGLF2 resulted from increased p21 transcription. To this end, we compared the levels of p21 transcripts by quantitative PCR in CNE2Z and H1299 cells after transient transfection with the BGLF2 expression plasmid or empty plasmid (Fig. 4D and E). Etoposide treatment was used as a positive control in these experiments and, as expected, greatly increased the level of p21 transcripts. BGLF2 did not significantly increase the levels of p21 transcripts in either cell line, suggesting that it did not affect the generation or stability of p21 mRNA but rather affected p21 at the protein level.
BGLF2 interacts with two host proteins that affect cell cycle progression.
To gain insight into how BGLF2 might be affecting cell cycle progression, we conducted a proteomic experiment in which BGLF2, transiently expressed in CNE2Z cells, was recovered from cell lysates by virtue of its FLAG tag, and copurifying proteins were trypsinized and identified by mass spectroscopy (liquid chromatography [LC]-MS/MS). Proteins recovered with BGLF2 were compared to those recovered on anti-FLAG resin from CNE2Z cells containing the empty plasmid (pMZS3F) or pMZS3F-expressing LacZ (Fig. 5A). The most prevalent proteins that interacted with BGLF2 in two independent experiments but were not recovered with the negative-control samples were NEK9 and GMIP. Interestingly, NEK9 has multiple effects on the cell cycle, including modulating G1/S progression (42). GMIP is a member of the ARHGAP family of Rho/Rac/Cdc42-like GTPase-activating proteins, which specifically stimulate the GTPase activity of RhoA (43). Although a direct role for GMIP during G1/S progression has not been established, RhoA has been shown to influence G1/S transition by several mechanisms, including p21 regulation (44) and modulation of INK4 family members (45).
FIG 5.

BGLF2 interacts with host NEK9 and GMIP. (A) CNE2Z cells were transfected with pMZS3F or pMZS3F-expressing LacZ or BGLF2. Twenty-four hours later, FLAG-tagged proteins were recovered on anti-FLAG resin, and copurifying proteins were identified by LC-MS/MS. Total spectral counts recovered for NEK9 and GMIP for each construct from two independent experiments are shown (separated by an asterisk), as are the spectral counts for BGLF2. (B) CNE2Z cells transfected as described for panel A were subjected to FLAG immunoprecipitation, followed by Western blotting for NEK9, GMIP, and FLAG. Input samples prior to IP are also shown (5% of lysate used for immunoprecipitation). (C) CNE2Z cells transfected with pMZS3F or pMZS3F-BGLF2 were stained with antibodies against FLAG and NEK9 (top) or FLAG and GMIP (bottom) and counterstained with 4′,6-diamidino-2-phenylindole (DAPI).
Interactions of BGLF2 with NEK9 and GMIP were confirmed by FLAG immunoprecipitation of BGLF2 from CNE2Z extracts, followed by Western blotting with antibodies specific to NEK9 and GMIP (Fig. 5B). In contrast, NEK9 and GMIP were not recovered in FLAG immunoprecipitations performed with CNE2Z extracts containing pMZS3F or pMZS3F-LacZ. We also examined the effect of BGLF2 on the localization of NEK9 and GMIP by immunofluorescence microscopy. In untransfected cells (data not shown) or CNE2Z cells transfected with pMZS3F (Fig. 5C), NEK9 appeared largely cytoplasmic in virtually all (∼95%) of the cells. However, in the presence of BGLF2, NEK9 was largely pancellular, reflecting the localization of BGLF2 (Fig. 5C). The pancellular localization of NEK9 was seen in 93% of BGLF2-expressing cells. In untransfected or pMZS3F-transfected cells, GMIP was predominantly cytoplasmic, with a lesser amount of staining in the nucleus (Fig. 5C). In cells expressing BGLF2, the nuclear staining of GMIP was increased to various degrees, resulting in more pancellular staining, similar to that of BGLF2. The results confirm the mass spectrometry data that BGLF2 interacts with NEK9 and GMIP.
NEK9 and GMIP regulate p21 and are required for BGLF2 to induce p21.
We next tested the hypothesis that BGLF2 induces p21 by altering the function of NEK9 or GMIP. To begin with, we asked whether silencing NEK9 or GMIP affected p21 levels. As shown in Fig. 6A, treatment of CNE2Z cells with siRNA targeting NEK9 or GMIP greatly induced p21 levels compared to negative-control (AllStars) siRNA treatment, showing that both proteins contribute to p21 regulation. Interestingly, like BGLF2 expression, depletion of NEK9 or GMIP induced p21 without inducing p53. We then asked whether BGLF2 could induce p21 in the absence of NEK9 and GMIP. To this end, NEK9 or GMIP was silenced prior to transient transfection with the BGLF2 expression plasmid or empty plasmid (Fig. 6B). As expected, BGLF2 induced p21 but not p53 in cells treated with negative-control siRNA (compare lanes 1 and 2 in Fig. 6B), but after depletion of NEK9 or GMIP, BGLF2 either did not affect the level of p21 (compare lanes 5 and 6) or slightly decreased it (compare lanes 3 and 4). The results suggest that NEK9 and GMIP are regulators of p21 and that BGLF2 induces p21 at least in part by altering the functions of NEK9 and GMIP.
FIG 6.
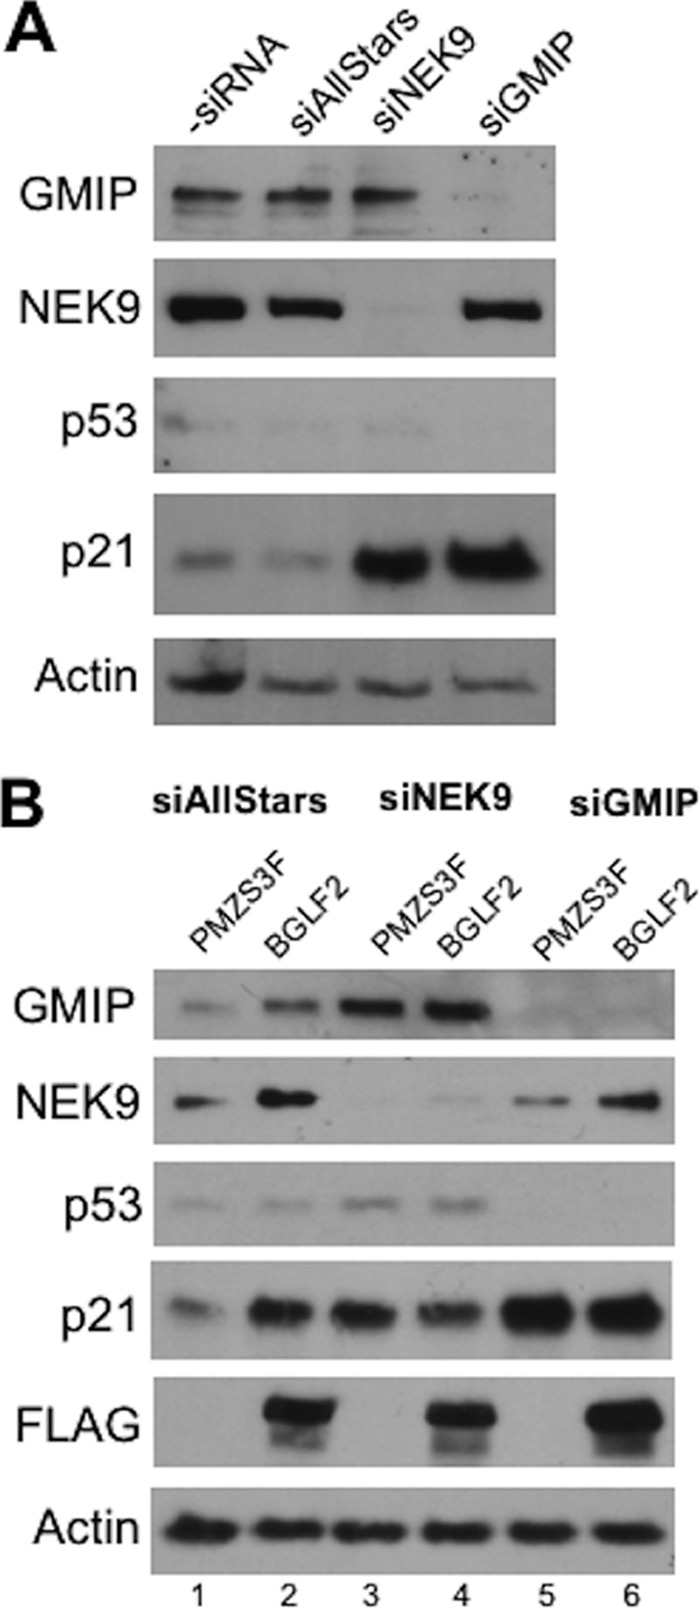
NEK9 and GMIP contribute to p21 induction by BGLF2. (A) CNE2Z cells were treated with siRNA against NEK9 or GMIP or negative-control siRNA (AllStars). Cell lysates were then analyzed by Western blotting for p53, p21, NEK9, GMIP, and actin. (B) CNE2Z cells were treated with siRNA targeted to NEK9 or GMIP or with AllStars negative-control siRNA and then were transfected with pMZS3F or pMZS3F-BGLF2. Twenty-four hours later, cell lysates were analyzed by Western blotting using the indicated antibodies.
DISCUSSION
As part of their lytic mode of infection, herpesviruses induce cell cycle arrest predominantly at the G1/S interface. Various viral proteins have been implicated in this growth arrest, but only a small proportion of the encoded proteins have been studied for cell cycle effects. To gain a more comprehensive view of herpesvirus proteins that contribute to G1/S arrest, we screened a library of over 200 HSV-1, CMV, and EBV proteins for the ability to increase the proportion of cells in G1/S, using the HeLa Fucci cell line in which the G1/S phase can be identified colorimetrically. In this way, we identified several proteins from each virus that impact the G1/S transition, including 13 proteins with no previously assigned functions.
Herpesviruses can impact cellular processes immediately upon infection by packaging specific viral proteins in the tegument of the virion, such that they are delivered to the cell upon initial infection. Therefore, it is not unexpected that some of the G1/S-inducing proteins would be tegument proteins. Indeed, our screen identified five tegument proteins (3 from EBV, 2 from CMV, 1 from HSV-1) that increased the population of cells at G1/S, and two of these (EBV BGLF2 and BKRF4) have not been previously studied. Of the three EBV tegument proteins that we identified as inducing G1/S, only the BGLF4 Ser/Thr protein kinase has been functionally characterized. Among the various functions reported for BGLF4 is the ability to inhibit cell cycle progression, particularly at the G1/S interface (37). Our results are in agreement with this conclusion. One of the two CMV tegument proteins that we identified as increasing G1/S cells was UL69, which was previously reported to shift cells to the G1 compartment according to DNA content analysis (16, 17). This observation is consistent with our result that UL69 induces G1/S accumulation, which is indistinguishable from G1 based on DNA content. The other CMV tegument protein identified in our screen was UL76, which has been reported to have a variety of functions, including induction of cell cycle arrest (46–50). This protein is conserved in all herpesviruses, and, interestingly, its homologue in HSV-1 (UL24) was also a top hit in our screen for induction of G1/S. UL24 also appears to have multiple functions, contributing to viral egress, affecting the localization of some cellular nucleolar proteins and, like CMV UL76, was reported to induce cell cycle arrest (48, 51, 52). The EBV homologue of CMV UL76, BXRF1, has not been studied and was not tested in our screen since it failed to express. Our data suggest that UL24 and its homologues also contribute to the G1/S arrest during lytic infections.
In addition to tegument proteins, our screen for proteins inducing G1/S accumulation identified several capsid protein and capsid-interacting proteins. While capsid proteins have traditionally been thought of as strictly structural proteins, our findings suggest that, like tegument proteins, capsid proteins may also be able to impact cellular processes upon their delivery into the cell. These findings are consistent with those of Dargan and Subak-Sharpe (53), who found that infection with HSV-1 L-particles (which do not contain viral DNA) inhibited cellular growth, suggesting that virion constituents alter cell cycle progression. While nonstructural roles of herpesvirus capsid proteins have been largely unexplored, there are several examples of other viruses that use their capsid proteins to affect cellular processes. For example, several RNA viruses, including flaviviruses, togaviruses, and coronaviruses, use their capsid proteins to inhibit apoptosis and innate antiviral responses and to stimulate viral gene expression (reviewed in reference 54). Additionally, coronavirus nucleocapsid (N) protein has been shown to inhibit S phase progression by modulating cyclin-CDK activity (55), a cell cycle effect similar to that which we observed for three EBV capsid proteins. Capsid proteins from two DNA viruses have also been reported to interact with host proteins to alter cellular processes. Adenovirus capsid protein VI interacts with Daxx to counteract its transcriptional repression of the Ad1A promoter (56), while the L2 minor capsid protein of human papillomavirus type 33 modulates the composition of PML nuclear bodies, including decreasing Sp100 and increasing Daxx (57, 58). In light of these data and our results with EBV capsid proteins, we propose that incoming herpesvirus capsids, after release from the envelope and tegument, have a role in altering cellular processes, including cell cycle progression, either as intact capsids or as individual proteins or subassemblies once capsids are disassembled.
There are many ways that viral proteins could block cells in G1 or at the G1/S transition, including inducing or activating p53, pRB (retinoblastoma protein), ATM, or Chk2 (reviewed in references 1, 59, and 60). Seven of the EBV proteins identified in our screen as G1/S inducers were examined for their effect on all these proteins. While we did not see consistent induction or activation (phosphorylation) of pRB, ATM, or Chk2, BMRF1 and BORF2 were found to consistently induce the level of total and Ser15-phosphorylated p53. Interestingly, despite inducing p53, both proteins failed to induce the p53 target gene p21, suggesting that they disable downstream functions of p53. While both BMRF1 and BORF2 have roles in DNA replication, as the DNA polymerase processivity factor and the ribonucleotide reductase large subunit (RR1), respectively, there is reason to believe that these proteins may have additional functions in affecting cellular processes. While cellular effects of BMRF1 have not been studied directly, the HSV-1 homologue of BMRF1 (UL42) has been reported to interact with NF-κB subunits p65 and p50 and inhibit their nuclear translocation (61). In addition, the CMV homologue (UL44) was found to inhibit the ability of p53 to induce p21 expression (62). This might explain our observation that BMRF1 failed to induce p21 despite induction of p53. For the RR1 proteins, the HSV-2 RR1 homologue (UL39) has been reported to bind caspase-8 and protect against tumor necrosis factor alpha (TNF-α)- and FasL-induced apoptosis, although these properties were not seen with the EBV homologue, BORF2 (63). In addition, the RR1 homologues in human and mouse CMV (UL45 and M45, respectively) have been shown to contribute to viral infectivity despite having mutations that make them incapable of reducing ribonucleotides (64, 65). The fact that CMV has retained these proteins that are inactive for DNA replication and packages them in the tegument (64) suggests that they have roles outside DNA replication. Our results suggest that these roles include effects on the G1/S transition and part of the p53 pathway.
In contrast to the results with BMRF1 and BORF2, we found that BGLF2, a functionally uncharacterized tegument protein, increased p21 levels without inducing the level or phosphorylation of p53. Furthermore, experiments in p53-null cells showed that p53 was not required for BGLF2 to induce p21. BGLF2 did not increase the level of p21 transcripts or EAPP protein, which is known to activate transcription of the p21 gene, suggesting that the p21 protein itself was stabilized. p21 can be stabilized by changes to its phosphorylation state or by protein interactions (66). For example, AKTI/PKB and PIM-2 increase p21 stability by phosphorylating it at Ser 146 and Thr 145, respectively (67, 68), while GSK-3 destabilizes p21 by phosphorylating it at Thr 57 (69). In contrast, cyclin D1 binding to p21 stabilizes p21 by preventing its interaction with the proteasome, and Ras stabilizes p21 by inducing the formation of the cyclin D1-p21complex (70). The mechanism by which BGLF2 stabilizes p21 remains to be determined, but we have not detected an interaction between BGLF2 and p21 by coimmunoprecipitation (co-IP) experiments.
Using a proteomics approach, we found that BGLF2 interacts with two cellular proteins, GMIP and NEK9. GMIP was discovered as a binding partner of GEM and also binds and stimulates the GTPase activity of RhoA (43). Although a direct role for GMIP during G1/S progression or in p21 regulation has not been previously investigated, both GEM and RhoA have been shown to affect the G1/S transition (45, 71), and RhoA has a role in regulating p21 (44). NEK9 is a protein kinase that has multiple effects on the cell cycle, including maintaining proper G1/S progression through interactions with FACT (42). Downregulation of NEK9 by RNA interference has been found to slow the progression from G1 phase to S phase, suggesting that NEK9 function is required for this transition (42). We found that silencing of either NEK9 or GMIP resulted in induction of p21, suggesting that p21 regulation might contribute to the cell cycle effects of these proteins. Interestingly, this p21 induction was not accompanied by p53 induction, suggesting that the p21 regulation is p53 independent and phenocopying the effect of BGLF2 expression. Furthermore, BGLF2 did not further increase p21 levels when NEK9 or GMIP were silenced. The results as a whole suggest that BGLF2 induces p21 by interfering with the functions of NEK9 and GMIP. Interestingly, this is not the first report of a viral protein targeting NEK9, as adenovirus E1A was previously shown to interact with NEK9 and alter its subcellular localization (32).
In conclusion, we have used the Fucci cell system to identify several herpesvirus proteins that induce cells to accumulate at the G1/S interface. This provided the first functional information for 5 EBV, 3 HSV-1, and 6 CMV proteins, including BGLF2, which we have shown to induce p21 protein levels in a manner that is p53 independent but involves NEK9 and GMIP. In addition, our results provide the first indication that herpesvirus capsid proteins can affect cellular processes, including cell cycle progression. Our study as a whole suggests that multiple viral proteins and mechanisms contribute to G1/S arrest typical of herpesvirus lytic infections.
ACKNOWLEDGMENTS
We thank Peter Whyte (McMaster University) for NEK9 antibody and Donald Coen (Harvard University) for UL44 plasmid constructs. We also thank Peter Young and Gabriela Ridlova for assistance in mass spectroscopy analyses and Dionne White for assistance with FACS analysis.
This work was funded by operating grant number 12477 awarded to L.F. from the Canadian Institutes of Health Research.
L.F. is a tier 1 Canada Research Chair in Molecular Virology.
ADDENDUM IN PROOF
Just after this paper was accepted, Chudasama et al. (Chudasama P, Konrad A, Jochmann R, Lausen B, Holz P, Naschberger E, Neipel F, Britzen-Laurent N, Stürzl M, Oncogene, 27 January 2014, http://dx.doi.org/10.1038/onc.2013.595) reported a role for the ORF25 Kaposi's sarcoma-associated herpesvirus capsid protein in inhibiting p53-mediated apoptosis.
Footnotes
Published ahead of print 5 February 2014
REFERENCES
- 1.Flemington EK. 2001. Herpesvirus lytic replication and the cell cycle: arresting new developments. J. Virol. 75:4475–4481. 10.1128/JVI.75.10.4475-4481.2001 [DOI] [PMC free article] [PubMed] [Google Scholar]
- 2.Ehmann GL, McLean TI, Bachenheimer SL. 2000. Herpes simplex virus type 1 infection imposes a G(1)/S block in asynchronously growing cells and prevents G(1) entry in quiescent cells. Virology 267:335–349. 10.1006/viro.1999.0147 [DOI] [PubMed] [Google Scholar]
- 3.Song B, Liu JJ, Yeh K-C, Knipe DM. 2000. Herpes simplex virus infection blocks events in the G1 phase of the cell cycle. Virology 267:326–334. 10.1006/viro.1999.0146 [DOI] [PubMed] [Google Scholar]
- 4.Lu M, Shenk T. 1996. Human cytomegalovirus infection inhibits cell cycle progression at multiple points, including the transition from G1 to S. J. Virol. 70:8850–8857 [DOI] [PMC free article] [PubMed] [Google Scholar]
- 5.Dittmer D, Mocarski ES. 1997. Human cytomegalovirus infection inhibits G1/S transition. J. Virol. 71:1629–1634 [DOI] [PMC free article] [PubMed] [Google Scholar]
- 6.Bresnahan WA, Boldogh I, Thompson EA, Albrecht T. 1996. Human cytomegalovirus inhibits cellular DNA synthesis and arrests productively infected cells in late G1. Virology 224:150–160. 10.1006/viro.1996.0516 [DOI] [PubMed] [Google Scholar]
- 7.Rodriguez A, Jung EJ, Flemington EK. 2001. Cell cycle analysis of Epstein-Barr virus-infected cells following treatment with lytic cycle-inducing agents. J. Virol. 75:4482–4489. 10.1128/JVI.75.10.4482-4489.2001 [DOI] [PMC free article] [PubMed] [Google Scholar]
- 8.Kudoh A, Fujita M, Kiyono T, Kuzushima K, Sugaya Y, Izuta S, Nishiyama Y, Tsurumi T. 2003. Reactivation of lytic replication from B cells latently infected with Epstein-Barr virus occurs with high S-phase cyclin-dependent kinase activity while inhibiting cellular DNA replication. J. Virol. 77:851–861. 10.1128/JVI.77.2.851-861.2003 [DOI] [PMC free article] [PubMed] [Google Scholar]
- 9.Rodriguez A, Armstrong M, Dwyer D, Flemington E. 1999. Genetic dissection of cell growth arrest functions mediated by the Epstein-Barr virus lytic gene product, Zta. J. Virol. 73:9029–9038 [DOI] [PMC free article] [PubMed] [Google Scholar]
- 10.Salvant BS, Fortunato EA, Spector DH. 1998. Cell cycle dysregulation by human cytomegalovirus: influence of the cell cycle phase at the time of infection and effects on cyclin transcription. J. Virol. 72:3729–3741 [DOI] [PMC free article] [PubMed] [Google Scholar]
- 11.Jordan R, Schang L, Schaffer PA. 1999. Transactivation of herpes simplex virus type 1 immediate-early gene expression by virion-associated factors is blocked by an inhibitor of cyclin-dependent protein kinases. J. Virol. 73:8843–8847 [DOI] [PMC free article] [PubMed] [Google Scholar]
- 12.Fortunato EA, Sanchez V, Yen JY, Spector DH. 2002. Infection of cells with human cytomegalovirus during S phase results in a blockade to immediate-early gene expression that can be overcome by inhibition of the proteasome. J. Virol. 76:5369–5379. 10.1128/JVI.76.11.5369-5379.2002 [DOI] [PMC free article] [PubMed] [Google Scholar]
- 13.Lomonte P, Everett RD. 1999. Herpes simplex virus type 1 immediate-early protein Vmw110 inhibits progression of cells through mitosis and from G(1) into S phase of the cell cycle. J. Virol. 73:9456–9467 [DOI] [PMC free article] [PubMed] [Google Scholar]
- 14.Hobbs WE, DeLuca NA. 1999. Perturbation of cell cycle progression and cellular gene expression as a function of herpes simplex virus ICP0. J. Virol. 73:8245–8255 [DOI] [PMC free article] [PubMed] [Google Scholar]
- 15.Song B, Yeh KC, Liu J, Knipe DM. 2001. Herpes simplex virus gene products required for viral inhibition of expression of G1-phase functions. Virology 290:320–328. 10.1006/viro.2001.1175 [DOI] [PubMed] [Google Scholar]
- 16.Lu M, Shenk T. 1999. Human cytomegalovirus UL69 protein induces cells to accumulate in G1 phase of the cell cycle. J. Virol. 73:676–683 [DOI] [PMC free article] [PubMed] [Google Scholar]
- 17.Hayashi ML, Blankenship C, Shenk T. 2000. Human cytomegalovirus UL69 protein is required for efficient accumulation of infected cells in the G1 phase of the cell cycle. Proc. Natl. Acad. Sci. U. S. A. 97:2692–2696. 10.1073/pnas.050587597 [DOI] [PMC free article] [PubMed] [Google Scholar]
- 18.Wiebusch L, Hagemeier C. 1999. Human cytomegalovirus 86-kilodalton IE2 protein blocks cell cycle progression in G(1). J. Virol. 73:9274–9283 [DOI] [PMC free article] [PubMed] [Google Scholar]
- 19.Bonin LR, McDougall JK. 1997. Human cytomegalovirus IE2 86-kilodalton protein binds p53 but does not abrogate G1 checkpoint function. J. Virol. 71:5861–5870 [DOI] [PMC free article] [PubMed] [Google Scholar]
- 20.Muganda P, Mendoza O, Hernandez J, Qian Q. 1994. Human cytomegalovirus elevates levels of the cellular protein p53 in infected fibroblasts. J. Virol. 68:8028–8034 [DOI] [PMC free article] [PubMed] [Google Scholar]
- 21.Cayrol C, Flemington EK. 1996. The Epstein-Barr virus bZIP transcription factor Zta causes G0/G1 cell cycle arrest through induction of cyclin-dependent kinase inhibitors. EMBO J. 15:2748–2759 [PMC free article] [PubMed] [Google Scholar]
- 22.Huang S-Y, Hsieh M-J, Chen C-Y, Chen Y-J, Chen J-Y, Chen M-R, Tsai C-H, Lin S-F, Hsu T-Y. 2012. Epstein-Barr virus Rta-mediated transactivation of p21 and 14-3-3σ arrests cells at the G1/S transition by reducing cyclin E/CDK2 activity. J. Gen. Virol. 93:139–149. 10.1099/vir.0.034405-0 [DOI] [PubMed] [Google Scholar]
- 23.Salsman J, Zimmerman N, Chen T, Domagala M, Frappier L. 2008. Genome-wide screen of three herpesviruses for protein subcellular localization and alteration of PML nuclear bodies. PLoS Pathog. 4:e1000100. 10.1371/journal.ppat.1000100 [DOI] [PMC free article] [PubMed] [Google Scholar]
- 24.Zeghouf M, Li J, Butland G, Borkowska A, Canadien V, Richards D, Beattie B, Emili A, Greenblatt JF. 2004. Sequential peptide affinity (SPA) system for the identification of mammalian and bacterial protein complexes. J. Proteome Res. 3:463–468. 10.1021/pr034084x [DOI] [PubMed] [Google Scholar]
- 25.Salsman J, Wang X, Frappier L. 2011. Nuclear body formation and PML body remodeling by the human cytomegalovirus protein UL35. Virology 414:119–129. 10.1016/j.virol.2011.03.013 [DOI] [PubMed] [Google Scholar]
- 26.Sakaue-Sawano A, Kurokawa H, Morimura T, Hanyu A, Hama H, Osawa H, Kashiwagi S, Fukami K, Miyata T, Miyoshi H, Imamura T, Ogawa M, Masai H, Miyawaki A. 2008. Visualizing spatiotemporal dynamics of multicellular cell-cycle progression. Cell 132:487–498. 10.1016/j.cell.2007.12.033 [DOI] [PubMed] [Google Scholar]
- 27.Nishitani H, Lygerou Z, Nishimoto T. 2004. Proteolysis of DNA replication licensing factor Cdt1 in S-phase is performed independently of geminin through its N-terminal region. J. Biol. Chem. 279:30807–30816. 10.1074/jbc.M312644200 [DOI] [PubMed] [Google Scholar]
- 28.Nishitani H, Taraviras S, Lygerou Z, Nishimoto T. 2001. The human licensing factor for DNA replication Cdt1 accumulates in G1 and is destabilized after initiation of S-phase. J. Biol. Chem. 276:44905–44911. 10.1074/jbc.M105406200 [DOI] [PubMed] [Google Scholar]
- 29.Sun Y, Hegamyer G, Cheng YJ, Hildesheim A, Chen JY, Chen IH, Cao Y, Yao KT, Colburn NH. 1992. An infrequent point mutation of the p53 gene in human nasopharyngeal carcinoma. Proc. Natl. Acad. Sci. U. S. A. 89:6516–6520. 10.1073/pnas.89.14.6516 [DOI] [PMC free article] [PubMed] [Google Scholar]
- 30.Takahashi T, Carbone D, Takahashi T, Nau MM, Hida T, Linnoila I, Ueda R, Minna JD. 1992. Wild-type but not mutant p53 suppresses the growth of human lung cancer cells bearing multiple genetic lesions. Cancer Res. 52:2340–2343 [PubMed] [Google Scholar]
- 31.Salsman J, Jagannathan M, Paladino P, Chan P-K, Dellaire G, Raught B, Frappier L. 2012. Proteomic profiling of the human cytomegalovirus UL35 gene products reveals a role for UL35 in the DNA repair response. J. Virol. 86:806–820. 10.1128/JVI.05442-11 [DOI] [PMC free article] [PubMed] [Google Scholar]
- 32.Pelka P, Scimè A, Mandalfino C, Joch M, Abdulla P, Whyte P. 2007. Adenovirus E1A proteins direct subcellular redistribution of Nek9, a NimA-related kinase. J. Cell. Physiol. 212:13–25. 10.1002/jcp.20983 [DOI] [PubMed] [Google Scholar]
- 33.Sarkari F, Wang X, Nguyen T, Frappier L. 2011. The herpesvirus associated ubiquitin specific protease, USP7, is a negative regulator of PML proteins and PML nuclear bodies. PLoS One 6:e16598. 10.1371/journal.pone.0016598 [DOI] [PMC free article] [PubMed] [Google Scholar]
- 34.Sarkari F, Sheng Y, Frappier L. 2010. USP7/HAUSP promotes the sequence-specific DNA binding activity of p53. PLoS One 5:e13040. 10.1371/journal.pone.0013040 [DOI] [PMC free article] [PubMed] [Google Scholar]
- 35.Ni Z, Olsen JB, Emili A, Greenblatt JF. 2011. Identification of mammalian protein complexes by lentiviral-based affinity purification and mass spectrometry. Methods Mol. Biol. 781:31–45. 10.1007/978-1-61779-276-2_2 [DOI] [PubMed] [Google Scholar]
- 36.Liu G, Zhang J, Larsen B, Stark C, Breitkreutz A, Lin Z-Y, Breitkreutz B-J, Ding Y, Colwill K, Pasculescu A, Pawson T, Wrana JL, Nesvizhskii AI, Raught B, Tyers M, Gingras A-C. 2010. ProHits: integrated software for mass spectrometry-based interaction proteomics. Nat. Biotechnol. 28:1015–1017. 10.1038/nbt1010-1015 [DOI] [PMC free article] [PubMed] [Google Scholar]
- 37.Chang Y-H, Lee C-P, Su M-T, Wang J-T, Chen J-Y, Lin S-F, Tsai C-H, Hsieh M-J, Takada K, Chen M-R. 2012. Epstein-Barr virus BGLF4 kinase retards cellular S-phase progression and induces chromosomal abnormality. PLoS One 7:e39217. 10.1371/journal.pone.0039217 [DOI] [PMC free article] [PubMed] [Google Scholar]
- 38.Lee C-P, Chen J-Y, Wang J-T, Kimura K, Takemoto A, Lu C-C, Chen M-R. 2007. Epstein-Barr virus BGLF4 kinase induces premature chromosome condensation through activation of condensin and topoisomerase II. J. Virol. 81:5166–5180. 10.1128/JVI.00120-07 [DOI] [PMC free article] [PubMed] [Google Scholar]
- 39.Böhlig L, Rother K. 2011. One function—multiple mechanisms: the manifold activities of p53 as a transcriptional repressor. J. Biomed. Biotechnol. 10.1155/2011/464916 [DOI] [PMC free article] [PubMed] [Google Scholar]
- 40.Andorfer P, Schwarzmayr L, Rotheneder H. 2011. EAPP modulates the activity of p21 and Chk2. Cell Cycle 10:2077–2082. 10.4161/cc.10.13.16247 [DOI] [PMC free article] [PubMed] [Google Scholar]
- 41.Andorfer P, Rotheneder H. 2011. EAPP: gatekeeper at the crossroad of apoptosis and p21-mediated cell-cycle arrest. Oncogene 30:2679–2690. 10.1038/onc.2010.639 [DOI] [PMC free article] [PubMed] [Google Scholar]
- 42.Tan BC-M, Lee S-C. 2004. Nek9, a novel FACT-associated protein, modulates interphase progression. J. Biol. Chem. 279:9321–9330. 10.1074/jbc.M311477200 [DOI] [PubMed] [Google Scholar]
- 43.Aresta S, de Tand-Heim M-F, Béranger F, de Gunzburg J. 2002. A novel Rho GTPase-activating-protein interacts with Gem, a member of the Ras superfamily of GTPases. Biochem. J. 367:57–65. 10.1042/BJ20020829 [DOI] [PMC free article] [PubMed] [Google Scholar]
- 44.Adnane J, Bizouarn FA, Qian Y, Hamilton AD, Sebti SM. 1998. p21(WAF1/CIP1) is upregulated by the geranylgeranyltransferase I inhibitor GGTI-298 through a transforming growth factor beta- and Sp1-responsive element: involvement of the small GTPase rhoA. Mol. Cell. Biol. 18:6962–6970 [DOI] [PMC free article] [PubMed] [Google Scholar]
- 45.Zhang S, Tang Q, Xu F, Xue Y, Zhen Z, Deng Y, Liu M, Chen J, Liu S, Qiu M, Liao Z, Li Z, Luo D, Shi F, Zheng Y, Bi F. 2009. RhoA regulates G1-S progression of gastric cancer cells by modulation of multiple INK4 family tumor suppressors. Mol. Cancer Res. 7:570–580. 10.1158/1541-7786.MCR-08-0248 [DOI] [PubMed] [Google Scholar]
- 46.Siew V-K, Duh C-Y, Wang S-K. 2009. Human cytomegalovirus UL76 induces chromosome aberrations. J. Biomed. Sci. 16:107. 10.1186/1423-0127-16-107 [DOI] [PMC free article] [PubMed] [Google Scholar]
- 47.Isomura H, Stinski MF, Murata T, Nakayama S, Chiba S, Akatsuka Y, Kanda T, Tsurumi T. 2010. The human cytomegalovirus UL76 gene regulates the level of expression of the UL77 gene. PLoS One 5:e11901. 10.1371/journal.pone.0011901 [DOI] [PMC free article] [PubMed] [Google Scholar]
- 48.Nascimento R, Dias JD, Parkhouse RME. 2009. The conserved UL24 family of human alpha, beta and gamma herpesviruses induces cell cycle arrest and inactivation of the cyclinB/cdc2 complex. Arch. Virol. 154:1143–1149. 10.1007/s00705-009-0420-y [DOI] [PubMed] [Google Scholar]
- 49.Costa H, Nascimento R, Sinclair J, Parkhouse RME. 2013. Human cytomegalovirus gene UL76 induces IL-8 expression through activation of the DNA damage response. PLoS Pathog. 9:e1003609. 10.1371/journal.ppat.1003609 [DOI] [PMC free article] [PubMed] [Google Scholar]
- 50.Lin S-R, Jiang MJ, Wang H-H, Hu C-H, Hsu M-S, Hsi E, Duh C-Y, Wang S-K. 2013. Human cytomegalovirus UL76 elicits novel aggresome formation via interaction with S5a of the ubiquitin proteasome system. J. Virol. 87:11562–11578. 10.1128/JVI.01568-13 [DOI] [PMC free article] [PubMed] [Google Scholar]
- 51.Ben Abdeljelil N, Rochette P-A, Pearson A. 2013. The UL24 protein of herpes simplex virus 1 affects the sub-cellular distribution of viral glycoproteins involved in fusion. Virology 444:263–273. 10.1016/j.virol.2013.06.021 [DOI] [PubMed] [Google Scholar]
- 52.Lymberopoulos MH, Bourget A, Ben Abdeljelil N, Pearson A. 2011. Involvement of the UL24 protein in herpes simplex virus 1-induced dispersal of B23 and in nuclear egress. Virology 412:341–348. 10.1016/j.virol.2011.01.016 [DOI] [PubMed] [Google Scholar]
- 53.Dargan DJ, Subak-Sharpe JH. 1997. The effect of herpes simplex virus type 1 L-particles on virus entry, replication, and the infectivity of naked herpesvirus DNA. Virology 239:378–388. 10.1006/viro.1997.8893 [DOI] [PubMed] [Google Scholar]
- 54.Urbanowski MD, Ilkow CS, Hobman TC. 2008. Modulation of signaling pathways by RNA virus capsid proteins. Cell Signal. 20:1227–1236. 10.1016/j.cellsig.2007.12.018 [DOI] [PMC free article] [PubMed] [Google Scholar]
- 55.Surjit M, Liu B, Chow VTK, Lal SK. 2006. The nucleocapsid protein of severe acute respiratory syndrome-coronavirus inhibits the activity of cyclin-cyclin-dependent kinase complex and blocks S phase progression in mammalian cells. J. Biol. Chem. 281:10669–10681. 10.1074/jbc.M509233200 [DOI] [PMC free article] [PubMed] [Google Scholar]
- 56.Schreiner S, Martinez R, Groitl P, Rayne F, Vaillant R, Wimmer P, Bossis G, Sternsdorf T, Marcinowski L, Ruzsics Z, Dobner T, Wodrich H. 2012. Transcriptional activation of the adenoviral genome is mediated by capsid protein VI. PLoS Pathog. 8:e1002549. 10.1371/journal.ppat.1002549 [DOI] [PMC free article] [PubMed] [Google Scholar]
- 57.Becker KA, Florin L, Sapp C, Sapp M. 2003. Dissection of human papillomavirus type 33 L2 domains involved in nuclear domains (ND) 10 homing and reorganization. Virology 314:161–167. 10.1016/S0042-6822(03)00447-1 [DOI] [PubMed] [Google Scholar]
- 58.Florin L, Schäfer F, Sotlar K, Streeck RE, Sapp M. 2002. Reorganization of nuclear domain 10 induced by papillomavirus capsid protein L2. Virology 295:97–107. 10.1006/viro.2002.1360 [DOI] [PubMed] [Google Scholar]
- 59.Chaurushiya MS, Weitzman MD. 2009. Viral manipulation of DNA repair and cell cycle checkpoints. DNA Repair (Amst.) 8:1166–1176. 10.1016/j.dnarep.2009.04.016 [DOI] [PMC free article] [PubMed] [Google Scholar]
- 60.Turnell AS, Grand RJ. 2012. DNA viruses and the cellular DNA-damage response. J. Gen. Virol. 93:2076–2097. 10.1099/vir.0.044412-0 [DOI] [PubMed] [Google Scholar]
- 61.Zhang J, Wang S, Wang K, Zheng C. 2013. Herpes simplex virus 1 DNA polymerase processivity factor UL42 inhibits TNF-α-induced NF-κB activation by interacting with p65/RelA and p50/NF-κB1. Med. Microbiol. Immunol. 202:313–325. 10.1007/s00430-013-0295-0 [DOI] [PubMed] [Google Scholar]
- 62.Kwon Y, Kim M-N, Young Choi E, Heon Kim J, Hwang E-S, Cha C-Y. 2012. Inhibition of p53 transcriptional activity by human cytomegalovirus UL44. Microbiol. Immunol. 56:324–331. 10.1111/j.1348-0421.2012.00446.x [DOI] [PubMed] [Google Scholar]
- 63.Dufour F, Sasseville AM-J, Chabaud S, Massie B, Siegel RM, Langelier Y. 2011. The ribonucleotide reductase R1 subunits of herpes simplex virus types 1 and 2 protect cells against TNF-α- and FasL-induced apoptosis by interacting with caspase-8. Apoptosis 16:256–271. 10.1007/s10495-010-0560-2 [DOI] [PubMed] [Google Scholar]
- 64.Patrone M, Percivalle E, Secchi M, Fiorina L, Pedrali-Noy G, Zoppé M, Baldanti F, Hahn G, Koszinowski UH, Milanesi G, Gallina A. 2003. The human cytomegalovirus UL45 gene product is a late, virion-associated protein and influences virus growth at low multiplicities of infection. J. Gen. Virol. 84:3359–3370. 10.1099/vir.0.19452-0 [DOI] [PubMed] [Google Scholar]
- 65.Lembo D, Donalisio M, Hofer A, Cornaglia M, Brune W, Koszinowski U, Thelander L, Landolfo S. 2004. The ribonucleotide reductase R1 homolog of murine cytomegalovirus is not a functional enzyme subunit but is required for pathogenesis. J. Virol. 78:4278–4288. 10.1128/JVI.78.8.4278-4288.2004 [DOI] [PMC free article] [PubMed] [Google Scholar]
- 66.Jung Y-S, Qian Y, Chen X. 2010. Examination of the expanding pathways for the regulation of p21 expression and activity. Cell. Signal. 22:1003–1012. 10.1016/j.cellsig.2010.01.013 [DOI] [PMC free article] [PubMed] [Google Scholar]
- 67.Li Y, Dowbenko D, Lasky LA. 2002. AKT/PKB phosphorylation of p21Cip/WAF1 enhances protein stability of p21Cip/WAF1 and promotes cell survival. J. Biol. Chem. 277:11352–11361. 10.1074/jbc.M109062200 [DOI] [PubMed] [Google Scholar]
- 68.Wang Z, Zhang Y, Gu JJ, Davitt C, Reeves R, Magnuson NS. 2010. Pim-2 phosphorylation of p21Cip1/WAF1 enhances its stability and inhibits cell proliferation in HCT116 cells. Int. J. Biochem. Cell Biol. 42:1030–1038. 10.1016/j.biocel.2010.03.012 [DOI] [PMC free article] [PubMed] [Google Scholar]
- 69.Rössig L, Badorff C, Holzmann Y, Zeiher AM, Dimmeler S. 2002. Glycogen synthase kinase-3 couples AKT-dependent signaling to the regulation of p21Cip1 degradation. J. Biol. Chem. 277:9684–9689. 10.1074/jbc.M106157200 [DOI] [PubMed] [Google Scholar]
- 70.Coleman ML, Marshall CJ, Olson MF. 2003. Ras promotes p21(Waf1/Cip1) protein stability via a cyclin D1-imposed block in proteasome-mediated degradation. EMBO J. 22:2036–2046. 10.1093/emboj/cdg189 [DOI] [PMC free article] [PubMed] [Google Scholar]
- 71.Caro E, Castellano MM, Gutierrez C. 2007. GEM, a novel factor in the coordination of cell division to cell fate decisions in the arabidopsis epidermis. Plant Signal. Behav. 2:494–495. 10.4161/psb.2.6.4579 [DOI] [PMC free article] [PubMed] [Google Scholar]