Abstract

13C NMR spectroscopic integration employing short relaxation delays was evaluated as a quantitative tool to obtain ratios of diastereomers, regioisomers, constitutional isomers, mixtures of unrelated compounds, peptoids, and sugars. The results were compared to established quantitative methods such as 1H NMR spectroscopic integration, gas chromatography, and high-performance liquid chromatography and were found to be within <3.4% of 1H NMR spectroscopic values (most examples give results within <2%). Acquisition of the spectra took 2–30 min on as little as 10 mg of sample, proving the general utility of the technique. The simple protocol was extended to include end group analysis of low molecular weight polymers, which afforded results in accordance with 1H NMR spectroscopy and matrix-assisted laser desorption-ionization time-of-flight spectrometry.
Determining product ratios is an important task in organic chemistry because reactions often give mixtures of products (e.g., diastereomers or regioisomers) that provide information about the relative rates of formation and energies of different products.11H NMR spectroscopy is particularly useful, because single pulse experiments (or spectra obtained using multiple scans with long delay times) give reliable integrations that are directly related to compound ratios.2 In some cases, however, peaks of two structurally related compounds can be difficult to resolve by 1H NMR spectroscopy.6 Other techniques, such as gas chromatography (GC) and high-performance liquid chromatography (HPLC), provide quantitative information, although the response factors of the detection methods must be considered.3−5 Separation of compounds by these techniques is not assured, and variation of chromatography columns can be resource-intensive (in both time and cost) and does not always lead to peak separation or reliable ratios.7−913C NMR spectroscopy can be used as a quantitative tool,10−14 but quantitative 13C NMR spectroscopy requires long relaxation delays, which can result in long acquisition times to achieve sufficient signal-to-noise ratios.
In this Letter, we demonstrate that proton-decoupled 13C NMR spectroscopy using only short delays between pulses provides a powerful technique for determining ratios between small molecules and for performing polymer end group analysis. Long delays are not required to obtain meaningful ratios provided certain precautions are taken. The 20-fold greater range of chemical shifts for 13C NMR spectroscopy compared to 1H NMR spectroscopy resolves resonances in 13C NMR spectra better than for 1H NMR spectroscopy, enabling analysis of product ratios that would not be possible otherwise. For analysis of small molecules, this technique can be employed using little material (typically ≤10 mg), providing reliable product ratios in <2 min using an instrument that operates at 400 MHz for 1H NMR spectroscopy. Generally, broadband decoupled 13C NMR spectra that are suitable for compound characterization can be used to obtain product ratios that are in agreement with ratios determined by other methods.
The advantage of analysis by 13C NMR spectroscopy is illustrated by the challenge of determining the diastereomeric ratios of diols 1, 2, and 3 (Scheme 1). While the 1H NMR spectra of diols 1 and 2 are resolvable and give diastereomeric ratios, the peaks assigned to the methyl groups at δ 1.5 ppm for diol 3 cannot be integrated because of signal overlap (Spectrum S-5 in the Supporting Information (SI)). GC of these similar diols yielded inconclusive results: the peaks assigned to the two diastereomers exhibited either no or poor resolution. In contrast, several resonances of the diols 1, 2, and 3 (Spectrum S-7 in the SI) were clearly resolved by 13C NMR spectroscopy. The peaks could be integrated if spectra were acquired using inverse-gated decoupling (IGD) pulse sequences with long relaxation delays (D1) between pulses (30 s) to minimize different nuclear Overhauser effects (NOEs) and longitudinal relaxation times.10,12,15−17 The resulting experiments, however, required several hours to obtain sufficient signal-to-noise that allowed for the integration of spectra. By contrast, the same product ratios could be obtained in minutes by integrating spectra obtained by standard broadband decoupled (BBD) experiments that had short delays (2 s between pulses).18 As long as equivalent resonances were compared, long relaxation delays were not required to obtain satisfactory product ratios. It was also not necessary to use inverse-gated decoupling: broad-band decoupled spectra with short delays gave nearly identical product ratios in approximately 1/15th of the time with better signal-to-noise.19 A comparison between different methods is shown in Table 1.
Scheme 1. Diols 1, 2, and 3.

Table 1. Diastereomeric Analysis of 2 by 1H and 13C NMR Spectroscopy.
| experimenta | mol % major diastereomer |
|---|---|
| 1H (1 scan) | 56.7 |
| 1H (16 scan) | 56.5 |
| 13C BBD (64 scan, 2 s D1) | 56.5 |
| 13C BBD (64 scan, 30 s D1) | 56.2 |
| 13C IGD (64 scan, 2 s D1) | 55.5 |
| 13C IGD (64 scan, 30 s D1) | 55.4 |
BBD = broadband decoupled, IGD = inverse-gated decoupled.
To integrate the spectra, we adhered to two important constraints: (1) integrations of carbon resonances of two different compounds would only be compared if the same number of hydrogen atoms were present (to minimize differences in NOE); (2) the ratios of integrals would be averaged over all the different carbon atoms (this constraint is similar to how one would integrate a 1H NMR spectrum).20
All spectra described in the contribution were deconvoluted to improve the quality of the integration. Deconvolution is a commonly used technique to decrease the subjectivity and increase the reliability of NMR spectral integrations.15,21 It is rapid and easily implemented, effectively generating a spectrum with a flattened baseline, which minimizes subjectivity during integration.10 Deconvolution is not necessary to obtain accurate 13C NMR integrations, but the ease of its application (automated on most instruments) is such that little additional expertise on the part of the experimenter is required.
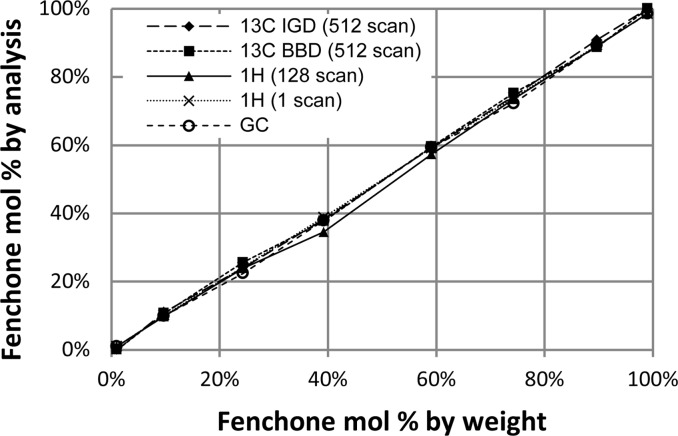
Quantitative 13C NMR spectroscopy employing short D1 values can also be used to analyze molecules with different connectivity. Analysis of the constitutional isomers camphor and fenchone was performed by 1H NMR spectroscopy, GC, and 13C NMR spectroscopy on samples with different ratios of the two terpenes. For one particular mixture, the speed and accuracy of 1H and 13C NMR spectroscopy were compared (Table 2). Using a sample that contained 10 mg of total sample, decoupled 13C NMR spectroscopy provided a ratio of products in <2 min that was virtually identical to the result obtained by single-pulse 1H NMR spectroscopy. There was no benefit to longer acquisition times for either spectroscopic technique. These techniques afforded comparable results for nearly all product ratios analyzed (Figure 1). Integration of 1H NMR spectra acquired with multiple scans and short relaxation delays gave the poorest results (Table 2 and Figure 1), likely because of selective saturation of nuclei.2 The mixtures containing fenchone in 1 and 99 mol % by weight yielded ratios of 100:0 and 0:100 rather than 99:1 and 1:99, respectively, by integration of 13C NMR spectra because the concentration of the minor component was below the detection limit of 13C NMR spectroscopy.
Table 2. Analysis of Camphor and Fenchone Mixtures Highlighting the Acquisition Time Required To Obtain 13C NMR Integration Data.

| experimenta | experiment duration (min) | mol % major component |
|---|---|---|
| 1H (1 scan) | 0.10 | 60.8 |
| 1H (128 scan) | 13 | 64.9 |
| 13C (16 scan) | 1.8 | 60.7 |
| 13C (512 scan) | 29 | 60.3 |
| 13C (8192 scan) | 456 | 59.7 |
1H and 13C NMR spectra were acquired with a 2 s D1 on a total sample of 10 mg. 13C NMR spectra were acquired using an IGD pulse program.
Figure 1.
Mixtures of fenchone and camphor analyzed by 1H and 13C NMR spectroscopy and GC for comparison.
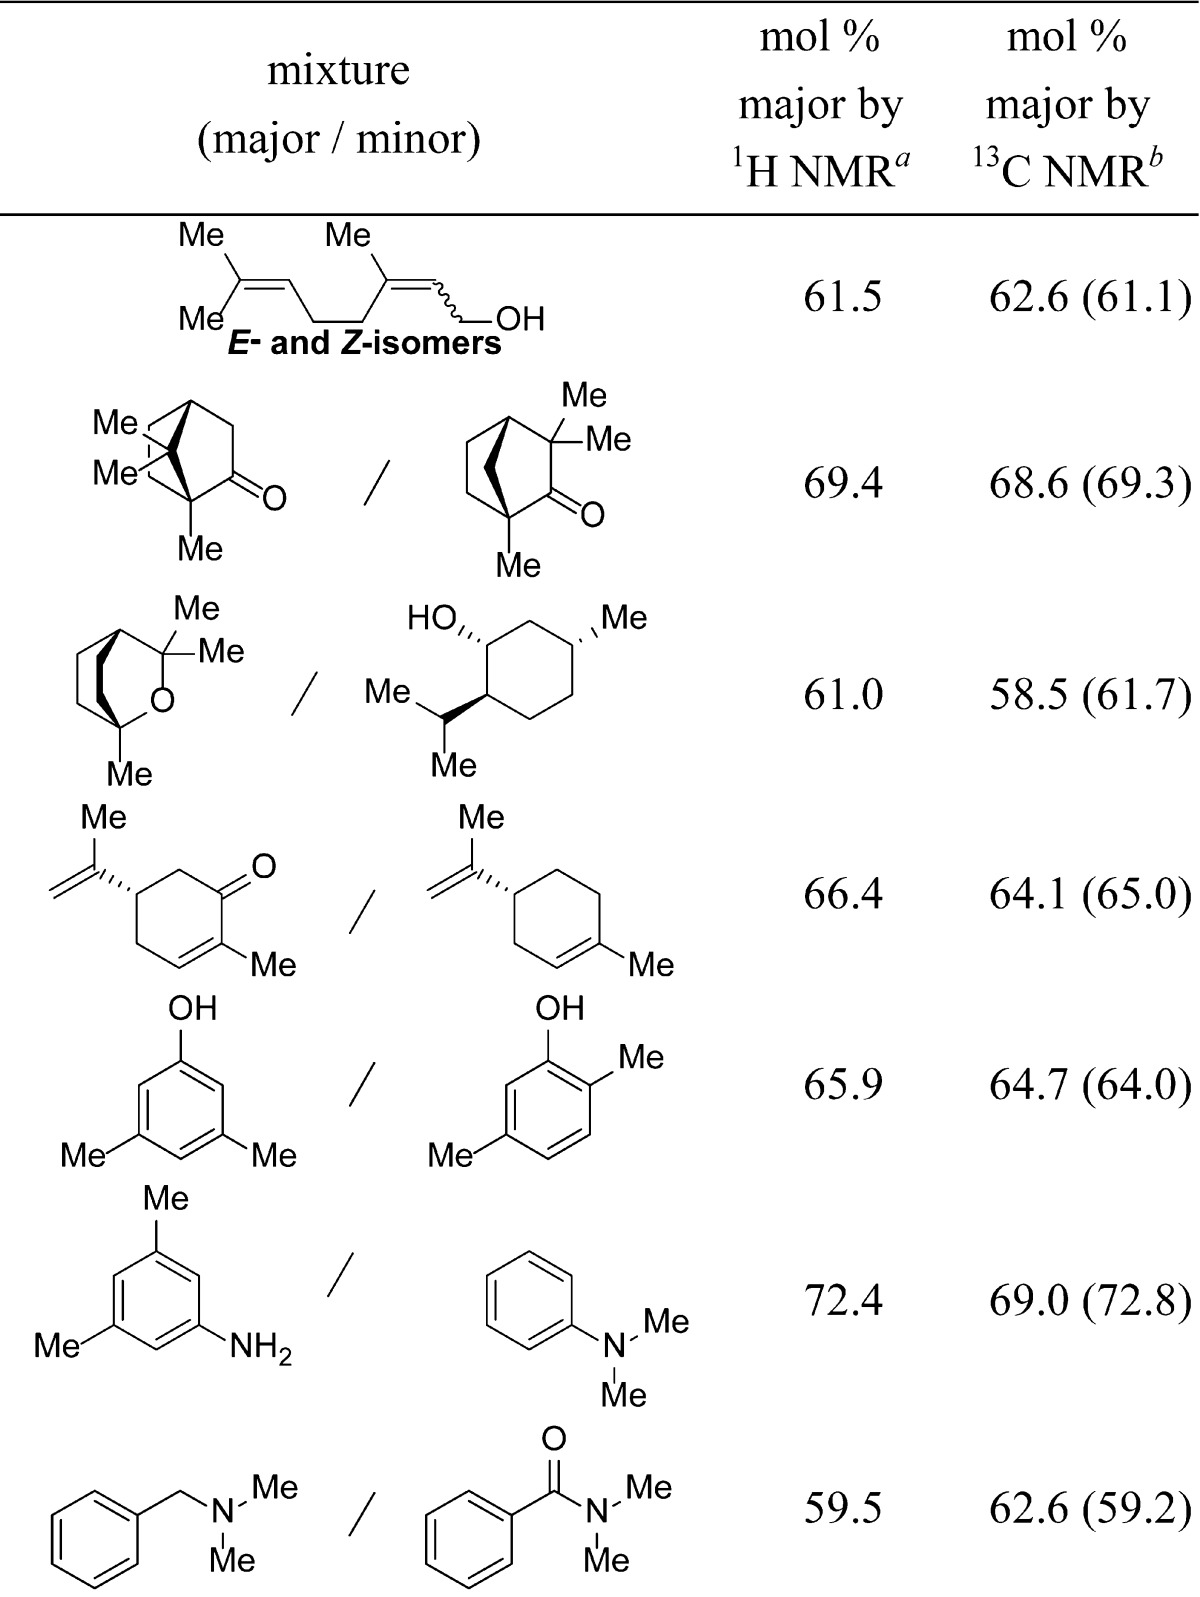
Integration of 13C NMR spectra acquired using short relaxation delays is applicable to a range of different structures (Tables 3 and 4). This technique was accurate to within <2.5% for sets of aliphatic compounds and cis-/trans-isomers. Aromatic compounds and those containing heteroatoms were analyzed accurately to within 3.4% of 1H NMR spectra integration (single pulse). Accuracy improved for both sets with longer D1 values of 30 s, although more significantly with molecules containing aromaticity or heteroatoms.
Table 3. Analysis of Mixtures of Molecules Comparing the Accuracy of 1H and 13C NMR Spectroscopy.

Single scan 1H NMR spectroscopy.
13C NMR spectroscopy using IGD pulse program with 10 mg of sample, 512 scans, and a 2 s D1. Values in parentheses employed a 30 s D1.
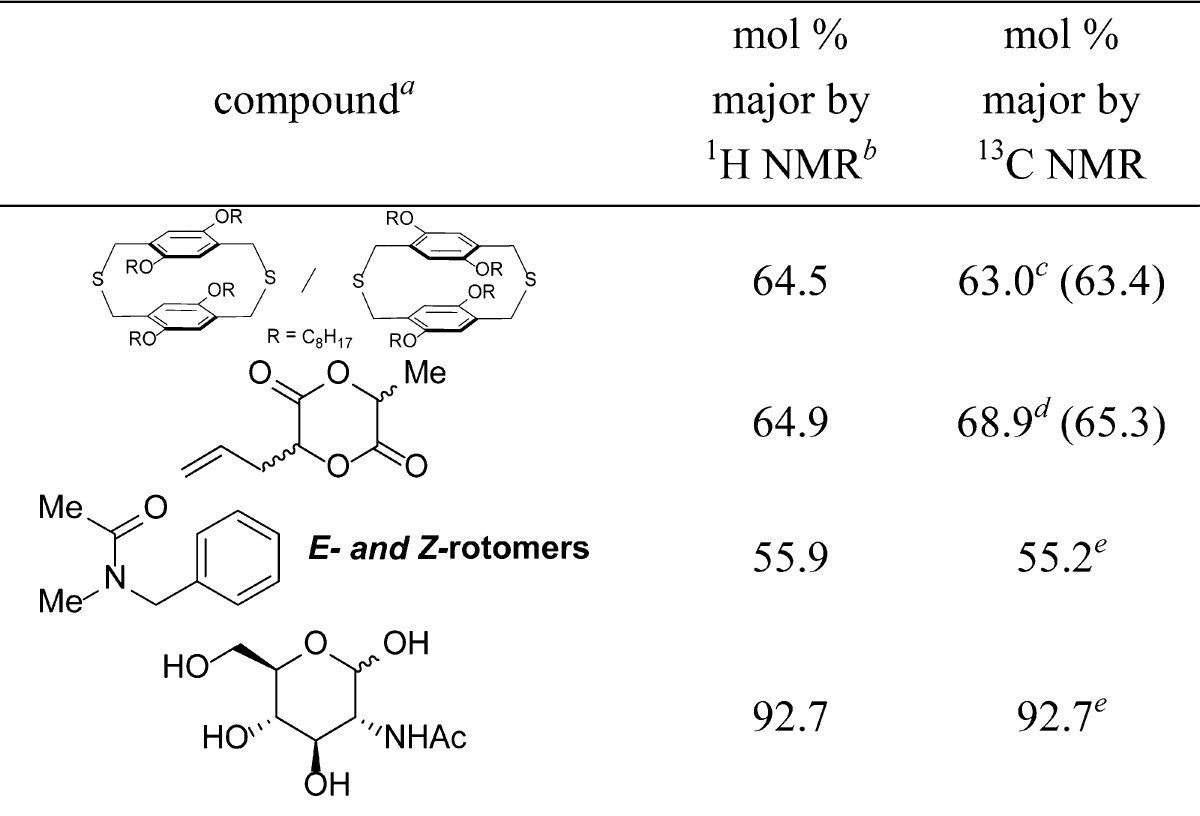
Table 4. Analysis of Paracyclophane Regioisomers, Allyl Lactide, Peptoid Rotamers, and Sugar Anomers.

10 mg of sample in total.
Single scan.
BBD, 512 scans, and 2 s D1.
BBD, 1024 scans, and 2 s D1.
BBD, 512 scans, and 2 s D1. Values in parentheses employed a 30 s D1.
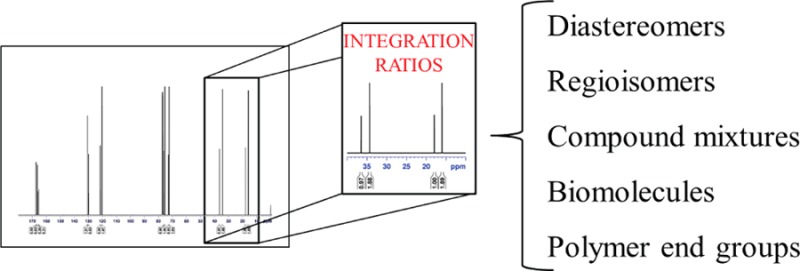
Quantitative 13C NMR analysis employing short relaxation delays can also be used for compounds of interest to materials scientists and chemical biologists (Table 4). Two regioisomers of a paracyclophane, which is an intermediate in the synthesis of conjugated polymers,22 were analyzed by 13C NMR spectroscopy, 1H NMR spectroscopy, and HPLC (Figure S-2 in the SI). Presumably due to the difference in extinction coefficients of the two regioisomers,22,23 the ratio found by HPLC differed the most from the value obtained by 1H NMR spectroscopy. The diastereomeric ratio of allyl lactide,24 with only one resolvable signal by 1H NMR spectroscopy, was determined by 13C NMR spectroscopy with eight resolvable signals (the deconvoluted 13C NMR spectrum is shown in the Table of Contents graphic). The knowledge about lactide stereochemistry is important to polymer chemists, because the tacticity of the resulting polymer determines its thermal properties and crystallinity.25 The ratio of cis- and trans-rotamers of a model peptoid26 was analyzed to assess the utility of 13C NMR integration in the field of peptoid chemistry,27 where conformation governs function. The calculated energy difference between the two amide rotamers determined by 13C and 1H NMR spectroscopy are within 0.03 and 0.01 kcal/mol, respectively, of the values reported in the literature.28 The anomeric ratio29 of carbohydrates can also be quantified by 13C NMR spectroscopy.
To address the lower accuracy observed with some molecules containing aromatic carbons (3.4%), we added a paramagnetic relaxation agent.11,13 For these studies, we employed a mixture of 3,5- and 2,5-dimethylphenol (Table 5). Relaxation agents reduce longitudinal relaxation times, therefore improving quantitative 13C NMR spectroscopic analysis.30−32 Oxygen (O2)33 was chosen to avoid sample contamination. Accuracy compared to 1H NMR spectroscopic integration improved from 2.5% to 0.7% when the sample was prepared from solvent that was saturated with O2 prior to sample preparation.
Table 5. Influence of O2 on the Accuracy of 13C NMR Spectroscopy.

| experimenta | mol % major |
|---|---|
| 1H (1 scan) with addition O2 | 69.2 |
| 1H (1 scan) without addition of O2 | 69.3 |
| 13C (64 scan)b with addition of O2 | 69.9 |
| 13C (64 scan)b without addition of O2 | 66.8 |
10 mg of sample.
BBD, 2 s D1.
13C NMR spectroscopic integration employing short relaxation delays can also be used to determine degrees of polymerization (DPs) in polymers.34 Polymers have been analyzed by quantitative solution 13C NMR spectroscopy with32 or without relaxation agents,15,35,36 in particular to gain insight into block copolymer composition,37 but rarely to determine DPs.11,15 The number average molecular weight is more commonly determined by 1H NMR spectroscopy,38 although spectral congestion can pose limitations. Other techniques to determine DP are matrix-assisted laser desorption–ionization time-of-flight spectrometry (MALDI-ToF)39 or size-exclusion chromatography (SEC).40 MALDI-ToF requires ionization of the polymer, which may lead to fragmentation.39 It also does not allow for sample recovery. SEC is an indirect method and inherently inaccurate for complex architectures such as brush copolymers and miktoarm polymers.40
Analysis of three model low molecular weight polymers demonstrated that quantitative 13C NMR spectroscopy with short delays could be used to analyze compounds of molecular weights up to 4000 Da. The model compounds were chosen to display end groups according to the polymer backbone signals of interest (Scheme 2) to avoid NOE differences.35,41,42 Quantitative analyses of poly(lactic acid) (PLA) samples with up to 30 repeat units, poly(4-methyl-oxazoline) (P(Ox)) samples with up to 20 repeat units, and a poly(norbornenyl octanoate) (P(NO)) with 17 repeat units were performed successfully without the addition of relaxation agents. The data are summarized in Table 6 and are in good agreement with 1H NMR end group analysis and MALDI-ToF spectrometry. 13C NMR spectra of P(Ox) also provide insight into the microstructure of the polymer in solution: distinct signals are observed for both cis- and trans-rotamers of the terminal monomer subunit.
Scheme 2. Structures of Polymers Analyzed in This Study.

Table 6. Analysis of Degree of Polymerization (DP) Comparing the Accuracy of MALDI-ToF, 1H NMR, and 13C NMR Spectroscopya.
| polymer | MALDI-ToF | 1H | 13Ca |
|---|---|---|---|
| PLA 1 | 27.9 | 27.0 | 27.3 |
| PLA 2 | 31.8 | 30.9 | 31.2 |
| P(Ox) 1 | 14.7 | 9.8 | 10.9 |
| P(Ox) 2 | 18.4 | 15.3 | 17.7 |
| P(NO) | 17.9 | 19.6 | 18.6 |
BBD, 2 s D1.
In summary, integration of 13C NMR spectra acquired with short relaxation delays is a convenient method for determination of compound ratios, and it complements other commonly used techniques, particularly in cases when these techniques are insufficient. 13C NMR integration employing short D1 values affords a greater spectral dispersion than 1H NMR spectroscopy and is quantitative as long as differences in NOEs and relaxation times are considered. Using standard pulse sequences, including broadband decoupling, 13C NMR spectroscopic techniques can be used to obtain accurate integration ratios in <0.5 h on as little as 100 μmol of sample. For both polymers and small molecules, the only limiting factor to this method is the signal-to-noise ratio if a species or end group is only present in an exceptionally low concentration.
Acknowledgments
This research was supported by the National Institutes of Health, National Institute of General Medical Sciences (GM-61066). The Bruker Avance-400 MHz NMR spectrometer was acquired through support of the National Science Foundation (CHE-01162222). The MALDI-ToF MS was acquired through the National Science Foundation (CHE-0958457). D.E.B. acknowledges the Margaret and Herman Sokol Fellowship. The authors thank Anderson J. Bonon, Dr. Elizabeth Elacqua, Dr. Angie Garcia, Jie Lu, and Dr. Elizabeth Valentín (NYU) for assistance.
Supporting Information Available
Experimental procedures, spectra, and compound characterization. This material is available free of charge via the Internet at http://pubs.acs.org.
The authors declare no competing financial interest.
Funding Statement
National Institutes of Health, United States
Supplementary Material
References
- Seeman J. I. Chem. Rev. 1983, 83, 83. [Google Scholar]
- Malz F.; Jancke H. J. Pharm. Biomed. Anal. 2005, 38, 813. [DOI] [PubMed] [Google Scholar]
- Boog-Wick K.; Pregosin P. S.; Trabesinger G. Organometallics 1998, 17, 3254. [Google Scholar]
- Venkatesan H.; Greenberg M. M. J. Org. Chem. 1995, 60, 1053. [DOI] [PubMed] [Google Scholar]
- Suzuki N.; Takemura A.; Miyamoto A.; Yoshioka T.; Tsutsumi S.; Kawasaki T. J. Pharm. Biomed. Anal. 2002, 30, 823. [DOI] [PubMed] [Google Scholar]
- Sun P.; Wang X.; Alquier L.; Maryanoff C. A. J. Chromatogr., A 2008, 1177, 87. [DOI] [PubMed] [Google Scholar]
- Antoine Lanfranchi D.; Tomi F.; Casanova J. Phytochem. Anal. 2010, 21, 597. [DOI] [PubMed] [Google Scholar]
- Weber B.; Maas B.; Mosandl A. J. Agric. Food Chem. 1995, 43, 2438. [Google Scholar]
- Dufrasne F.; Gelbcke M.; Galanski M. Spectrochim. Acta, Part A 2006, 65, 869. [DOI] [PubMed] [Google Scholar]
- Mareci T. H.; Scott K. N. Anal. Chem. 1977, 49, 2130. [Google Scholar]
- Shoolery J. N. Prog. Nucl. Magn. Reson. Spectrosc. 1977, 11, 79. [Google Scholar]
- Gillet S.; Delpuech J.-J. J. Magn. Reson. 1980, 38, 433. [Google Scholar]
- Cookson D. J.; Smith B. E. J. Magn. Reson. 1984, 57, 355. [Google Scholar]
- Caytan E.; Remaud G. S.; Tenailleau E.; Akoka S. Talanta 2007, 71, 1016. [DOI] [PubMed] [Google Scholar]
- Seger M. R.; Maciel G. E. Anal. Chem. 2004, 76, 5734. [DOI] [PubMed] [Google Scholar]
- Ericsson A.; Kowalewski J. J. Magn. Reson. 1980, 38, 9. [Google Scholar]
- Relaxation times for the carbon nuclei of camphor are less than 6 s (ref (16)). Therefore, a long D1 of 30 s (5 × T1) was initially chosen and, when appropriate for comparison purposes, maintained throughout this manuscript.
- For comparison purposes across data sets, relaxation delays were limited to either 2 s (short) or 30 s (long).
- The experiments reported in this paper use a 90° pulse in the carbon channel. Attempts to modify this pulse width to improve signal-to-noise led to no noticeable improvement. If the pulse width was too low (30°), however, the signal-to-noise decreased.
- A trend relating accuracy to degree of substitution of carbons (1° > 2° > 3° > 4°) was expected, but not observed. The gain in accuracy due to the increase in signal-to-noise for molecules with similar connectivity is more significant than the gain in accuracy due to elimination of NOE effects. In cases where connectivity was similar (i.e., diastereomers) broadband decoupling pulse programs yielded more accurate results than the inverse-gated decoupling pulse programs (Table 1)
- Belton P. S.; Wright K. M. J. Magn. Reson. 1986, 68, 564. [Google Scholar]
- Bazan G. C. J. Org. Chem. 2007, 72, 8615. [DOI] [PubMed] [Google Scholar]
- Elacqua E.; MacGillivray L. R. Eur. J. Org. Chem. 2010, 6883. [Google Scholar]
- Leemhuis M.; Akeroyd N.; Kruijtzer J. A. W.; van Nostrum C. F.; Hennink W. E. Eur. Polym. J. 2008, 44, 308. [Google Scholar]
- Martin O.; Avérous L. Polymer 2001, 42, 6209. [Google Scholar]
- Nishiwaki K.; Ogawa T.; Shigeta K.; Takahashi K.; Matsuo K. Tetrahedron 2006, 62, 7034. [Google Scholar]
- Yoo B.; Kirshenbaum K. Curr. Opin. Chem. Biol. 2008, 12, 714. [DOI] [PubMed] [Google Scholar]
- Gorske B. C.; Stringer J. R.; Bastian B. L.; Fowler S. A.; Blackwell H. E. J. Am. Chem. Soc. 2009, 131, 16555. [DOI] [PMC free article] [PubMed] [Google Scholar]
- Dondoni A.; Marra A. Chem. Rev. 2000, 100, 4395. [DOI] [PubMed] [Google Scholar]
- Kitagawa T.; Okazaki T.; Komatsu K.; Takeuchi K. J. Org. Chem. 1993, 58, 7891. [DOI] [PubMed] [Google Scholar]
- Okazaki T.; Terakawa E.; Kitagawa T.; Takeuchi K. J. Org. Chem. 2000, 65, 1680. [DOI] [PubMed] [Google Scholar]
- Rego R.; Adriaensens P. J.; Carleer R. A.; Gelan J. M. Polymer 2004, 45, 33. [Google Scholar]
- Prosser R. S.; Evanics F. In Modern Magnetic Resonance; Webb G., Ed.; Springer: Netherlands, 2006; p 475. [Google Scholar]
- Although the systems exhibit MW values of 1000–4000 Da, which is thought to be representative of oligomers, the DP values of up to 30 are consistent with polymers; thus, the method can be applied facilely to oligomers and low molecular weight polymers.
- Zhou Z.; Kümmerle R.; Qiu X.; Redwine D.; Cong R.; Taha A.; Baugh D.; Winniford B. J. Magn. Reson. 2007, 187, 225. [DOI] [PubMed] [Google Scholar]
- Merino E. G.; Atlas S.; Raihane M.; Belfkira A.; Lahcini M.; Hult A.; Dionísio M.; Correia N. T. Eur. Polym. J. 2011, 47, 1429. [Google Scholar]
- Qiu X.; Redwine D.; Gobbi G.; Nuamthanom A.; Rinaldi P. L. Macromolecules 2007, 40, 6879. [Google Scholar]
- Mirau P. A.A Practical Guide to Understanding the NMR of Polymers; John Wiley & Sons: Hoboken, NJ, 2005. [Google Scholar]
- Li Y.; Hoskins J. N.; Sreerama S. G.; Grayson M. A.; Grayson S. M. J. Mass Spectrom. 2010, 45, 587. [DOI] [PubMed] [Google Scholar]
- Berek D. J. Sep. Sci. 2010, 33, 315. [DOI] [PubMed] [Google Scholar]
- Schaefer J. Macromolecules 1973, 6, 882. [Google Scholar]
- Hatada K.; Kitayama T.; Terawaki Y.; Tanaka Y.; Sato H. Polym. Bull. 1980, 2, 791. [Google Scholar]
Associated Data
This section collects any data citations, data availability statements, or supplementary materials included in this article.


