Abstract
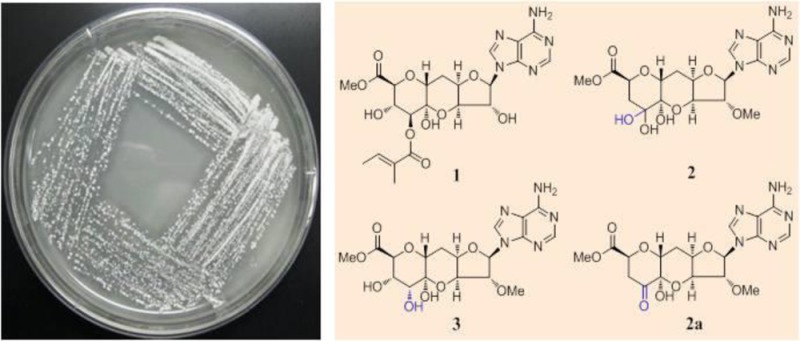
Four new undecose nucleosides (herbicidin congeners), three known herbicidins, and 9-(β-d-arabinofuranosyl)hypoxanthine (Ara-H) were isolated from the organic extract of a fermentation culture of Streptomyces sp. L-9-10 using proton NMR-guided fractionation. Their structures were elucidated on the basis of comprehensive 1D and 2D NMR and mass spectrometry analyses. These structures included 2′-O-demethylherbicidin F (1), 9′-deoxy-8′,8′-dihydroxyherbicidin B (2), 9′-deoxy-8′-oxoherbicidin B (2a), and the 8′-epimer of herbicidin B (3). This is the first detailed assignment of proton and carbon chemical shifts for herbicidins A, B, and F. The isolated compounds were evaluated for cancer chemopreventive potential based on inhibition of tumor necrosis factor alpha (TNF-α)-induced nuclear factor-kappa B (NF-κB) activity.
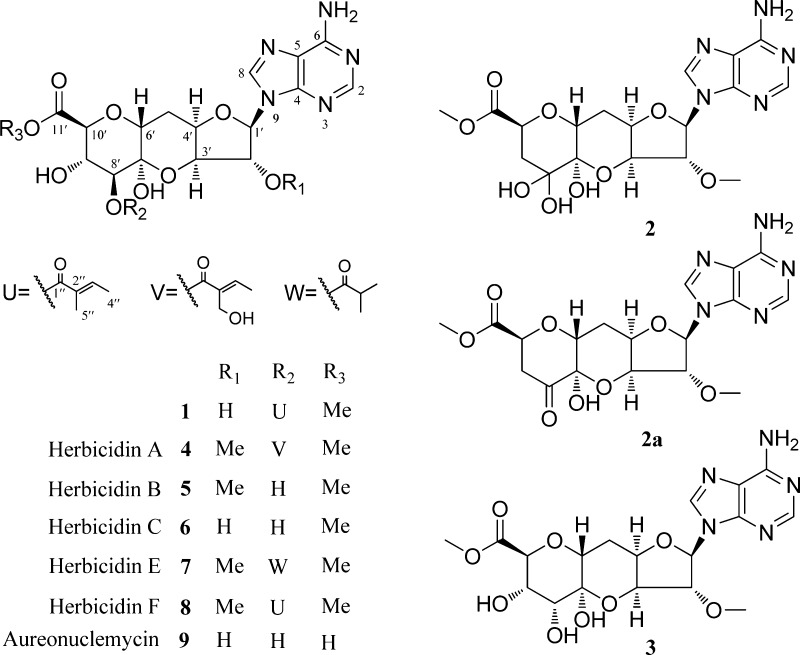
Actinomycetes represent a ubiquitous, dominant group of Gram-positive bacteria. In the past few decades studies of the bioactive metabolites isolated from Actinomycetes have demonstrated that these compounds are valuable leads for the development of new pharmaceutical agents.1,2 Herbicidins, adenine nucleoside antibiotics belonging to a chemical class of undecose (C11)-based nucleosides, have rarely been reported from natural sources. Since the original report of the herbicidin chemical scaffold from Streptomyces saganonensis in 1976,3 only 11 congeners have been discovered. These include herbicidins A–C (4–6), E (7), F (8), and G and H,3−7 S12245,8 antibiotic BE-65932,9 aureonucleomycin (9),10 and the synthetic 6′-epi-herbicidin B.11 Some of these naturally occurring nucleoside derivatives (4, 5, and 9) showed herbicidal and antialgal activities and significantly inhibited the growth of Xanthomonas oryzae, which causes rice leaf blight; they were also selectively toxic toward dicotyledons.10,11 In addition, the herbicidins have attracted considerable attention as synthetic targets due to their complex chemical structures. This unique nucleoside motif consists of a heterocyclic adenine base, an unusual undecose sugar moiety (consisting of a tricyclic furano-pyrano-pyran ring system), an internal hemiketal that links C-3′ and C-7′, and four substituents at the C-7′, C-8′, C-9′, and C-10′ positions on the pyran ring that are fixed in axial positions.12−18 The first total synthesis of herbicidin B (5) was accomplished in 1999 by Matsuda et al.,11 and the total syntheses of herbicidin C and aureonucleomycin were achieved in 2012 by Trauner et al.19
As part of our continuing search for novel bioactive molecules from terrestrial bacteria of the Actinomycetaceae family,20,21 we undertook an investigation of the organic extract of a fermentation culture of Streptomyces sp. L-9-10, a strain isolated from the lichen Platismatia glauca. The butanol-soluble extract of the culture inhibited hyphae formation in our hyphae formation inhibition (HFI) assay, which is a surrogate for kinase inhibition. During the search for active kinase inhibitors, a series of herbicidins were also isolated via an NMR-guided fractionation process. New herbicidin congeners, 2′-O-demethylherbicidin F (1), 9′-deoxy-8′,8′-dihydroxyherbicidin B (2) and its dehydrated product (2a), and the 8′-epimer of herbicidin B (3), were isolated from the broth and characterized spectroscopically. The known compounds herbicidins A (4), B (5), and F (8), along with the known 9-(β-d-arabinofuranosyl)hypoxanthine (Ara-H), were also isolated. We report herein the isolation, structure elucidation, and biological activities of herbicidins from Streptomyces sp. L-9-10.
Results and Discussion
The molecular formula of compound 1 was determined as C22H27N5O10 (12 degrees of unsaturation) by HRESIMS. Analysis of its 1H and 13C NMR spectra (Tables 1 and 2) and HSQC experiments revealed the presence of three methyl groups (including a methyl ester), one methylene, eight oxygenated methines, one sp3 oxygenated quaternary carbon (likely a hemiketal), six olefinic carbons, and two carbons for carboxylic acids or derivatives.
Table 1. 1H NMR Data (400 MHz, in CD3OD) of 1–5 and 8, δ in ppm and J in Hz.
| no. | 1 | 2a | 2aa | 3 | 4 | 5 | 8 |
|---|---|---|---|---|---|---|---|
| 2 | 8.23, s | 8.15, s | 8.19, s | 8.24, s | 8.23, s | 8.23, s | 8.23, s |
| 8 | 7.98, s | 8.60, s | 8.59, s | 8.17, s | 8.01, s | 8.70, s | 7.97, s |
| 1′ | 6.01, d (1.2) | 6.01, d (1.2) | 6.07, br s | 6.13, br s | 6.08, d (2.0) | 6.19, d (0.8) | 6.07, d (2.0) |
| 2′ | 4.41, br d (1.2) | 4.01, br d (1.2) | 3.79, br s | 4.23, br s | 4.08, d (1.2) | 4.01, br s | 4.08, d (2.0) |
| 3′ | 4.38, d (2.4) | 4.31, br s | 4.38, br s | 4.44, br d (2.4) | 4.52, br d (2.0) | 4.47, br d (2.4) | 4.51, br d (2.0) |
| 4′ | 4.52,b m | 4.35,c m | 4.41, m | 4.48, m | 4.43,f m | 4.45,d br d (2.4) | 4.41, q (2.4) |
| 5′ | 2.27, m | 1.98, m | 2.17, m | 2.28, dd (0.8, 11.2) | 2.28, m | 2.26, d br s (2.8, 9.2) | 2.28, m |
| 2.19, m | |||||||
| 6′ | 4.52,b t (8.0) | 4.35,c m | 3.43, m | 3.90, dd (4.2, 11.2) | 4.55, dd (6.4, 14.4) | 4.69, t (8.0) | 4.55, dd (6.4, 14.4) |
| 8′ | 5.01, d (3.2) | 3.60, d (3.6) | 5.09, d (3.2) | 3.74,e d (3.6) | 5.02, d (3.2) | ||
| 9′ | 4.34, dd (1.2, 3.2) | 2.32, dd (8.0, 13.6) | 2.60, d (14.4) | 4.35, dd (3.6, 1.6) | 4.36, dd (1.2, 3.2) | 4.37,d dd (3.6, 2.0) | 4.34, dd (1.2, 3.2) |
| 2.19, br d (13.6) | |||||||
| 10′ | 4.47, br s | 4.40, br d (7.2) | 4.98, d (8.4) | 4.56, br s | 4.49, br s | 4.39, br s | 4.48, br s |
| 3″ | 6.68, q (7.2) | 6.80, q (7.2) | 6.73, q (7.2) | ||||
| 4″ | 1.89, d (7.2) | 1.98, q (7.2) | 1.91, q (7.2) | ||||
| 5″ | 1.87, s | 4.43,f m | 1.89, s | ||||
| 2′-OCH3 | 3.37, s | 3.43, s | 3.49, s | 3.42, s | 3.48, s | 3.43, s | |
| 11′-OCH3 | 3.62, s | 3.58, s | 3.59, s | 3.74, s | 3.65, s | 3.74e | 3.63, s |
| 7′α-OH | 5.72, s | ||||||
| 8′α-OH | 5.97, s | ||||||
| 8′β-OH | 5.92, s |
Measured in DMSO-d6.
Signals with the same letter were partly overlapped.
Table 2. 13C NMR Data (100 MHz, in CD3OD) of 1–5 and 8, δ in ppm.
| no. | 1 | 2a | 2aa | 3 | 4 | 5 | 8 |
|---|---|---|---|---|---|---|---|
| 2 | 152.7, CH | 153.2, CH | 153.5, CH | 152.8, CH | 152.8, CH | 152.6, CH | 152.7, CH |
| 4 | 149.2, C | 149.5, C | 149.7, C | 149.1, C | 149.1, C | 148.9, C | 149.1, C |
| 5 | 118.3, C | 118.8, C | 118.5, C | 118.0, C | 118.1, C | 118.0, C | 118.0, C |
| 6 | 156.0, C | 156.5, C | 156.5, C | 155.9, C | 156.0, C | 155.8, C | 156.0, C |
| 8 | 139.2, CH | 140.7, CH | 138.9, CH | 139.0, CH | 139.5, CH | 141.0, CH | 139.5, CH |
| 1′ | 89.6, CH | 87.2, CH | 86.8, CH | 88.0, CH | 87.1, CH | 87.7, CH | 87.3, CH |
| 2′ | 81.0, CH | 90.8, CH | 89.7, CH | 89.5, CH | 90.3, CH | 90.8, CH | 90.3, CH |
| 3′ | 76.4, CH | 73.0, CH | 72.7, CH | 72.5, CH | 73.1, CH | 72.4, CH | 73.2, CH |
| 4′ | 77.5, CH | 77.8, CH | 77.5, CH | 78.4, CH | 77.7, CH | 78.3, CH | 77.5, CH |
| 5′ | 25.3, CH2 | 26.4, CH2 | 25.5, CH2 | 25.0, CH2 | 25.1, CH2 | 25.0, CH2 | 25.2, CH2 |
| 6′ | 65.2, CH | 66.3, CH | 57.9, CH | 69.6, CH | 65.1, CH | 64.1, CH | 65.2, CH |
| 7′ | 91.8, C | 94.5, C | 94.1, C | 94.2, C | 92.0, C | 93.3, C | 91.9, C |
| 8′ | 70.5, CH | 92.6, C | 200.5, C | 68.4, CH | 70.5, CH | 69.9, CH | 70.5, CH |
| 9′ | 69.0, CH | 38.4, CH2 | 40.6, CH2 | 70.7, CH | 69.2, CH | 73.0, CH | 69.1, CH |
| 10′ | 76.9, CH | 71.0, CH | 74.6, CH | 79.0, CH | 76.9, CH | 76.6, CH | 76.9, CH |
| 11′ | 169.8, C | 172.3, C | 170.9, C | 169.9, C | 170.0, C | 170.4, C | 169.8, C |
| 1″ | 165.8, C | 164.7, C | 165.7, C | ||||
| 2″ | 129.6, C | 131.1, C | 127.0, C | ||||
| 3″ | 140.4, CH | 144.3, CH | 140.3, CH | ||||
| 4″ | 13.6, CH3 | 13.7, CH3 | 13.7, CH3 | ||||
| 5″ | 10.9, CH3 | 54.9, CH2 | 10.9, CH3 | ||||
| 2′-OCH3 | 57.9 | 58.0 | 57.1 | 56.9 | 57.0 | 56.9 | |
| 11′-OCH3 | 51.3 | 51.7 | 52.7 | 51.4 | 51.4 | 50.9 | 51.3 |
Measured in DMSO-d6.
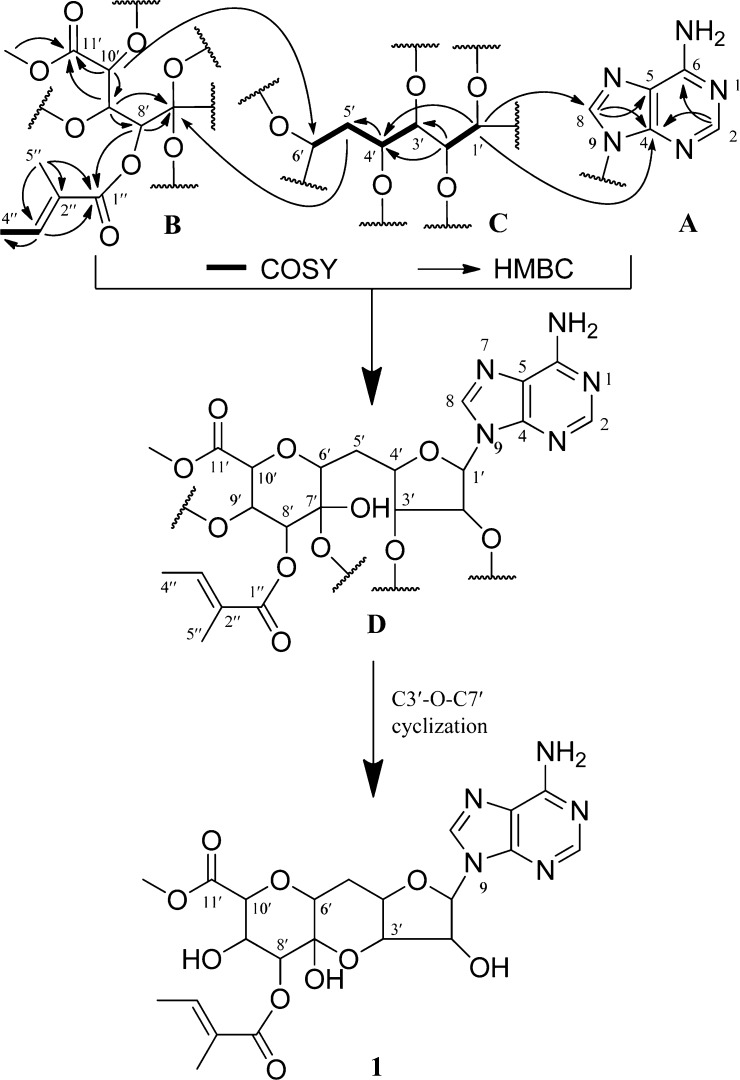
The 1H NMR data (Table 1) recorded in methanol-d4 showed two singlet peaks at δH [7.98 (1H, s, H-8) and 8.23 (1H, s, H-2)], which in conjunction with the five nitrogen atoms deduced by HRESIMS suggested the presence of an adenine unit (fragment A) in 1 (Figure 1). This conclusion was further supported by the HMBC correlations that were observed from H-8 to C-4/C-5 and from H-2 to C-4/C-6. A second subunit (fragment B) was assembled based on analysis of the COSY spectrum, which connected an olefinic proton that resonated at δH 6.68 (1H, q, J = 7.2 Hz, H-3″) with a methyl doublet at δH 1.89 (3H, d, J = 7.2 Hz, H3-4″). The HMBC correlations observed from H-3″ to C-4″/C-1″ and from H3-5″ to C-2″/C-3″/C-1″ in the HMBC experiments suggested a 2-methyl-2-butenoic (tiglic) group was present in 1. A methyl ester was deduced from the 13C NMR resonances at δ 169.8 (C-11′) and 51.3 (11′-OCH3) and the HMBC correlation from 11′-OCH3 (δH 3.62) to C-11′. Connections of the tiglic and methoxycarboxyl groups were established through analysis of the HMBC experiments. The HMBC correlations from H-8′ to C-7′ (the quaternary hemiketal carbon) and C-1″ indicated the tiglic group was attached at the C-8′ position (Figure 1). This carbon (C-8′) could then be connected to the carbonyl C-11′ through a series of HMBC correlations: H-9′ to C-8′, C-7′, and C-11′; H-10′ to C-9′ and C-11′. Fragment C was deduced as follows. The COSY data contained cross-peaks consistent with the connections of H-1′–H-2′ and H-3′–H-6′. This information, in combination with the HMBC correlations from H-1′ to C-2′, C-3′, and C-4′ and from H-2′ to C-3′ and C-4′ suggested the presence of fragment C (Figure 1). These three fragments were then assembled into a larger structure that fulfilled most of the structural requirements. The observed HMBC cross-peaks of H-1′ to C-4/C-8 suggested fragments A and C were connected at C-1′ of the adenine residue through an N–C glycosidic bond. The HMBC correlations from both H-5′ and H-6′ to C-7′ revealed a direct C-6′/C-7′ linkage, and the HMBC correlation from H-1′ to C-4′ demonstrated the presence of a furan ring, while the HMBC correlation from H-10′ to C-6′ established the linkage of C-6′ and C-10′ via an ether bond to give a pyran ring (Figure 1). The above assignments accounted for 11 out of the 12 degrees of unsaturation. Therefore, one more ring was required to complete a planar structure. In principle, three possible cyclic hemiketal structures could be generated: C2′–O–C7′, C3′–O–C7′, and C9′–O–C7′. After carefully checking the literature and comparing our NMR spectroscopic data to those reported for herbicidin F (8), we concluded 1 had a C3′–O–C7′ linkage due to the similarity of the NMR data. The only difference between the two was the replacement of the 2′-OCH3 in 8 with 2′-OH in 1.
Figure 1.
Selected HMBC and COSY correlations of 1.
The physicochemical analyses and the key NOESY correlations from H-8 to H-2′/H-3″, from H-3″ to H-6′/11′-OCH3, and from H-1′ to H-3′/H-4′ (Figure 2) of 1 supported the same relative configuration compared to those of herbicidins B (5)11 and G.7 On the basis of these data, the structure of 1 was determined to represent a new compound and was named 2′-O-demethylherbicidin F.
Figure 2.
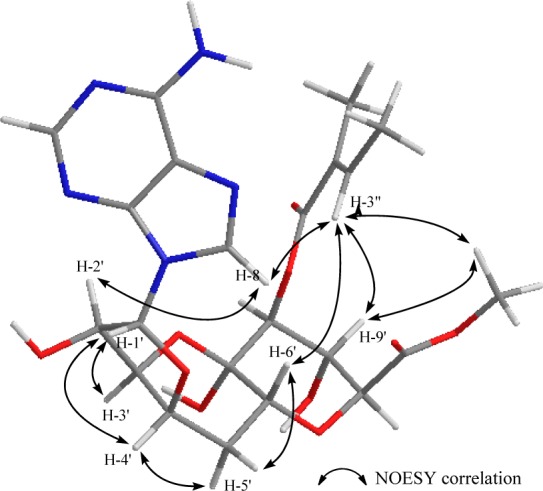
Selected NOESY correlations of 1.
Compound 2 was isolated as a white solid. Its molecular formula was determined as C18H23N5O9 on the basis of the HRESIMS data. Comparison of the 1H and 13C NMR data of 2 and 1 (Tables 1 and 2) indicated that they were very closely related analogues, differing only in the presence of an additional methoxy (δH 3.37; δC 57.9, 2′-OCH3), an oxygenated quaternary carbon (δC 92.6, C-8′), and a methylene [δH 2.32 (dd, J = 8.0, 13.6 Hz) and 2.19 (br d, J = 13.6 Hz)/δC 38.4 (C-9′)] in 2, instead of the tiglyl group at C-8′ and an oxygenated methine group at C-9′ found in 1. These conclusions were supported by the HMBC correlations from H-9′ to C-11′/C-8′/C-7′, of H-10′ to C-9′/C-6′, of 7′-OH (δH 5.72) to C-8′/C-6′, and of two OH protons (δH 5.92 and 5.97) to C-9′, demonstrating the unique substitution of an additional hydroxy group at C-8′ and a methylene functionality at the C-9′ position, respectively (Figure 3). The relative configuration of 2 was determined to be the same as in 1, after analyses of the 1H, 13C, and the NOESY NMR spectroscopic data, and the two hydroxy protons (δH 5.97 and 5.92) at C-8′ were determined to have α- and β-orientations, respectively, based on the NOESY correlations between 8′α-OH (δH 5.97) and 7′-OH (α axial) and between 8′-βOH (δH 5.92) and H-6′ (β axial) (Figure 3). Consequently, 2 was elucidated as a new compound and named 9′-deoxy-8′,8′-dihydroxyherbicidin B.
Figure 3.
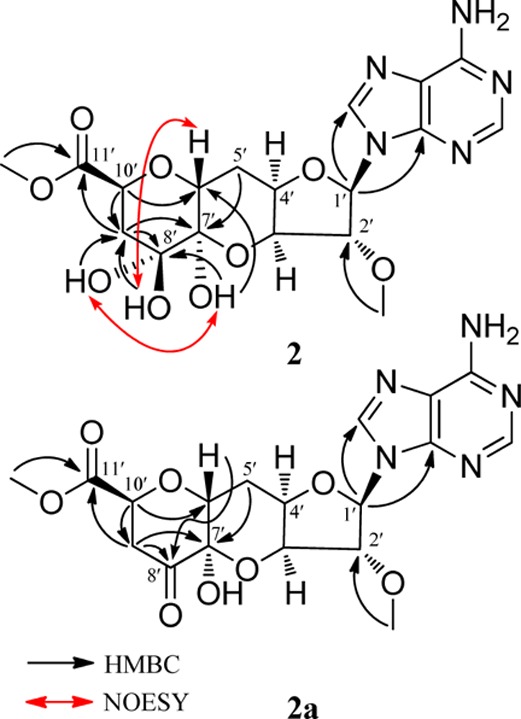
Key HMBC and NOESY correlations of 2 and 2a.
The tricyclic sugar moiety with the geminal dihydroxy functionality in 2 was also reported in other aminoglycoside antibiotics such as an adenylated spectinomycin analogue.22 As the presence of this C8′-geminal diol (a ketone hydrate) in 2 might affect its chemical stability, a set of NMR experiments was designed to monitor its stability. Proton and carbon NMR spectra were recorded at 1 day, 10 days, 20 days, and one month. Interestingly, based on the analysis of the NMR spectra, 2 was found to gradually convert to 2a. For example, after 10 days in DMSO-d6 at room temperature (20 °C), the NMR spectrum of 2 was rerecorded, and a second set of NMR signals was observed. This second set of signals (Figure S1; Supporting Information) was consistent with 2a, which would be derived from dehydration at C-8′ in 2. The result was further supported by data obtained in HSQC and HMBC experiments, as well as by HRESIMS, which showed a minor ion peak at m/z 436.1452 [M + H]+ (C18H22N5O8). In the HMBC spectrum, the key correlations from H-9′ to C-8′ (ketone group), C-11′ (ester carbonyl), and C-7′, from H-10′ to C-9′ and C-8′, and from H-6′ to C-8′, as well as of H-5′ to C-7′ were observed (Figure 3). Finally, the structure of compound 2a was elucidated and named 9′-deoxy-8′-oxoherbicidin B.
Compound 2 was further monitored using both 1H and 13C NMR every 10 days. The result was in agreement with the conclusion above. Almost 70% of 2 was converted to its analogue 2a after a month. It was not isolated.
Analysis of the HRESIMS and NMR data of 3 gave its molecular formula as C18H23N5O9. Comprehensive interpretation of NMR spectra demonstrated the structure of 3 was similar to herbicidin B (5) except for major chemical differences at C-6′, C-8′, and C-10′, which seem to be shifted by the anisotropic effect of the ester carbonyl group (C-11′) due to a change of configuration on the outer pyran ring. The analyses of NOESY spectra of 3 and 5 showed similar correlation peaks between H-8 and H-2′/H-6′. However, additional NOESY correlation peaks for 3 between H-8′ and H-6′/H-9′ and between H-8 and H-8′ revealed that H-8′ was β-oriented and that an α-hydroxy group was present at C-8. In addition, 3 shares the same configurations with 5 in the assignment of H-1′α, H-6′β, H-9′β, and H-10′α, which were supported by analyses of the NOESY correlations (Figure 4) and a comparison of their CD spectra (Figure 5), in which the same pattern of Cotton effects was observed. Subsequently, 3 was elucidated as an epimer of herbicidin B, named 8′-epi-herbicidin B.
Figure 4.
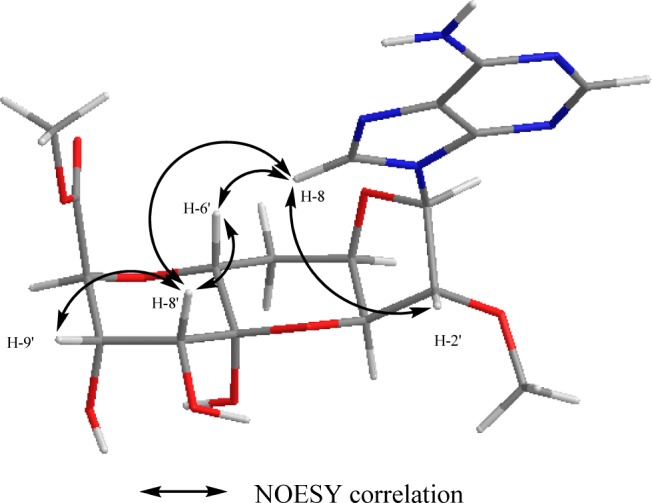
Key NOESY correlations of 3.
Figure 5.
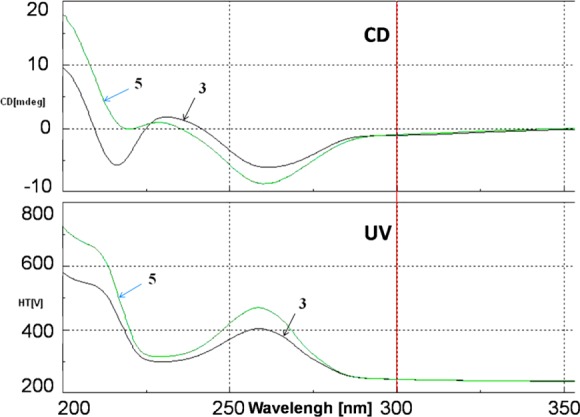
CD and UV spectra of 3 and 5 in MeOH.
In addition, three known herbicidins, A (4), B (5), and F (8),7 and 9-(β-d-arabinofuranosyl)hypoxanthine were identified by 1D and 2D NMR, ESIMS, and/or comparisons of their 1H NMR data with those in the literature.23,24 In particular for Ara-H, the NOESY correlation between H-8/H-3′ is shown in Figure S43, suggesting an α-orientation of 3′-OH, and it thus confirmed the existence of a d-arabinofuranosyl moiety in the structure.
Herbicidins represent a rare carbon skeleton due to the unusual undecose unit. Only 11 analogues have been reported so far. They are composed of an adenine, an undecose moiety connected by a β-glycosidic bond, a β-oriented H-6′, and hydroxy substitutions or oxygenation at nine of the 11 undecose backbone carbons. Their complex structures have made their structure elucidation and data assignment challenging, especially before the advent of 2D NMR techniques. Our work represents the first complete NMR assignment of the herbicidin family of natural products and the first isolation of a naturally occurring herbicidin with an 8′α-OH (3).
Compounds 2 and 2a, with partial structural similarity to spectinomycin and adenylated spectinomycin,22 are of special interest, as they are the first herbicidin analogues without a hydroxy substituent at the C-9′ position. The discovery of 2 led us to speculate the herbicidins may be formed in a biogenic pathway originally from adenosine and a deoxyhexose, possibly derived from glucose, as its nitrogen and carbon sources.
Compounds 1–5 and 8 were evaluated for their inhibitory activities against Streptomyces 85E in the HFI assay, according to an established protocol.21 However, this series of nucleoside antibiotics were inactive in the HFI assay. On the other hand, when evaluated in a mammalian cell-based assay designed to monitor TNF-α-induced NF-κB activity, 1–5 and 8 were found to mediate inhibitory responses with IC50 values in a range of about 0.5–4.9 μM (Table 3). With the exception of 5, when tested using the same conditions as the NF-κB assay, each of the remaining compounds mediated a cytotoxic response with IC50 values ranging from 2.2 to 43.7 μM (Table 3). In the absence of a cytotoxic response, inhibition of TNF-α-induced NF-κB activity suggests the potential of a cancer chemopreventative response. Thus, since 5 inhibits NF-κB with some specificity, it remains of interest as a cancer chemopreventative agent.
Table 3. Inhibitory Effect of Compounds 1–5 and 8 against TNF-α-Induced NF-κB Activity.
| compound | NF-κB % inhibitiona | NF-κB % survivalb | NF-κB IC50 (μM) | HEK293 cell line cytotoxicity IC50 (μM) |
|---|---|---|---|---|
| 1 | 92.4 ± 8.3 | 42.3 ± 3.9 | 4.9 ± 1.1 | 2.2 ± 0.7 |
| 2 | 96.2 ± 4.9 | 45.1 ± 5.7 | 2.4 ± 0.9 | 13.7 ± 3.3 |
| 3 | 92.2 ± 2.8 | 53.0 ± 3.9 | 3.2 ± 0.6 | 43.7 ± 3.9 |
| 4 | 80.9 ± 5.2 | 45.8 ± 2.9 | 1.8 ± 0.3 | 2.7 ± 1.3 |
| 5b | 94.2 ± 1.6 | 95.6 ± 6.6 | 2.9 ± 0.8 | >50 |
| 8 | 83.4 ± 3.3 | 59.8 ± 8.0 | 0.5 ± 0.1 | 2.3 ± 0.8 |
| TPCKc | 3.8 ± 0.9 | 11.1 ± 1.6 | ||
| BAY-11c | 2.0 ± 0.4 | 3.8 ± 1.5 |
% inhibition of NF-κB at 50 μM.
% survival at a concentration of 50 μM.
Positive control for NF-κB.
It is also of interest to compare the inhibitory responses of the remaining compounds with growth inhibitory activity. As shown with the positive control compounds selected for this investigation (TPCK and BAY-11), NF-κB is inhibited in the low micromolar range, but growth inhibition is observed with concentrations only 2 to 4 times higher. A similar response pattern was observed with 2, 3, 4, and 8, with NF-κB and growth inhibitory potency roughly equivalent to the positive control compounds. Compound 1 was an exception since the growth inhibitory response was mediated with lower concentrations than the NF-κB inhibitory response , so we can suggest that NF-κB inhibition was due to cytotoxic effect of compound 1. All the compounds failed to show any inhibitory effect against inducible nitric oxide synthase (iNOS) or antioxidant activity with DPPH (data not shown). In addition, growth inhibitory activity was not observed with the hormone-responsive breast cancer cell line MCF-7 (data not shown). Thus, the effect of these herbicidins on NF-κB appears somewhat unique and worthy of further investigation.
In summary, a 1H NMR-guided fractionation of the culture extract of terrestrial Streptomyces sp. L-9-10 led to the isolation and elucidation of three new herbicidin congeners, one epimer of known herbicidin B, and three known analogues as well as 9-(β-d-arabinofuranosyl)hypoxanthine. Moreover, this work represents the first report of the complete NMR assignments for the herbicidins and the first report on the isolation of an 8′α-OH herbicidin from nature. Biological testing showed that the herbicidins exhibited modest inhibition against TNF-α-induced NF-κB activity. Further work will be performed to design and develop novel herbicidin analogues with potential improved efficacy and selectivity.
Experimental Section
General Experimental Procedures
Specific rotations were recorded on an Autopol IV automatic polarimeter. UV spectra were measured on a Shimadzu PharmaSpec-1700 UV–visible spectrophotometer. CD spectra were measured on a JASCO J-810 spectropolarimeter. IR spectra were measured on a Bruker Tensor-27 spectrometer. 1D and 2D NMR spectra were recorded on Bruker AVANCE (400 MHz) and INOVA Unity (500 MHz) Varian spectrometers. Mass spectra and high-resolution MS spectra were obtained with a BioTOF II ESI mass spectrometer. Semipreparative HPLC was conducted on a Beckman Coulter Gold-168 system equipped with a photodiode array detector using an Alltech reversed-phase Econosil C18 column (10 μm, 10 × 250 mm) with a flow rate of 2.0 mL/min. Column chromatography was carried out on Merck silica gel 60 (70–230 mesh) and preparative TLC plates (0.2 × 20 × 20 cm). Precoated plates of silica gel 60 F254 were used for analytical purposes.
Microbial Material and Sample Collection
The organism was isolated from the surface of the lichen Platismatia glauca growing on a Douglas fir in the Arboretum at the University of British Columbia Malcolm Knapp Research Forest, Maple Ridge, British Columbia, in February 2003. The strain was isolated using ISP#4 (International Streptomyces Project 4, inorganic salts starch agar) media plates supplemented with 50 μg/mL cycloheximide and 20 μg/mL nalidixic acid. The Streptomyces sp. L-9-10 is maintained in the laboratory collection at the University of British Columbia under the accession number DCA 2501. The strain shared >99% identity (835 base pairs of 836) with the partial 16S rRNA gene of an unpublished strain, Streptomyces sp. MJM9209 (accession GU296743, positions 24 to 858). Its sequence has been deposited in GenBank with the accession number KJ123644.
Culturing and Harvesting Streptomyces sp. L-9-10
The same method21 as previously described was used to culture and harvest Streptomyces sp. L-9-10. For detailed protocols, see the Supporting Information.
Extraction and Isolation
The fermentation broth (100 L) was centrifuged, and the supernatant was partitioned successively with n-hexane, EtOAc, and n-BuOH. The EtOAc-soluble partition exhibited inhibitory activity in the hyphae-formation assay, giving an 18 mm clear zone of inhibition at a concentration of 80 μg/disk. The EtOAc-soluble portion (25 g) of fermented Streptomyces sp. L-9-10 was subjected to silica gel CC (500 g, 400–600 mesh) and eluted with a gradient of CHCl3–MeOH (0:1–1:1) to afford 10 fractions, E1–E10. Fraction E4 (5.2 g), with a 17 mm clear zone of inhibition in the HFI assay, was separated using Sephadex LH-20 (280 g, MeOH) to afford six subfractions, E4a–E4f. Fraction E4d (1.2 g) was further purified by silica gel CC eluting with hexane–acetone (2:1) to obtain fractions E4d1–d7. Fraction E4d2 was further separated with silica gel CC eluting with CHCl3–MeOH (40:1) to obtain fractions E4d2a–d2g. Subfraction D2e (40 mg) was separated by preparative TLC (2.0 mm, 20 × 20 cm) using CHCl3–EtOH (5:1, Rf 0.6) to yield 8 (7.0 mg). Then 1H NMR-guided fractionation was used for fractions E5 and E6, which exhibited characteristic proton signals at δ 8.00 and 4.00 ppm in their 1H NMR spectra. Fraction E5 (3.6 g) was separated by Sephadex LH-20 (280 g, MeOH) to obtain seven subfractions (E5a–E5g). Fraction E5e (1.1 g) was further subjected to silica gel CC eluting with hexane–acetone (1:2) to yield the main portion, then by a preparative TLC (2.0 mm, 20 × 20 cm) purification using CHCl3–EtOH (5:1, Rf 0.4) to give 4 (13.5 mg). Fraction E6 (5.8 g) was subjected to silica gel CC eluting with EtOAc–EtOH (20:1–5:1) to obtain 12 subfractions (E6a–E6l). Fraction E6e was separated by Sephadex LH-20 (70 g, MeOH) to give four fractions (e1–e4). Fraction E6e4 was applied to silica gel CC eluting with hexane–acetone (2:3) to obtain 1 (23 mg). Fraction E6i (0.8 g) was separated with Sephadex LH-20 (70 g, MeOH) to obtain four subfractions (E6i1–E6i4), and fraction E6i3 was repeatedly separated by reversed-phase HPLC eluting with MeOH–H2O (55:45) to afford 2 (2.8 mg, tR 32.8 min), 3 (11.4 mg, tR 19.8 min), and 5 (27.8 mg, tR 24.2 min). Fraction E9 (2.2 g) was subjected to Sephadex LH-20 (280 g, MeOH) to yield four subfractions (E9A–D). Fraction E9C was applied to silica gel and eluted with CHCl3–MeOH (5:2) to afford crude Ara-H, which was purified by recrystallization from MeOH.
2′-O-Demethylherbicidin F (1):
white, amorphous solid; [α]D25 78.1 (c 0.032, MeOH); UV (MeOH) λmax (log ε) 212 (4.27), 259 (4.03) nm; IR (KBr) 3340, 3204, 2951, 1710, 1634, 1597, 1574, 1416, 1249, 1133, 1053, 1008, 970 cm–1; 1H and 13C NMR (CD3OD, 400/100 MHz) see Tables 1 and 2; HRESIMS m/z 522.1821 [M + H]+ (calcd for C22H28N5O10, 522.1836).
9′-Deoxy-8′, 8′-dihydroxyherbicidin B (2):
white solid; [α]D25 48.0 (c 0.050, MeOH); UV (MeOH) λmax (log ε) 210 (4.13), 259 (4.00) nm; IR (KBr) 3332, 3212, 2849, 1732, 1642, 1597, 1574, 1299, 1197, 1072, 1019, 948 cm–1; 1H and 13C NMR (DMSO-d6, 400/100 MHz) see Tables 1 and 2; HRESIMS m/z 454.1560 [M + H]+ (calcd for C18H24N5O9, 454.1574).
9′-Deoxy-8′-oxoherbicidin B (2a):
not formally isolated; 1H and 13C NMR (DMSO-d6, 400/100 MHz) see Tables 1 and 2; HRESIMS m/z 436.1452 [M + H]+ (calcd for C18H22N5O8, 436.1468).
8′-epi-Herbicidin B (3):
white, amorphous powder; [α]D25 9.4 (c 0.040, MeOH); UV (MeOH) λmax (log ε) 209 (4.44), 259 (4.05) nm; IR (KBr) 3396, 3193, 2951, 2921, 1729, 1638, 1597, 1249, 1057, 955 cm–1; CD (1.0, MeOH) λmax (Δε) 262 (−9.0), 216 (−5.5) nm; 1H and 13C NMR (CD3OD, 400/100 MHz) see Tables 1 and 2; HRESIMS m/z 454.1555 [M + H]+ (calcd for C18H24N5O9, 454.1574).
Herbicidin A (4):
white solid; [α]D25 58.3 (c 0.075, MeOH) [lit. [α]D 61.7 (c 1.0, MeOH)7]; 1H and 13C NMR (CD3OD, 400/100 MHz) see Tables 1 and 2.
Herbicidin B (5):
white, amorphous powder; [α]D25 55.0 (c 0.050, MeOH) [lit. [α]D 63.0 (c 1.0, MeOH)7]; CD (1.0, MeOH) λmax (Δε) 260 (−5.2), 218 (−0.5) nm; 1H and 13C NMR (CD3OD, 400/100 MHz) see Tables 1 and 2.
Herbicidin F (8):
white solid; [α]D25 75.0 (c 0.025, MeOH); 1H and 13C NMR (CD3OD, 400/100 MHz) see Tables 1 and 2.
Tumor Necrosis Factor (TNF-α)-Induced Nuclear Factor-Kappa B (NF-κB) Assay
We employed human embryonic kidney cells 293 Panomic for monitoring changes occurring along the NF-κB pathway.27 Stable constructed cells were seeded into 96-well plates at 20 × 103 cells per well. Cells were maintained in Dulbecco’s modified Eagle’s medium (DMEM) (Invitrogen Co.), supplemented with 10% FBS, 100 units/mL penicillin, 100 μg/mL streptomycin, and 2 mM l-glutamine. After 48 h incubation, the medium was replaced and the cells were treated with various concentrations of test substances. TNF-α (human, recombinant, E. coli, Calbiochem) was used as an activator at a concentration of 2 ng/mL (0.14 nM). The plate was incubated for 6 h. Spent medium was discarded, and the cells were washed once with PBS. Cells were lysed using 50 μL (for 96-well plate) of reporter lysis buffer from Promega, by incubating for 5 min on a shaker, and stored at −80 °C. The luciferase assay was performed using the Luc assay system from Promega. The gene product, luciferase enzyme, reacts with luciferase substrate, emitting light, which was detected using a luminometer (LUMIstar Galaxy BMG). Data for NF-κB inhibition are expressed as IC50 values (i.e., concentration required to inhibit TNF-induced NF-κB activity by 50%). As a positive control, two known NF-κB inhibitors were used: TPCK and BAY-11.
The inhibition of hyphae-formation in Streptomyces 85E was performed on pure compounds as described previously.20
Acknowledgments
We thank Mr. T. Taylor for lichen collection and identification and H. Wang and V. Miao for assistance in strain isolation, identification, and testing. W. Yoshida (University of Hawai′i Manoa, Department of Chemistry) assisted with obtaining 500 MHz NMR NOESY measurements on the Varian Unity Inova. Financial support was obtained from UH Hilo CoP for start-up funding. This research was supported by NCI Program Project P01 CA 48112 (to J.P.). Work in the Davies laboratory was supported by the Canadian Institutes for Health Research. We thank Dr. A. Wright, Department of Pharmaceutical Sciences, College of Pharmacy, UHH, for the provision of the NMR spectroscopic facilities used in this study.
Supporting Information Available
Culturing and harvesting Streptomyces sp. L-9-10. The NMR spectra comparison for 2 and 2a. 1H and 13C NMR, DEPT, COSY, HSQC, HMBC, and NOESY data of compounds 1–5, 8, and Ara-H, as well as experimental data for the known compounds 4, 5, and 8. This material is available free of charge via the Internet at http://pubs.acs.org.
The authors declare no competing financial interest.
Funding Statement
National Institutes of Health, United States
Supplementary Material
References
- Deshpande B. S.; Ambedkar S. S.; Shewale J. G. Enzyme Microb. Technol. 1988, 10, 455–473. [Google Scholar]
- Demain A. L. Nat. Biotechnol. 2002, 20, 331. [DOI] [PubMed] [Google Scholar]
- Haneishi T. T. A.; Kayamori H.; Yabe J.; Arai M. J. Antibiot. 1976, 29, 870–875. [DOI] [PubMed] [Google Scholar]
- Arai M. H. T.; Kitahara N.; Enokita R.; Kawakubo K. J. Antibiot. 1976, 29, 863–869. [DOI] [PubMed] [Google Scholar]
- Takiguchi Y. Y. H.; Terahara A.; Torikata A.; Terao M. J. Antibiot. 1979, 32, 857–861. [DOI] [PubMed] [Google Scholar]
- Takiguchi Y. Y. H.; Terahara A.; Torikata A.; Terao M. J. Antibiot. 1979, 32, 862–867. [DOI] [PubMed] [Google Scholar]
- Terahara A. H. T.; Arai M.; Hata T.; Kuwano H.; Tamura C. J. Antibiot. 1982, 35, 1711–1714. [DOI] [PubMed] [Google Scholar]
- Tsuzuki M. S. G. Chem. Abstr. 1988, 109, 53206x. [Google Scholar]
- Nakase K. N. S.; Hirayama M.; Tanaka K.; Nagano R.; Kojiri K.; Suda H. Chem. Abstr. 1999, 132, 22203q. [Google Scholar]
- Dai X.; Li G.; Wu Z.; Lu D.; Wang H.; Li Z.; Zhou L.; Chen X.; Chen W. Chem. Abstr. 1989, 111, 230661f. [Google Scholar]
- Ichikawa S.; Shuto S.; Matsuda A. J. Am. Chem. Soc. 1999, 121, 10270–10280. [Google Scholar]
- Bearder J. R.; Dewis M. L.; Whiting D. A. J. Chem. Soc., Perkin Trans. 1 1995, 227–233. [Google Scholar]
- Fairbanks A. J.; Perrin E.; Sinay P. Synlett 1996, 679–681. [Google Scholar]
- Emery F.; Vogel P. J. Org. Chem. 1995, 60, 5843–5854. [Google Scholar]
- Emery F.; Vogel P. Tetrahedron Lett. 1993, 34, 4209–4212. [Google Scholar]
- Hayley M.; Binch A. M. G.; Timothy G. Pure Appl. Chem. 1996, 68, 589–592. [Google Scholar]
- Newcombe N. J.; Mahon M. F.; Molloy K. C.; Alker D.; Gallagher T. J. Am. Chem. Soc. 1993, 115, 6430–6431. [Google Scholar]
- Binch H. M.; Gallagher T. J. Chem. Soc., Perkin Trans. 1 1996, 401–402. [Google Scholar]
- Hager D.; Mayer P.; Paulitz C.; Tiebes J.; Trauner D. Angew. Chem., Int. Ed. 2012, 51, 6525–6528. [DOI] [PubMed] [Google Scholar]
- Cheenpracha S.; Zhang H.; Mar A. M. N.; Foss A. P.; Foo S. H.; Lai N. S.; Jee J. M.; Seow H. F.; Ho C. C.; Chang L. C. J. Nat. Prod. 2009, 72, 1520–1523. [DOI] [PubMed] [Google Scholar]
- Cheenpracha S.; Vidor N. B.; Yoshida W. Y.; Davies J.; Chang L. C. J. Nat. Prod. 2010, 73, 880–884. [DOI] [PubMed] [Google Scholar]
- Kim C.; Hesek D.; Zajíek J.; Vakulenko S. B.; Mobashery S. Biochemistry 2006, 45, 8368–8377. [DOI] [PubMed] [Google Scholar]
- Konstantinova I. D.; Antonov K.; Fateev I. V.; Miroshnikov A. I.; Stepchenko V. A.; Baranovsky A. V.; Mikhailopulo I. V. Synthesis 2011, 10, 1555–1560. [Google Scholar]
- Sun X. F.; Wang N.; Wu Q.; Lin X. F. Biotechnol. Lett. 2004, 26, 1019–1022. [DOI] [PubMed] [Google Scholar]
- Kondratyuk T. P.; Park E. J.; Yu R.; Van Breemen R. B.; Asolkar R. A.; Murphy B. T.; Fenical W.; Pezzuto J. M. Mar. Drugs 2012, 10, 451–464. [DOI] [PMC free article] [PubMed] [Google Scholar]
Associated Data
This section collects any data citations, data availability statements, or supplementary materials included in this article.


