

Abstract
Glycosylation plays an important role in epithelial cancers, including pancreatic ductal adenocarcinoma. However, little is known about the glycoproteome of the human pancreas or its alterations associated with pancreatic tumorigenesis. Using quantitative glycoproteomics approach, we investigated protein N-glycosylation in pancreatic tumor tissue in comparison with normal pancreas and chronic pancreatitis tissue. The study lead to the discovery of a roster of glycoproteins with aberrant N-glycosylation level associated with pancreatic cancer, including mucin-5AC (MUC5AC), carcinoembryonic antigen-related cell adhesion molecule 5 (CEACAM5), insulin-like growth factor binding protein (IGFBP3), and galectin-3-binding protein (LGALS3BP). Pathway analysis of cancer-associated aberrant glycoproteins revealed an emerging phenomenon that increased activity of N-glycosylation was implicated in several pancreatic cancer pathways, including TGF-β, TNF, NF-kappa-B, and TFEB-related lysosomal changes. In addition, the study provided evidence that specific N-glycosylation sites within certain individual proteins can have significantly altered glycosylation occupancy in pancreatic cancer, reflecting the complexity of the molecular mechanisms underlying cancer-associated glycosylation events.
Keywords: pancreatic cancer, proteomics, glycoproteomics, glycosylation, glycoprotein, pancreatitis, mass spectrometry, pancreas, glycosylation site occupancy
Introduction
Pancreatic cancer is a highly lethal disease that is difficult to detect in an early stage.1 While surgical resection offers the only chance for improved survival for the ∼20% of pancreatic cancer patients with resectable disease, there is a lack of effective treatment options for the majority of patients who are diagnosed in a late stage with locally advanced tumor or metastatic disease.2,3 One approach for developing better diagnostic and therapeutic strategies involves targeting cancer-associated aberrant glycosylation. As one of the most common protein post-translational modifications (PTMs), the glycoproteome of the human pancreas and its mechanistic roles in the pathogenesis of pancreatic cancer have not yet been fully elucidated. In fact, limited information is available describing the glycoproteome in normal pancreas and even less in pancreatic cancer. Protein glycosylation plays a crucial role in many biological functions, including immune response and cellular regulation.4,5 The glycosylation form and density of glycans on specific glycosylation sites within a protein can be significantly altered due to changes in cellular physiology resulting from disease, such as malignancy. For many epithelial cancers, including pancreatic ductal adenocarcinoma (PDAC), aberrant glycosylation has long been recognized as a molecular feature of malignant transformation.6−9 CA19-9, which detects the epitope of sialyl Lewis(a) on mucins and other adhesive molecules, is currently the best known clinical blood biomarker for pancreatic cancer.10 Tumor-specific glycoproteins, such as the well-studied mucins (MUCs) and carcinoembryonic antigen-related cell adhesion molecules (CEACAMs),11−15 are actively involved in neoplastic progression and metastasis of pancreatic cancer.
The efficiency of glycan attachment on N-glycosylation sites can vary with different biological conditions, resulting in variable site occupancy.16,17 Recent proteomics investigations of glycoproteins associated with pancreatic cancer have focused on discovering altered glycan structures in blood.18−21 These observations in serum or plasma may reflect an abnormal glycoproteome in pancreatic tumor tissue; that is, the glycoproteins that are secreted from pancreatic tumor cells into the circulation system may have abnormal glycosylation resulting from malignancy compared with normal cells.
In this study, we applied a global, quantitative glycoproteomics approach to investigate the N-glycoproteome of pancreatic tumor tissues. We discovered changes in N-glycosylation level that were specific to certain proteins and glycosylation sites in pancreatic cancer, implying complex molecular mechanisms in cancer-associated glycosylation pathways. The new biological evidence and hypothesis provided by this study may help to shed light on the molecular mechanisms underlying glycosylation events in pancreatic tumorigenesis, which in turn may be of clinical utility for diagnosis and treatment of this deadly disease.
Materials and Methods
Patients and Specimens
This study was approved by the Institutional Review Board at the University of Washington (Seattle, WA). The IRB approval was obtained with a waiver of informed consent. Pancreatic tissue specimens were collected from six patients with PDAC, six patients with chronic pancreatitis (CP), and five nondiseased controls (NL). For each study category, the pooled samples were generated by pooling an equal amount of specimens from the patients included in the study. Two quantitative glycoproteomics experiments were performed to identify differential glycosylation associated with PDAC and CP compared with NL, respectively, that is, PDAC versus NL and CP versus NL.
Lysates Preparation
Snap frozen tissue was homogenized in T-per (Thermo Scientific, Rockford, IL) with protease inhibitor and incubated on ice for 15 min. To pellet any cell debris, the lysate was centrifuged at 13 000g for 15 min at 4 °C. The supernatant was transferred into a new tube, and its concentration was measured by BCA assay (Pierce, Rockford, IL).
Sample Preparation
Each pooled lysate sample (1000 μg) was mixed with 50 μg of a glycoprotein standard (yeast invertase 2, heat treated at 90–95 °C for 10 min) (Sigma-Aldrich, St. Louis, MO), diluted in 50 mM ammonium bicarbonate solution, and reduced with dl-dithiothreitol (DTT) at 50 °C for 1 h. The samples were then alkylated with iodoacetamide at room temperature for 30 min in the dark. To purify the sample, we performed TCA precipitation by adding 1/4 volume of 100% w/v trichloroacetic acid. The samples were incubated on ice for 10 min and spun down at 14 000g for 5 min. Pellets were washed twice with ice-cold acetone and air-dried before resuspension in 300 μL of 50 mM sodium bicarbonate solution. Each lysate was digested with sequencing-grade trypsin (Promega, Madison, WI) with a 1:50 trypsin-to-sample ratio at 37 °C for 18 h.
Stable Isotopic Labeling
The digested samples were buffer-exchanged to 100 mM sodium acetate, pH 5.5. Equal amounts of control and diseased sample were separately labeled with formaldehyde-H2 (light) and formaldehyde-D2 (heavy) (Isotec, Champaign, Illinois), respectively. To label each sample, we added 5 μL of 20% labeling agent to a 100 μL sample, immediately followed by the addition of 5 μL of freshly prepared 3 M sodium cyanoborohydride solution. The samples were incubated for 15 min at room temperature, with vigorous vortex every few minutes. The light- and heavy-labeled samples were combined and purified through C18 purification columns (the Nest Group, Southborough, MA) following the manufacturer’s instructions.
Glycopeptide Enrichment with Hydrazide Beads
Peptides was resuspended in coupling buffer (100 mM sodium acetate, 150 mM sodium chloride, pH 5.6) and oxidized with sodium meta-periodate at the final concentration of 10 mM for 1 h at room temperature in the dark with gentle rotation. The excess sodium meta-periodate was quenched by the addition of sodium sulfite at the final concentration of 20 mM for 10 min at room temperature with gentle rotation. The sample was then combined with rinsed resin hydrazide beads (Thermo Scientific) and coupled at room temperature overnight (>10 h) with gentle rotation. After the coupling, beads were washed with 80% acetonitrile/0.1% trifluoroacetic acid (TFA) solution once, followed by five washes with phosphate-buffered saline (PBS). Beads were resuspended in PBS and incubated with PNGase F (New England BioLabs, Ipswich, MA) at 37 °C for 6 h with vortexing every 30 min. Cleaved glycopeptides were collected by centrifuging the sample at 1000g for 2 min and collecting the supernatant. Beads were washed once with fresh 250 μL of PBS to collect any remaining glycopeptides.
Mass Spectrometry Analysis
An LTQ-Orbitrap hybrid mass spectrometer (Thermo Fisher Scientific, Waltham, MA) coupled to a nanoflow HPLC (Eksigent Technologies, Dublin, CA) was used in this study. 2 μg of sample was injected for the mass spectrometric analysis. The samples were first loaded onto a 1.5 cm trap column (IntegraFrit 100 μm, New Objective, Woburn, MA) packed with Magic C18AQ resin (5 μm, 200 Å particles; Michrom Bioresources, Auburn, CA) with Buffer A (D.I. water with 0.1% formic acid) at a flow rate of 3 μL/minute. The peptide samples were then separated by a 27 cm analytical column (PicoFrit 75 μm, New Objective) packed with Magic C18AQ resin (5 μm, 100 Å particles; Michrom Bioresources), followed by mass spectrometric analysis. A 90 min LC gradient was used as follows: 5–7% Buffer B (acetonitrile with 0.1% formic acid) versus Buffer A over 2 min, then to 35% over 90 min. The flow rate for the peptide separation was 300 nL/min. For MS analysis, a spray voltage of 2.25 kV was applied to the nanospray tip. The mass spectrometric analysis was performed using data-dependent acquisition with a m/z range of 400–1800, consisting of a full MS scan in the Orbitrap followed by up to 5 MS/MS spectra acquisitions in the linear ion trap using collision-induced dissociation (CID). Other mass spectrometer parameters include: isolation width 2 m/z, target value 1e4, collision energy 35%, and max injection time 100 ms. Lower abundance peptide ions were interrogated using dynamic exclusion (exclusion time 45 s, exclusion mass width −0.55 m/z low to 1.55 m/z high). Charge-state screen was used, allowing for MS/MS of any ions with identifiable charge states +2, +3, and +4 and higher.
Data Analysis
Raw machine output files of MS/MS spectra were converted to mzXML files and searched with X!Tandem,22,23 against the human International Protein Index (IPI) database version 3.69 with the addition of yeast invertase 2. N-glycosylation can occur at asparagine residues in a protein sequence with unique consensus Asn-X-Ser/Thr sequence (NXT/S, X can be any amino acid except proline).24 The PNGase F enzymatic cleavage of N-glycans (except α1→3 linked core fucose25) converts asparagine into aspartic acid, introducing a mass difference of 0.9840 Da, which can be explicitly distinguished by high-resolution mass spectrometry and was used for N-glycosylation site identification. The search parameters were therefore as follows: enzyme: trypsin; maximum missed cleavages: 1; static modifications: carboxamidomethylation on cysteine, light dimethyl on N-terminus and lysine; dynamic modifications: oxidation on methionine, difference between light and heavy dimethyl labeled on N-terminus and lysine, enzymatic conversion of asparagine to aspartic acid; parent monoisotopic mass tolerance: 2.5 Da. Peptide identifications were assigned probability by PeptideProphet, which provides statistical validation of MS/MS search for peptide assignments.26 Relative quantitation of heavy and light peptide abundance was performed with Xpress27 version 2.1. Proteins present in sample were inferred using ProteinProphet.26
Periodic Acid Schiff Staining
Periodic Acid Schiff (PAS) staining was performed on 5 μm sections of paraffin-embedded PDAC tissue microarray (TMA) according to the manufacturer’s protocol (Abcam, Cambridge, MA) with minor modifications. In brief, the section was deparaffinized, followed by Periodic Acid Solution for 3 min, Schiff’s solution for 15 min, hematoxylin solution for 2 min, Bluing Reagent for 30 s, and Light Green Solution for 2 min. The Aperio ScanScope Systems (Aperio, Vista, CA) was used for visualization. The tissue cores (including normal pancreas, CP, PanINs, and PDAC) were scored blindly of the diagnosis using semiquantitative histoscores (range 0–300). Histoscores were the products of staining intensity (0–3) and the percentage of pancreatic cells (including ductal epithelial cells, acinar cells, stroma cells, and extracellular matrix) staining at that intensity (0–100). The histoscores reflect the overall staining of each core.
Real-Time PCR
HDF cells28 were a generous gift from Dr. Peter Rabinovitch (University of Washington, Seattle, WA). HPDE cells29 were provided by Dr. Ming-Sound Tsao (University of Toronto, Toronto, Ontario, Canada). All other cells were purchased from ATCC (Manassas, VA). Cells were cultured in complete media under standard conditions. HDF cells were treated with 5 ng/mL TGFβ1 for 4 days. Total RNA was isolated from cell pellets using the RNeasy Mini kit (Qiagen, Hilden, Germany) as per manufacturer’s instructions. 100 ng of input RNA was used for first-strand cDNA synthesis using the SuperScript III first strand synthesis system (Invitrogen). Standard PCR conditions were used for amplification reactions. STT3A and STT3B were amplified using the following PCR primers: STT3Aforward: 5′CTGGTTTGATGACCGAGCCT3′; STT3Areverse: 5′GCCTaACCAGAGAGATGACGC3′; STT3Bforward: 5′CGAGTTCGACCCGTGGTTTA3′; STT3Breverse: TGCAGCAATGCAAAGACACC3′. PCR reactions were run on an agarose gel and the images were analyzed using ImageJ (version 1.45i) to determine relative band intensities. Lanes of interest were marked with the rectangular selection tool and profile plots were generated. Lines were used to select the peaks of interest, and a wand tool was used to select peaks for measurement. Each sample was measured in triplicate.
Results and Discussion
Quantitative Glycoproteomics Profiling of Pancreatic Tissue
The quantitative glycoproteomics method30 used in this study is illustrated in Figure 1a. In brief, equal amounts of pancreatic tissue protein from the diseased and healthy control groups were digested with trypsin, labeled with heavy and light versions of formaldehyde individually, combined, and subjected to hydrazide chemistry-based solid phase extraction to enrich for N-glycopeptides. The glycopeptide extract was separated with reverse-phase liquid chromatography (LC) followed by in-line MS/MS analysis. The resulting data were searched against a human proteome database and validated for peptide/protein identification, followed by quantitative analysis. Only peptides identified with a PeptideProphet probability score ≥0.95 (∼1.2% error rate) were retained for analysis. Notably, before N-glycopeptide enrichment, a small portion of the combined sample was taken for global profiling to obtain protein expressional data. Two sets of quantitative glycoproteomics profiling experiments were carried out to globally compare the N-glycoproteome of pancreatic tissues between diseased and healthy controls: (1) PDAC versus healthy normal controls (PDAC/NL) and (2) CP versus healthy normal controls (CP/NL). In each experiment, replicate samples were analyzed and combined data were used for the final analysis. A nonhuman glycoprotein standard (yeast invertase 2) was used to monitor and control variations that may have been introduced during the sample preparation. This glycoprotein standard has 13 N-glycosylation sites. Among them, 7 N-glycosylation sites represented by five formerly glycosylated N-glycopeptides were consistently detected. In both experiments, the average ratio of the standard peptides remained ∼1.0 before and after glyco-enrichment, affirming the robustness of this method. The comparison of duplicate biological samples demonstrated that in experiments PDAC/NL and CP/NL, more than 73 and 78% of the total annotated glycoproteins identified were detected in both replicates, respectively (Figure 1b). The quantitative ratios of the glycopeptides showed a reasonable correlation between the replicates (Figure 1c).
Figure 1.
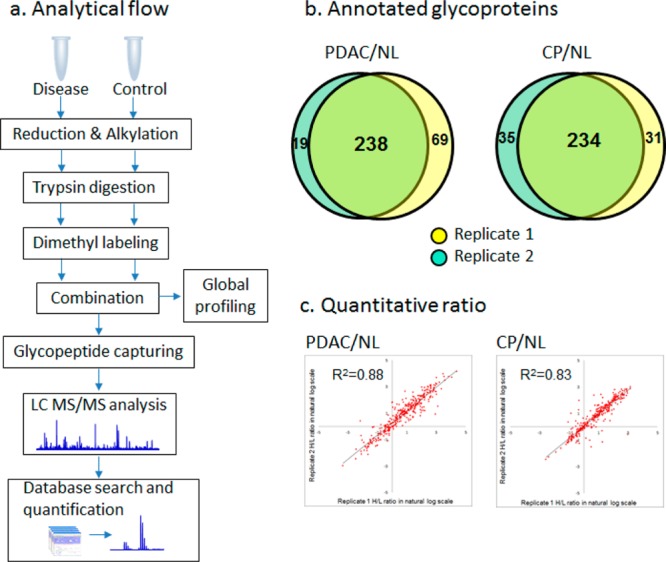
Quantitative glycoproteomics analysis of PDAC/NL and CP/NL. (a) Glycoproteomics analytical flow. The disease and control samples are digested and differentially labeled with heavy and light stable isotope labeling. The combined sample is subjected to N-glycopeptide enrichment followed by LC–MS/MS analysis. (b) Overlap of glycoproteins identified in replicates. In both PDAC/NL and CP/NL experiments, the majority of the glycoproteins were identified in both replicates. (c) Correlation of glycopeptide ratios between replicates. The quantitative ratios of the glycopeptides are well-correlated between the replicates in both experiments, with an R2 value of 0.88 and 0.83 for PDAC/NL and CP/NL, respectively.
One advantage of enriching glycopeptides for mass spectrometry analysis is to reduce the possibility of false identification of N-glycosylation sites due to deamidation of asparagine. Using solid-phase extraction, glycopeptides were retained on the solid phase with covalent bonding between the protein carbohydrate groups and the surface-attached hydrazide groups. Thus, the majority of the nonglycopeptides, including deamidated peptides, were washed off during sample preparation process and were not included in the mass spectrometric analysis. In fact, among the peptides identified (PeptideProphet probability ≥0.95) with NXT/S motifs, 94% were confirmed with the Uniprot Knowledgebase with annotated N-glycosylation site(s).
Altogether, 637 N-glycopeptides derived from 374 (based on gene symbol) nonredundant glycoproteins were identified with stringent criteria, representing 649 annotated N-linked glycosylation sites. The N-glycopeptides identified in pancreas tissue are summarized in Supplemental Table 1 in the Supporting Information. More than 62% of the glycoproteins identified are membrane proteins, and over 46% are extracellular proteins, involving a variety of biological processes, including cellular process regulation, protein metabolism, immune system response, transport, and biological adhesion.
Presence of Pancreas N-Glycoproteins in Blood
Because glycosylated proteins, in particular, N-linked glycoproteins, are destined for extracellular environments,31 many tumor-associated glycoproteins are shed into the blood and may be detectable by various methods. This could partially explain why many cancer biomarkers, including CA19-9, are glycoproteins.32 In comparing with the proteins identified in human plasma by the HUPO human plasma project33,34 and our previous plasma proteomics study,35 nearly half (46%) of the pancreas tissue glycoproteins identified in this study were also present in plasma. When the same hydrazide-chemistry-based solid-phase extraction approach was used for glycoenrichment, 157 N-glycoproteins identified in pancreas tissue were also captured and identified in human plasma.25,36 The cellular locations of these glycoproteins are presented in Figure 2a. Whether the presence of these pancreatic tissue glycoproteins in plasma quantitatively represents their association with cancer in tumor tissue poses an important question for blood biomarker development and warrants further investigation. Figure 2b shows the plasma concentration range for some of the glycoproteins identified in pancreatic tissue, which were previously proposed as potential cancer biomarker candidates.37 The majority of these glycoproteins have at least one N-glycopeptide upregulated in pancreatic tumor tissue.
Figure 2.

Presence of pancreas glycoproteins in plasma. (a) GO annotation of the cellular components for the pancreas glycoproteins that were also identified in plasma studies. The majority of these N-glycoproteins are extracellular or membrane proteins. (b) Plasma concentrations (on log10 scale) of selected N-glycoproteins identified in pancreas tissue. The up and down arrows indicate that at least one N-glycopeptide derived from these proteins was either up- (≥2 fold) or down- (≤0.5 fold) regulated in pancreatic tumor tissue, respectively.
Changes in N-Glycosylation Level Associated with Pancreatic Cancer and Inflammation
While the peptide abundance ratio distribution before glycopeptide enrichment reflects the comparison of the whole proteome between diseases (PDAC or CP) and control (NL) for a given analytical sensitivity, the postenrichment peptide abundance ratio distribution represents a more specific comparison of the N-glycoproteome between the disease and control samples. Figure 3a shows the peptide ratio distribution of PDAC/NL and CP/NL after glycopeptide enrichment (mostly glycopeptides in their deglycosylated form). Following glycopeptide enrichment, the median peptide ratio of PDAC/NL shifted from 1.2 before glycopeptide enrichment to 2.5, indicating an overall increase in N-glycosylation level in pancreatic cancer samples. While this alteration in the N-glycoproteome was obscured in the whole proteome analysis due to the sample complexity, it was clearly revealed by the quantitative glycoproteomics analysis. A similar phenomenon was observed upon comparison of CP to healthy control. These observations may be related to our previous tissue proteomics study,38 which indicated that N-glycoproteins were significantly enriched among the overexpressed proteins of PDAC and severe CP tissues compared with healthy control.
Figure 3.

(a) Distribution of peptide abundance ratio after glycopeptide enrichment. Most of the peptides identified after glyco-enrichment are N-glycopeptides in their deglycosylated form and showed an upward shift in peptide abundance ratio distribution in both PDAC/NL and CP/NL experiments. While the majority of the total peptides (before glyco-enrichment) did not show a significant difference in abundance between diseases and controls, a significant portion of the N-glycopeptides (after glyco-enrichment) were associated with an abundance elevation in cancer and pancreatitis tissue. (b) Distribution of the N-glycopeptides based on their abundance ratio in PDAC and CP compared with the normal control. The glycopeptides are categorized into nine regions based on their relative glycosylation level in PDAC and CP, as described in the text.
Quantitative evaluation of the glycoproteomics method using identical pancreas tissue samples indicated that when a two-fold change was used as a cutoff threshold the false discovery rate for quantification was ∼4%.30 By that criteria, 392 N-glycopeptides (316 up- and 76 down-regulated) derived from 252 proteins were found to have aberrant N-glycosylation level (≥2-fold change) in pancreatic cancer tissue. Figure 3b summarizes the abundance ratio changes of the formerly glycosylated N-glycopeptides in pancreatic cancer and CP compared with the nondiseased controls. A significant portion of N-glycopeptides showed a ≥2-fold change in pancreatic cancer (regions B, I, and H). Notably, the N-glycopeptides derived from several CA19-9 carrier proteins, including mucins, apolipoprotein B, and kininogen-1,39 fell within these regions. Some of these cancer-associated N-glycopeptides were also elevated in CP (region B) in accordance with the notion that proteins dysregulated in CP are frequently involved in pancreatic cancer.38,40 Among the N-glycopeptides that were up-regulated in both PDAC and CP using NL as a background, some showed an even greater elevation in PDAC compared with CP. The group of the glycopeptides that were up-regulated in pancreatic cancer but not in CP (region I) are largely associated with cancer and will be discussed in the pathway analysis section. In contrast, there were fewer glycopeptides that were down-regulated in pancreatic cancer (regions D–F). Glycopeptides that were down-regulated in pancreatic cancer but not in CP clustered in region E.
One last group of glycopeptides was identified in only one experiment (PDAC/NL or CP/NL) but not both. These glycopeptides were not presented in Figure 3b, which only includes glycopeptides with both PDAC/NL and CP/NL ratios. The detection of these glycopeptides in only one set of samples may be attributed to their abundant difference in PDAC/NL and CP/NL sample set or limited by the scope of current “shotgun” proteomics approach. Some of the differential glycopeptides identified exclusively in PDAC/NL experiment are highly relevant to pancreatic cancer, including N-glycopeptides derived from MUC5AC, MUC5B, CECAM5, and CECAM6.
Periodic acid Schiff (PAS) staining was performed on a TMA to detect the overall level of polysaccharides presented on tissue sections of PDAC, CP, and NL. As shown in Figure 4, PAS staining (red) on the majority of the tumor tissues and CP lesions is significantly stronger than the normal pancreas tissues, reflecting an overall increase in glycosylation level in pancreatic tissue of PDAC and CP.
Figure 4.

PAS staining of an TMA that includes tissue sections of PDAC, CP, and NL. (a) Images of PAS staining on the tissue sections. PAS staining (red) on most of the PDAC and CP tissue sections appeared to be stronger than the NL tissue sections. (b) Histoscores of PAS staining were significantly higher in PDAC and CP groups compared with NL group.
Preferential Detection of Formerly N-Linked Glycosylation Sites in Cancer
The measurement of abundance of an N-glycosylated peptide may represent the glycosylation level of its corresponding glycosylation site and is a convoluted outcome of the core protein expression and the glycosylation occupancy of the specific glycosylation site. Therefore, quantitative difference in the detection of a specific glycopeptide between cancer and control may reflect the overall difference of the glycosylation level on the corresponding protein site, although such detection can be influenced by the complexity, number, and spacing of glycans at the specific site. By knowing the relative changes in glycopeptide abundance and core protein expression, the relative change of an N-glycosylation site occupancy can be further estimated as follows: fold change in N-glycosylation site occupancy = fold change in N-glycopeptide abundance/fold change in core protein expression. Table 1 exemplifies that for some proteins N-glycosylation site occupancy changes within an individual protein can vary substantially in cancer or CP. Kininogen-1 (KNG1) is a CA19-9 protein carrier and has been associated with pancreatic cancer and pancreatitis. The occupancy of two N-glycosylation sites of KNG1 was significantly increased (>3 fold) in PDAC and CP tissues compared with normal controls, whereas its core protein expression was only slightly elevated in the disease samples. Notably, the increase in sialylation and fucosylation of kininogen-1 has been observed in the sera of pancreatic cancer patients.21 Versican (VCAN) is an extracellular matrix proteoglycan that plays a role in inflammation and cancer metastasis and has been associated with pancreatic cancer.38,41 While its core protein expression was significantly increased in PDAC and CP tissue (20-fold and 8-fold in PDAC and CP, respectively), the changes in its glycosylation site occupancy were less dramatic. Biglycan (BGN) is a pancreatic cancer-associated extracellular matrix proteoglycan that interacts with collagens. Two of its N-glycosylation sites were heavily hyper-glycosylated in PDAC and CP, respectively. Apolipoprotein B-100 (APOB) is also one of the CA19-9 protein carriers and is involved in regulating plasma lipid metabolism. Two N-glycosylation sites of APOB were detected at a >3-fold higher level in PDAC and CP compared with normal pancreas, while its three other N-glycosylation sites were detected at <0.5-fold reduced levels. Fibrillin 1 (FBN1) is secreted by fibroblasts and is a major component of the elastin microfibrils, which impact tumor cell-extracellular matrix interactions.42 While the core protein expression of FBN1 is significantly increased in PDAC and CP, glycosylation occupancies of its three N-glycosylation sites were decreased (≤0.3 fold) in the diseased states. These observations suggest that inherent changes in the N-glycosylation of specific proteins at certain glycosylation sites in the disease settings may be important and independent of core protein expression levels. As a reference, the five formerly N-glycosylated peptides derived from yeast invertase 2, which was spiked in the samples and used as a control for glycopeptide capturing, maintained abundance ratios around 1.0 in the comparison of diseases (PDAC or CP) and normal control (NL) (Supplemental Figure 1 in the Supporting Information).
Table 1. Exemplification of Changes in N-Glycosylation Site Occupancy Associated with PDAC and CP in Comparison with Healthy Controla.
| PDAC versus NL |
CP versus NL |
|||||||
|---|---|---|---|---|---|---|---|---|
| glycoprotein | gene symbol | N-glycopeptide | fold change in glycopeptide abundance | fold change in protein abundance | fold change in glycosylation site occupancy | fold change in glycopeptide abundance | fold change in protein abundance | fold change in glycosylation site occupancy |
| apolipoprotein B-100 | APOB | R.FEVDSPVYN∼ATWSASLK.N | 1.7 | 4.9 | 0.3 | 1.3 | 2.6 | 0.5 |
| R.FN∼SSYLQGTNQITGR.Y | 17.4 | 3.5 | 12.3 | 4.6 | ||||
| K.FVEGSHN∼STVSLTTK.N | 0.5 | 0.1 | 0.9 | 0.3 | ||||
| R.VNQNLVYESGSLN∼FSK.L | 2.6 | 0.5 | 0.9 | 0.3 | ||||
| K.YDFN∼SSM″LYSTAK.G | 18.0 | 3.6 | 18.4 | 6.9 | ||||
| biglycan | BGN | K.LLQVVYLHSNN∼ITK.V | 15.9 | 3.0 | 5.3 | 9.0 | 0.8 | 12.0 |
| R.M″IEN∼GSLSFLPTLR.E | 9.0 | 3.0 | 8.2 | 11.0 | ||||
| complement factor H | CFH | K.IPCSQPPQIEHGTIN∼SSR.S | 12.4 | 1.8 | 6.9 | 21.2 | 2.5 | 8.6 |
| R.ISEEN∼ETTCYM″GK.W | 25.0 | 14.0 | 16.9 | 6.9 | ||||
| K.MDGASN∼VTCINSR.W | 1.0 | 0.5 | 9.1 | 3.7 | ||||
| clusterin | CLU | K.EDALN∼ETR.E | 5.5 | 2.7 | 2.0 | 4.1 | 3.8 | 1.1 |
| R.LAN∼LTQGEDQYYLR.V | 4.1 | 1.5 | 4.5 | 1.2 | ||||
| K.M″LN∼TSSLLEQLNEQFNWVSR.L | 5.4 | 2.0 | 5.7 | 1.5 | ||||
| R.QLEEFLN∼QSSPFYFWM″NGDR.I | 5.0 | 1.8 | 4.4 | 1.1 | ||||
| CP protein | CP | K.EHEGAIYPDN∼TTDFQR.A | 15.8 | 2.6 | 6.0 | 10.6 | 7.1 | 1.5 |
| K.ELHHLQEQN∼VSNAFLDK.G | 14.4 | 5.5 | 5.9 | 0.8 | ||||
| K.EN∼LTAPGSDSAVFFEQGTTR.I | 9.9 | 3.8 | 9.9 | l.4 | ||||
| fibrillin 1 | FBN1 | K.AWGTPCEMCPAVN∼TSEYK.I | 2.0 | 9.7 | 0.2 | 2.5 | 7.9 | 0.3 |
| K.CTDLDECSN∼GTHM″CSQHADCK.N | 1.9 | 0.2 | 2.2 | 0.3 | ||||
| R.VLPVN∼VTDYCQLVR.Y | 1.3 | 0.1 | 1.8 | 0.2 | ||||
| pancreatic secretory granule membrane major glycoprotein | GP2 | R.DPN∼CSSILQTEER.N | 0.1 | 0.2 | 0.5 | 0.1 | 0.3 | 0.5 |
| R.QDLN∼SSDVHSLQPQLDCGPR.E | 0.4 | 2.3 | 0.6 | 2.4 | ||||
| K.VSLQAALQPIVSSLN∼VSVDGNGEFIVR.M | 0.6 | 3.5 | 0.8 | 3.1 | ||||
| hemopexin | HPX | K.ALPQPQN∼VTSLLGCTH.- | 13.1 | 7.4 | 1.8 | 9.5 | 3.5 | 2.8 |
| R.CSDGWSFDATTLDDN∼GTM″LFFK.G | 4.8 | 0.6 | 4.8 | 1.4 | ||||
| R.N∼GTGHGN∼STHHGPEYM″R.C | 14.0 | 1.9 | 8.1 | 2.3 | ||||
| R.SWPAVGN∼CSSALR.W | 15.1 | 2.0 | 10.9 | 3.1 | ||||
| endoplasmin | HSP90B1 | R.EEEAIQLDGLN∼ASQIR.E | 0.6 | 0.4 | 1.7 | 0.9 | 0.5 | 2.0 |
| K.GVVDSDDLPLN∼VSR.E | 0.1 | 0.3 | 0.1 | 0.3 | ||||
| kininogen-1 | KNG1 | R.ITYSIVQTN∼CSK.E | 9.6 | 1.4 | 6.6 | 13.1 | 1.9 | 7.1 |
| K.YNSQN∼QSNNQFVLYR.I | 7.0 | 4.8 | 6.4 | 3.5 | ||||
| lumican | LUM | K.AFEN∼VTDLQWLILDHNLLENSK.I | 2.4 | 4.3 | 0.6 | 3.7 | 3.0 | 1.2 |
| K.LGSFEGLVN∼LTFIHLQHNR.L | 2.5 | 0.6 | 4.7 | 1.6 | ||||
| K.LHINHNN∼LTESVGPLPK.S | 2.7 | 0.6 | 5.0 | 1.6 | ||||
| R.LSHNELADSGIPGNSFN∼VSSLVELDLSYNK.L | 2.0 | 0.5 | 3.9 | 1.3 | ||||
| PRELP protein | PRELP | R.IHYLYLQNNFITELPVESFQN∼ATGLR.W | 14.1 | 7.6 | 1.8 | 10.3 | 3.1 | 3.3 |
| K.IN∼GTQICPNDLVAFHDFSSDLEN∼VPHLR.Y | l.8 | 0.2 | 2.0 | 0.6 | ||||
| prosaposin | PSAP | K.DN∼ATEEEILVYLEK.T | 2.2 | 1.5 | 1.5 | 3.3 | 1.6 | 1.1 |
| R.TN∼STFVQALVEHVK.E | 4.6 | 3.0 | 2.7 | 0.9 | ||||
| versican | VCAN | R.FEN∼QTGFPPPDSR.F | 38.4 | 20.8 | 1.9 | 17.9 | 8.2 | 2.2 |
| R.GQFESVAPSQN∼FSDSSESDTHPFVIAK.T | 22.6 | 1.1 | 3.2 | 0.4 | ||||
Fold change in glycosylation site occupancy = Fold change in glycopeptide abundance/Fold change in protein abundance. N∼ - N-glycosylation site, M″ - oxidized methionine.
A small group of known cancer-associated glycoproteins, including carcinoembryonic antigen-related cell adhesion molecule 5 (CEACAM5), mucin-5AC (MUC5AC), insulin-like growth factor binding protein (IGFBP3), and platelet endothelial cell adhesion molecule (PECAM1 or CD31), were only detected in the PDAC/NL experiment. For this group of proteins, the formerly N-glycosylated peptides, which represent different N-glycosylation sites, derived from the same protein also showed various levels of abundance change in cancer (Supplemental Table 1 in the Supporting Information), mirroring the heterogeneity of N-glycosylation changes at different glycosylation sites within a protein. Notably, for these proteins, not all N-glycosylation sites were detected as expected. For example, according to UniProtKB (http://www.uniprot.org), CEACAM5 has two referenced and 26 potential N-glycosylation sites (including some N-glycopeptides that have repeated sequences), but only two formerly glycosylated peptides, representing the two referenced N-glycosylation sites, were detected in pancreatic tumor tissues in this study. This may be due to several reasons, including: (1) Some glycopeptides may not have a molecular mass within the mass spectrometry detection range. (2) Protein glycosylation varies significantly in different organ tissues. Some potential N-glycosylation sites may not be glycosylated in pancreatic tissue, and (3) some glycopeptide sequences may inherently afford low mass spectrometric sensitivity. Nonetheless, our observation supports the fact that the glycosylation levels between individual N-glycosylation sites within a glycoprotein can be different in corresponding to pancreatic cancer; and such difference may result from the nature of macro-heterogeneity of N-glycosylation16 and the influence of malignancy on the complex mechanisms that regulate glycosylation events.
Changes in Oligosaccharyltransferase Subunits
N-Glycosylation involves a complex process in determining the mature form of a glycoprotein, including the biosynthesis of dolichol-linked oligosaccharide and the transfer of the oligosaccharide from the lipid donor substrate to the nascent polypeptide. This complex process occurs in endoplasmic reticulum (ER) and other cellular compartments, engaging a variety of enzymes and proteins, including glycotransferases, glycosidases, and oligosaccharyltransferase (OST) complex.43 The main function of OST, which is located at the membrane of the ER, is to transfer preassembled, lipid-linked oligosaccharides to selected asparagine residues within the consensus sequence Asn-X-Ser/Thr on nascent polypeptides. Several OST subunits, including STT3A, DAD1, RPN1, RPN2, and DDOST (OST48), were found slightly under-expressed in pancreatic tumor tissues as well as CP tissues (Figure 5a). Real-time PCR was used to measure the expression of two major OST catalytic subunits, STT3A and STT3B, in three pancreatic cancer cell lines (AsPC1, MiaPaCa, and Panc1) as well as in TGFβ1-activated fibroblast cells (TGFβ-HDF) using normal pancreatic ductal epithelial cells (HPDE) and normal fibroblast cells (HDF) as a comparison, respectively (Figure 5b). As demonstrated in Figure 5c, in all three pancreatic cancer cell lines we observed a slight decrease in expression of both STT3A and STT3B relative to HPDE; and in the stimulated fibroblast cells, no significant change of STT3A and STT3B expression was observed compared with the parental HDF. The observations in pancreatic cancer cell lines appeared to be coherent with the tissue proteomics data, suggesting that a minor down-regulation of OST proteins was associated with the alterations in pancreatic tissue due to pancreatic adenocarcinoma or severe inflammation. The efficiency of N-glycan attachment on glycoprotein sites may be cell-type-dependent and differentially regulated at different levels of protein co- and post-translational modifications and can be affected genetically or functionally by altered physiological status due to malignancy. While OST plays a crucial role in facilitating N-glycosylation, it is only one of many modules within the N-glycosylation pathway in determining the mature form of a glycoprotein.16,43 These data support further investigations to examine OST functional changes and other key factors accounting for the protein specific alterations in N-glycosylation level observed in pancreatic tumor tissue.
Figure 5.

(a) Relative abundance of some of the OST subunits (STT3A, DAD1, RPN1, RPN2, and DDOST) in pancreatic tumor tissue and chronic pancreatitis tissue compared to normal pancreas (DDOS was not detected in CP/NL experiments). (b) Real-time PCR analysis of STT3A and STT3B expression in three pancreatic cancer cell lines (AsPC1, MiaPaCa, and Panc1) and in TGFβ1-activated fibroblast cells (TGFB-HDF) compared with normal pancreatic ductal epithelial cells (HPDE) and normal fibroblast cells (HDF), respectively. (c) Relative intensities of STT3A and STT3B in the cell lines. The intensity for STT3A or STT3B was relative to GAPDH and then normalized to HPDE for pancreatic cancer cells and normalized to HDF for TGFβ1-activated HDFs.
Although it remains unclear how malignancy influences the sophisticated N-glycosylation pathway in modulating N-glycosylation efficiency, our observations implicate the fact that cancer-associated aberrant glycosylation may involve changes in N-glycosylation site occupancy, and such changes may be protein- and glycosylation-site-specific, influencing the detection of the abundance of specific glycopeptides for certain proteins. The ability to quantitatively probe glycosylation level at individual glycosylation sites (using specific glycopeptides) may reveal information about highly specific cancer-associated molecular changes and provide clues to elucidate the roles of protein glycosylation in pancreatic cancer pathways.
Glycosylation of Galectin-3-Binding Protein (LGALS3BP)
Galectin-3-binding protein (LGALS3BP or M2BP) belongs to the Scavenger Receptor Cysteine-Rich domain (SRCR) superfamily of proteins, and its significant N-glycosylation change in PDAC is notable in this study. LGALS3BP is a known tumor-associated antigen and plays a role in immune defense against tumor cells and was previously associated with shorter cancer survival and drug resistance.44,45 The core protein expression of LGALS3BP was elevated 2.5-fold in pancreatic tumor tissue compared with normal pancreas (Figure 6a). We further observed that the abundance of several of its N-glycopeptides were significantly up-regulated in PDAC, with over 10-fold and 3-fold increase compared with normal pancreas and chronic pancreatitis, respectively (Figure 6b). Highly glycosylated LGALS3BP may stimulate and intensify the interaction of its major binding partners, such as galectin-1 (LGALS1) and galectin-3 (LGALS3), both of which have been associated with pancreatic cancer46−48 and found to be overexpressed in PDAC in this study with 5.8 and 3.3 fold increase in pancreatic tumor tissue, respectively (Figure 6a). Other endogenous ligands of galectin-1 and -3, including fibronectin, lysosome-associated membrane glycoproteins, receptor-type tyrosine-protein phosphatase C, CD7 antigen and integrin alpha-M also showed different levels of increase in glycopeptides detected (Supplemental Table 1 in the Supporting Information) but less substantial than LGALS3BP. The up-regulation of galectins and significant hyper N-glycosylation of LGALS3BP in tumor tissue (Figure 6c) may imply an increased cell–cell interaction to facilitate tumor cell aggregation and metastatic diffusion.49
Figure 6.

Core protein expression and N-glycosylation site occupancy changes of LGALS3BP in PDAC. (a) Relative abundance of LGALS3BP and its major binding partners LGALS1and LGALS3 in PDAC compared with NL. The core protein expressions of these proteins were all elevated in tumor tissues. (b) Relative abundance of N-glycopeptides derived from LGALS3BP in PDAC compared with NL and CP. The glycosylation level of the corresponding N-glycosylation sites increased in PDAC. (c) Changes in N-glycosylation site occupancy of LGALS3BP in PDAC compared with NL.
Pathways and Networks Associated with Glycoproteins with Increased N-Glycosylation Level in PDAC
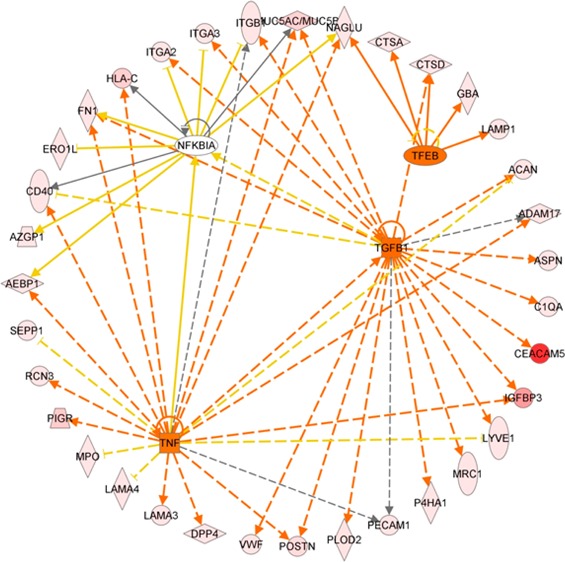
Among the glycoproteins identified, 197 and 175 glycoproteins have at least one N-glycopeptide up-regulated in PDAC and CP, respectively. A significant number (n = 137) of the glycoproteins with elevated N-glycosylation level associated with PDAC overlapped with those associated with CP. Analysis using ingenuity pathway analysis (IPA) (Ingenuity Systems) revealed some interesting differences and similarities. For PDAC-associated glycoproteins, cancer is the primary disease, and for CP-associated glycoproteins, inflammatory response is the major pathway. While the significant molecular and cellular functions associated with the glycoproteins of both disease groups include cell movement and interaction of leukocyte and other immune cells, the PDAC-associated glycoproteins were also involved in the movement and interaction of endothelial and tumor cells (Supplemental Table 2 in the Supporting Information). Further analysis of the glycoproteins that were PDAC-specific (n = 60) revealed that the top biological functions associated with these proteins are cancer, pancreatic cancer, and epithelial neoplasia and the top upstream regulators are TGFB1, TNF, TFEB, and NFKBIA (Supplemental Table 2 in the Supporting Information). Figure 7 displays the downstream protein networks for TGFB1, TNF, TFEB, and NFKBIA. It is important to note that the IPA analysis was based on the elevated level of N-glycosylation of these glycoproteins. Thus, the results may reflect the relationship of N-glycosylation level and activities of these glycoproteins and their roles in the corresponding pathways.
Figure 7.

Ingenuity pathway analysis: Significant upstream regulators (TGFB1, TNF, TFEB, and NFKBIA) of the glycoproteins that had elevated N-glycosylation levels in PDAC compared with normal pancreas and chronic pancreatitis. Orange line denotes leads to activation and yellow lines denote that the finding is inconsistent with the downstream molecule based on the database. Most of these yellow lines are associated with NFKBIA, implying a possible negative influence on NFKBIA function with the increase in N-glycosylation level of its downstream glycoproteins in PDAC.
While numerous studies have demonstrated the important role of TGFB1, TNF, and NF-kappa-B in cancer and pancreatic tumorigenesis,50−52 their involvement with glycosylation has been largely uncovered. Increased N-glycosylation level of a large number of TGFB1-regulated glycoproteins, whose main molecular functions are cell–cell interaction, tumor cell movement, and immune cell trafficking, may implicate glycosylation events in the activation of TGF-β-related pathways in PDAC. The glycoproteins involved in the TNF pathways have various functions related to tumorigenesis, including proliferation, regulation of apoptosis, and cell migration. Over half of the PDAC-associated glycoproteins involved in the TNF pathway also participated in the TGF-β pathway, suggesting that increased N-glycosylation activities of these proteins may involve coactivation of TNF- and TGFB1-related pathways in the pathogenesis of PDAC. The finding of TFEB as a significant upstream activator for PDAC-associated glycoproteins may link increased N-glycosylation level and altered activity of lysosomal proteins in pancreatic tumorigenesis. For NFKBIA, we observed that the IκB inhibitor, NFKBIA, is negatively associated with the N-glycosylation level of its downstream glycoproteins in PDAC (Figure 7). This phenomenon implies that increased N-glycosylation of these glycoproteins may possibly reduce the function of NFKBIA to complex with NF-κB transcription factor and thus promote the activity of NF-κB transcription factor in pancreatic tumorigenesis.
Summary
Using a quantitative glycoproteomics approach, we have investigated the N-glycoproteome of human pancreas and its alteration associated with pancreatic cancer and inflammation. On a large scale, we observe an overall increase in N-glycosylation level, which represents an overall outcome of changes in N-glycosylation occupancy and core protein expression across a broad range of glycoproteins in pancreatic tumor tissue and CP tissue. The upward shifting of the distribution of N-glycopeptide ratio may reflect an overall increase in N-glycosylation activity resulting from or implicated with pancreatic tumorigenesis or associated complications such as inflammation. Many pancreatic cancer-associated glycoproteins were found to have elevated N-glycosylation level in tumor tissues compared with normal pancreas, including MUC5AC, CEACAM5, IGFBP3, LGALS3BP, and others. Notably, LGALS3BP was found both increased in protein expression and substantially hyper-glycosylated in tumor tissue. The implication of LGALS3BP N-glycosylation in pancreatic tumorigenesis was possibly through intensifying the specific interplay between LGALS3BP and galectins to mediate cell–cell and cell-extracellular matrix interactions, angiogenesis, and apoptosis of tumor cells.49
For many of these aberrant glycoproteins, glycosylation site occupancy at specific N-glycosylation sites could correspond to pancreatic malignancy or inflammation differently, reflecting the complex molecular mechanisms involved. These observations support the fact that for certain glycoproteins, in addition to glycan structure alterations, specific changes in N-glycosylation level appeared to be quantitatively associated with pancreatic cancer or inflammation. Such molecular feature may be represented by specific glycopeptides, which, in turn, can be quantitatively detected in clinical specimens using targeted proteomics.53−55 Examination of OST subunits did not indicate a significant change in the expression of these proteins in pancreatic tumor tissues, CP tissues, as well as pancreatic cancer cell lines. Further investigations are needed to clarify the role of OST in tumor-associated N-glycosylation alterations on proteins.
The pathway analysis of increased N-glycosylation level on many glycoproteins implicates several known pancreatic cancer pathways, including TGF-β, TNF, NF-kappa-B, and TFEB-related lysosomal changes. Although these pathways have been previously associated with pancreatic tumorigenesis, the increased N-glycosylation level in pancreatic cancer pathways is an emerging phenomenon that may help decode how glycosylation is involved in metastasis and invasion of pancreatic cancer. The majority of the glycoproteins with increased N-glycosylation level were involved in cell movement and signaling functions related to tissue development. Protein–protein interaction analysis of all PDAC-associated glycoproteins involved in TGF-β, TNF, TFEB, and NF-kappa-B pathways further revealed that these glycoproteins are highly interactive among themselves and involve ECM-receptor interactions and focal adhesions (Supplemental Figure 2 in the Supporting Information), which may be relevant to site-specific glycosylation changes, thereby affecting specific protein–protein interactions, protein conformation, and structure involved in cancer progression and metastasis.
While this global study reveals the aberrant N-glycosylation levels associated with pancreatic tumor tissues from a proteomic perspective, much work remains to follow-up these leads and is beyond the scope of this report. The orchestrated mechanism underlying the differential changes of N-glycosylation occupancy in cancer, which appears to be not only protein- but also glycosylation-site-specific, remains poorly understood.
Acknowledgments
We thank Dr. Mary P. Bronner at University of Utah for providing the TMA for PAS analysis, and Drs. Philip S. Mayer and Jay W. Heinecke at University of Washington for allowing us to carry out the initial experiments using their MALDI TOF/TOF instrument. We also thank Dr. Peter Rabinovitch at University of Washington and Dr. Ming-Sound Tsao at University of Toronto for providing the HDF and HPDE cells, respectively. We are grateful to the University of Washington’s Proteomics Resource (UWPR95794) for supporting the preliminary investigation of this work and Fred Hutchinson Cancer Research Center Proteomics Shared Resource for mass spectrometric analysis. This study was supported in part with federal funds from the National Institutes of Health under grants K25CA137222, R21CA149772, R01CA107209, K07CA116296, R21CA161575 and 1S10RR-449017262.
Supporting Information Available
The N-glycopeptides derived from yeast invertase 2. Protein–protein interactions among the PDAC associated glycoproteins involved in TGF-β, NF-kappa-B, and TNF pathways. Identification and quantification of N-glycopeptides in pancreas tissues (PDAC vs NL and CP vs NL). Ingenuity pathway analysis (IPA) - glycoproteins with increased glycopeptide detection in PDAC but not in CP. This material is available free of charge via the Internet at http://pubs.acs.org.
The authors declare no competing financial interest.
This paper was published ASAP on January 28, 2014. Table 1 was adjusted for clarity. The corrected version was reposted on January 30, 2014.
Funding Statement
National Institutes of Health, United States
Supplementary Material
References
- Vincent A.; Herman J.; Schulick R.; Hruban R. H.; Goggins M. Pancreatic cancer. Lancet 2011, 378, 607–20. [DOI] [PMC free article] [PubMed] [Google Scholar]
- Paez D.; Labonte M. J.; Lenz H. J. Pancreatic cancer: medical management (novel chemotherapeutics). Gastroenterol. Clin. North Am. 2012, 41, 189–209. [DOI] [PubMed] [Google Scholar]
- Siegel R.; Naishadham D.; Jemal A. Cancer statistics, 2012. Ca-Cancer J. Clin. 2012, 62, 10–29. [DOI] [PubMed] [Google Scholar]
- Bertozzi C. R.; Kiessling L. L. Chemical glycobiology. Science 2001, 291, 2357–64. [DOI] [PubMed] [Google Scholar]
- Rudd P. M.; Elliott T.; Cresswell P.; Wilson I. A.; Dwek R. A. Glycosylation and the immune system. Science 2001, 291, 2370–76. [DOI] [PubMed] [Google Scholar]
- Brooks S. A.; Carter T. M.; Royle L.; Harvey D. J.; Fry S. A.; Kinch C.; Dwek R. A.; Rudd P. M. Altered glycosylation of proteins in cancer: what is the potential for new anti-tumour strategies. Anticancer Agents Med.Chem. 2008, 8, 2–21. [DOI] [PubMed] [Google Scholar]
- Dennis J. W.; Granovsky M.; Warren C. E. Glycoprotein glycosylation and cancer progression. Biochim. Biophys. Acta 1999, 1473, 21–34. [DOI] [PubMed] [Google Scholar]
- Kobata A.; Amano J. Altered glycosylation of proteins produced by malignant cells, and application for the diagnosis and immunotherapy of tumours. Immunol. Cell Biol. 2005, 83, 429–39. [DOI] [PubMed] [Google Scholar]
- Maupin K. A.; Sinha A.; Eugster E.; Miller J.; Ross J.; Paulino V.; Keshamouni V. G.; Tran N.; Berens M.; Webb C.; Haab B. B. Glycogene expression alterations associated with pancreatic cancer epithelial-mesenchymal transition in complementary model systems. PLoS One 2010, 5, e13002. [DOI] [PMC free article] [PubMed] [Google Scholar]
- Goonetilleke K. S.; Siriwardena A. K. Systematic review of carbohydrate antigen (CA 19–9) as a biochemical marker in the diagnosis of pancreatic cancer. Eur. J. Surg. Oncol. 2007, 33, 266–70. [DOI] [PubMed] [Google Scholar]
- Chaturvedi P.; Singh A. P.; Chakraborty S.; Chauhan S. C.; Bafna S.; Meza J. L.; Singh P. K.; Hollingsworth M. A.; Mehta P. P.; Batra S. K. MUC4 mucin interacts with and stabilizes the HER2 oncoprotein in human pancreatic cancer cells. Cancer Res. 2008, 68, 2065–70. [DOI] [PMC free article] [PubMed] [Google Scholar]
- Remmers N.; Bailey J. M.; Mohr A. M.; Hollingsworth M. A. Molecular pathology of early pancreatic cancer. Cancer Biomarkers 2010, 9, 421–40. [DOI] [PubMed] [Google Scholar]
- Simeone D. M.; Ji B.; Banerjee M.; Arumugam T.; Li D.; Anderson M. A.; Bamberger A. M.; Greenson J.; Brand R. E.; Ramachandran V.; Logsdon C. D. CEACAM1, a novel serum biomarker for pancreatic cancer. Pancreas 2007, 34, 436–43. [DOI] [PubMed] [Google Scholar]
- Singh A. P.; Chaturvedi P.; Batra S. K. Emerging roles of MUC4 in cancer: a novel target for diagnosis and therapy. Cancer Res. 2007, 67, 433–36. [DOI] [PubMed] [Google Scholar]
- Swanson B. J.; McDermott K. M.; Singh P. K.; Eggers J. P.; Crocker P. R.; Hollingsworth M. A. MUC1 is a counter-receptor for myelin-associated glycoprotein (Siglec-4a) and their interaction contributes to adhesion in pancreatic cancer perineural invasion. Cancer Res. 2007, 67, 10222–29. [DOI] [PubMed] [Google Scholar]
- Jones J.; Krag S. S.; Betenbaugh M. J. Controlling N-linked glycan site occupancy. Biochim. Biophys. Acta 2005, 1726, 121–37. [DOI] [PubMed] [Google Scholar]
- Petrescu A. J.; Milac A. L.; Petrescu S. M.; Dwek R. A.; Wormald M. R. Statistical analysis of the protein environment of N-glycosylation sites: implications for occupancy, structure, and folding. Glycobiology 2004, 14, 103–14. [DOI] [PubMed] [Google Scholar]
- Okuyama N.; Ide Y.; Nakano M.; Nakagawa T.; Yamanaka K.; Moriwaki K.; Murata K.; Ohigashi H.; Yokoyama S.; Eguchi H.; Ishikawa O.; Ito T.; Kato M.; Kasahara A.; Kawano S.; Gu J.; Taniguchi N.; Miyoshi E. Fucosylated haptoglobin is a novel marker for pancreatic cancer: a detailed analysis of the oligosaccharide structure and a possible mechanism for fucosylation. Int. J. Cancer 2006, 118, 2803–08. [DOI] [PubMed] [Google Scholar]
- Yue T.; Goldstein I. J.; Hollingsworth M. A.; Kaul K.; Brand R. E.; Haab B. B. The prevalence and nature of glycan alterations on specific proteins in pancreatic cancer patients revealed using antibody-lectin sandwich arrays. Mol. Cell. Proteomics 2009, 8, 1697–707. [DOI] [PMC free article] [PubMed] [Google Scholar]
- Zhao J.; Qiu W.; Simeone D. M.; Lubman D. M. N-linked glycosylation profiling of pancreatic cancer serum using capillary liquid phase separation coupled with mass spectrometric analysis. J. Proteome Res. 2007, 6, 1126–38. [DOI] [PubMed] [Google Scholar]
- Zhao J.; Patwa T. H.; Qiu W.; Shedden K.; Hinderer R.; Misek D. E.; Anderson M. A.; Simeone D. M.; Lubman D. M. Glycoprotein microarrays with multi-lectin detection: unique lectin binding patterns as a tool for classifying normal, chronic pancreatitis and pancreatic cancer sera. J. Proteome Res. 2007, 6, 1864–74. [DOI] [PubMed] [Google Scholar]
- Craig R.; Beavis R. C. TANDEM: matching proteins with tandem mass spectra. Bioinformatics 2004, 20, 1466–67. [DOI] [PubMed] [Google Scholar]
- Keller A.; Eng J.; Zhang N.; Li X. J.; Aebersold R. A uniform proteomics MS/MS analysis platform utilizing open XML file formats. Mol. Syst. Biol. 2005, 1, 2005. [DOI] [PMC free article] [PubMed] [Google Scholar]
- Bause E. Structural requirements of N-glycosylation of proteins. Studies with proline peptides as conformational probes. Biochem. J. 1983, 209, 331–36. [DOI] [PMC free article] [PubMed] [Google Scholar]
- Liu T.; Qian W. J.; Gritsenko M. A.; Camp D. G.; Monroe M. E.; Moore R. J.; Smith R. D. Human plasma N-glycoproteome analysis by immunoaffinity subtraction, hydrazide chemistry, and mass spectrometry. J. Proteome Res. 2005, 4, 2070–80. [DOI] [PMC free article] [PubMed] [Google Scholar]
- Nesvizhskii A. I. Protein identification by tandem mass spectrometry and sequence database searching. Methods Mol. Biol. 2007, 367, 87–119. [DOI] [PubMed] [Google Scholar]
- May D.; Law W.; Fitzgibbon M.; Fang Q.; McIntosh M. Software platform for rapidly creating computational tools for mass spectrometry-based proteomics. J. Proteome Res. 2009, 8, 3212–17. [DOI] [PMC free article] [PubMed] [Google Scholar]
- Brentnall T. A.; Lai L. A.; Coleman J.; Bronner M. P.; Pan S.; Chen R. Arousal of cancer-associated stroma: overexpression of palladin activates fibroblasts to promote tumor invasion. PLoS One 2012, 7, e30219. [DOI] [PMC free article] [PubMed] [Google Scholar]
- Liu N.; Furukawa T.; Kobari M.; Tsao M. S. Comparative phenotypic studies of duct epithelial cell lines derived from normal human pancreas and pancreatic carcinoma. Am. J. Pathol. 1998, 153, 263–69. [DOI] [PMC free article] [PubMed] [Google Scholar]
- Pan S.; Tamura Y.; Chen R.; May D.; McIntosh M. W.; Brentnall T. A. Large-scale quantitative glycoproteomics analysis of site-specific glycosylation occupancy. Mol. Biosyst. 2012, 8, 2850–56. [DOI] [PMC free article] [PubMed] [Google Scholar]
- Roth J. Protein N-glycosylation along the secretory pathway: relationship to organelle topography and function, protein quality control, and cell interactions. Chem. Rev. 2002, 102, 285–303. [DOI] [PubMed] [Google Scholar]
- Ludwig J. A.; Weinstein J. N. Biomarkers in cancer staging, prognosis and treatment selection. Nat. Rev. Cancer 2005, 5, 845–56. [DOI] [PubMed] [Google Scholar]
- Omenn G. S.; States D. J.; Adamski M.; Blackwell T. W.; Menon R.; Hermjakob H.; Apweiler R.; Haab B. B.; Simpson R. J.; Eddes J. S.; Kapp E. A.; Moritz R. L.; Chan D. W.; Rai A. J.; Admon A.; Aebersold R.; Eng J.; Hancock W. S.; Hefta S. A.; Meyer H.; Paik Y. K.; Yoo J. S.; Ping P.; Pounds J.; Adkins J.; Qian X.; Wang R.; Wasinger V.; Wu C. Y.; Zhao X.; Zeng R.; Archakov A.; Tsugita A.; Beer I.; Pandey A.; Pisano M.; Andrews P.; Tammen H.; Speicher D. W.; Hanash S. M. Overview of the HUPO Plasma Proteome Project: results from the pilot phase with 35 collaborating laboratories and multiple analytical groups, generating a core dataset of 3020 proteins and a publicly-available database. Proteomics 2005, 5, 3226–45. [DOI] [PubMed] [Google Scholar]
- Omenn G. S. THE HUPO Human Plasma Proteome Project. Proteomics Clin. Appl 2007, 1, 769–79. [DOI] [PubMed] [Google Scholar]
- Pan S.; Chen R.; Crispin D. A.; May D.; Stevens T.; McIntosh M. W.; Bronner M. P.; Ziogas A.; Anton-Culver H.; Brentnall T. A. Protein alterations associated with pancreatic cancer and chronic pancreatitis found in human plasma using global quantitative proteomics profiling. J. Proteome Res. 2011, 10, 2359–76. [DOI] [PMC free article] [PubMed] [Google Scholar]
- Zhang H.; Liu A. Y.; Loriaux P.; Wollscheid B.; Zhou Y.; Watts J. D.; Aebersold R. Mass spectrometric detection of tissue proteins in plasma. Mol. Cell. Proteomics 2007, 6, 64–71. [DOI] [PubMed] [Google Scholar]
- Polanski M.; Anderson N. L. A list of candidate cancer biomarkers for targeted proteomics. Biomarker Insights 2007, 1, 1–48. [PMC free article] [PubMed] [Google Scholar]
- Pan S.; Chen R.; Stevens T.; Bronner M. P.; May D.; Tamura Y.; McIntosh M. W.; Brentnall T. A. Proteomics portrait of archival lesions of chronic pancreatitis. PLoS One 2011, 6, e27574. [DOI] [PMC free article] [PubMed] [Google Scholar]
- Yue T.; Partyka K.; Maupin K. A.; Hurley M.; Andrews P.; Kaul K.; Moser A. J.; Zeh H.; Brand R. E.; Haab B. B. Identification of blood-protein carriers of the CA 19–9 antigen and characterization of prevalence in pancreatic diseases. Proteomics 2011, 11, 3665–74. [DOI] [PMC free article] [PubMed] [Google Scholar]
- Chen R.; Brentnall T. A.; Pan S.; Cooke K.; Moyes K. W.; Lane Z.; Crispin D. A.; Goodlett D. R.; Aebersold R.; Bronner M. P. Quantitative Proteomics Analysis Reveals That Proteins Differentially Expressed in Chronic Pancreatitis Are Also Frequently Involved in Pancreatic Cancer. Mol. Cell. Proteomics 2007, 6, 1331–42. [DOI] [PubMed] [Google Scholar]
- Skandalis S. S.; Kletsas D.; Kyriakopoulou D.; Stavropoulos M.; Theocharis D. A. The greatly increased amounts of accumulated versican and decorin with specific post-translational modifications may be closely associated with the malignant phenotype of pancreatic cancer. Biochim. Biophys. Acta 2006, 1760, 1217–25. [DOI] [PubMed] [Google Scholar]
- Lapis K.; Timar J. Role of elastin-matrix interactions in tumor progression. Semin. Cancer Biol. 2002, 12, 209–17. [DOI] [PubMed] [Google Scholar]
- Mohorko E.; Glockshuber R.; Aebi M. Oligosaccharyltransferase: the central enzyme of N-linked protein glycosylation. J. Inherited Metab. Dis. 2011, 34, 869–78. [DOI] [PubMed] [Google Scholar]
- Fornarini B.; D’Ambrosio C.; Natoli C.; Tinari N.; Silingardi V.; Iacobelli S. Adhesion to 90K (Mac-2 BP) as a mechanism for lymphoma drug resistance in vivo. Blood 2000, 96, 3282–85. [PubMed] [Google Scholar]
- Iacobelli S.; Sismondi P.; Giai M.; D’Egidio M.; Tinari N.; Amatetti C.; Di Stefano P.; Natoli C. Prognostic value of a novel circulating serum 90K antigen in breast cancer. Br. J. Cancer 1994, 69, 172–76. [DOI] [PMC free article] [PubMed] [Google Scholar]
- Berberat P. O.; Friess H.; Wang L.; Zhu Z.; Bley T.; Frigeri L.; Zimmermann A.; Buchler M. W. Comparative analysis of galectins in primary tumors and tumor metastasis in human pancreatic cancer. J. Histochem. Cytochem. 2001, 49, 539–49. [DOI] [PubMed] [Google Scholar]
- Schaffert C.; Pour P. M.; Chaney W. G. Localization of galectin-3 in normal and diseased pancreatic tissue. Int. J. Pancreatol. 1998, 23, 1–9. [DOI] [PubMed] [Google Scholar]
- Chen R.; Pan S.; Ottenhof N. A.; de Wilde R. F.; Wolfgang C. L.; Lane Z.; Post J.; Bronner M. P.; Willmann J. K.; Maitra A.; Brentnall T. A. Stromal galectin-1 expression is associated with long-term survival in resectable pancreatic ductal adenocarcinoma. Cancer Biol. Ther. 2012, 13, 899–907. [DOI] [PMC free article] [PubMed] [Google Scholar]
- Grassadonia A.; Tinari N.; Iurisci I.; Piccolo E.; Cumashi A.; Innominato P.; D’Egidio M.; Natoli C.; Piantelli M.; Iacobelli S. 90K (Mac-2 BP) and galectins in tumor progression and metastasis. Glycoconjugate J. 2004, 19, 551–56. [DOI] [PubMed] [Google Scholar]
- Balkwill F. TNF-alpha in promotion and progression of cancer. Cancer Metastasis Rev. 2006, 25, 409–16. [DOI] [PubMed] [Google Scholar]
- Hilbig A.; Oettle H. Transforming growth factor beta in pancreatic cancer. Curr. Pharm. Biotechnol. 2011, 12, 2158–64. [DOI] [PubMed] [Google Scholar]
- Holcomb B.; Yip-Schneider M.; Schmidt C. M. The role of nuclear factor kappaB in pancreatic cancer and the clinical applications of targeted therapy. Pancreas 2008, 36, 225–35. [DOI] [PubMed] [Google Scholar]
- Hulsmeier A. J.; Paesold-Burda P.; Hennet T. N-glycosylation site occupancy in serum glycoproteins using multiple reaction monitoring liquid chromatography-mass spectrometry. Mol. Cell. Proteomics 2007, 6, 2132–38. [DOI] [PubMed] [Google Scholar]
- Pan S.; Zhang H.; Rush J.; Eng J.; Zhang N.; Patterson D.; Comb M. J.; Aebersold R. H. High-throughput proteome-screening approach for biomarker detection. Mol. Cell. Proteomics 2005, 4, 182–90. [DOI] [PubMed] [Google Scholar]
- Stahl-Zeng J.; Lange V.; Ossola R.; Eckhardt K.; Krek W.; Aebersold R.; Domon B. High sensitivity detection of plasma proteins by multiple reaction monitoring of N-glycosites. Mol. Cell. Proteomics 2007, 6, 1809–17. [DOI] [PubMed] [Google Scholar]
Associated Data
This section collects any data citations, data availability statements, or supplementary materials included in this article.