Abstract

We have advanced a mechanism for nitrogenase catalysis that rests on the identification of a low-spin EPR signal (S = 1/2) trapped during turnover of a MoFe protein as the E4 state, which has accumulated four reducing equivalents as two [Fe–H–Fe] bridging hydrides. Because electrons are delivered to the MoFe protein one at a time, with the rate-limiting step being the off-rate of oxidized Fe protein, it is difficult to directly control, or know, the degree of reduction, n, of a trapped intermediate, denoted En, n = 1–8. To overcome this previously intractable problem, we introduced a quench-cryoannealing relaxation protocol for determining n of an EPR-active trapped En turnover state. The trapped “hydride” state was allowed to relax to the resting E0 state in frozen medium, which prevents additional accumulation of reducing equivalents; binding of reduced Fe protein and release of oxidized protein from the MoFe protein both are abolished in a frozen solid. Relaxation of En was monitored by periodic EPR analysis at cryogenic temperature. The protocol rests on the hypothesis that an intermediate trapped in the frozen solid can relax toward the resting state only by the release of a stable reduction product from FeMo-co. In turnover under Ar, the only product that can be released is H2, which carries two reducing equivalents. This hypothesis implicitly predicts that states that have accumulated an odd number of electrons/protons (n = 1, 3) during turnover under Ar cannot relax to E0: E3 can relax to E1, but E1 cannot relax to E0 in the frozen state. The present experiments confirm this prediction and, thus, the quench-cryoannealing protocol and our assignment of E4, the foundation of the proposed mechanism for nitrogenase catalysis. This study further gives insights into the identity of the En intermediates with high-spin EPR signals, 1b and 1c, trapped under high electron flux.
Short abstract
We have advanced a mechanism for nitrogenase catalysis that rests on a quench-cryoannealing protocol for determining the number of electrons accumulated in an EPR-active freeze-trapped intermediate. The protocol involved monitoring the intermediate in frozen solution and following its relaxation to resting state through the release of H2, which carries two reducing equivalents. This protocol implicitly predicts that states having accumulated an odd number of electrons cannot relax to resting. The present experiments confirm this prediction.
Introduction
Nitrogenase comprises the MoFe protein, which contains the iron–molybdenum cofactor (FeMo-co) active site and the Fe protein, which is the reductant of the MoFe protein.1 During the nitrogenase catalytic cycle, the MoFe protein accepts eight electrons from Fe protein, delivered one at a time through binding of the reduced Fe protein bound to two ATPs followed by release of the oxidized Fe protein bound to two ADPs. These reducing equivalents effect the reduction of dinitrogen (N2) to two ammonia (NH3) molecules and generate one dihydrogen (H2).1−4 In the currently accepted Lowe and Thorneley notation, a state of a catalytic αβ dimer (one FeMo-co) of MoFe protein that has received n electrons (and protons) is denoted En.2,3 Dinitrogen binds to the FeMo-co only after three or four reduction steps, namely, at the E3 or E4 states, and the N2 binding is accompanied by the obligatory release of H2. We have proposed a mechanism for nitrogenase catalysis that identifies the states E4–E8, based on our studies of several trapped intermediates,5,6 the central one being a state with a low-spin EPR signal (S = 1/2) trapped during turnover of a MoFe protein containing an amino acid substitution of α-70Val by isoleucine (V70I) under high-flux conditions and identified as the E4 state, which has accumulated four reducing equivalents as two [Fe–H–Fe] bridging hydrides.7−9 As the formation of this state is followed by N2 binding, H2 release, and the formation of two NH3 through the acceptance of four additional electrons/protons, it falls at the midpoint in the accumulation of the eight electrons/protons enzymatically required in the catalytic cycle and, thus, is viewed as the “Janus” intermediate, which links the two halves of the electron accumulation process.6 The heart of the mechanism is a proposed solution to the puzzle of why nitrogenase should “waste” two electrons by generating H2: FeMo-co is activated for N2 reduction through reductive elimination of H2 upon N2 binding at the E4 stage.6 This proposal was subsequently confirmed by measurements of turnover under an atmosphere of N2/D2/C2H2.4 We also have discussed possible identities of the earlier states of the enzyme, those formed by accumulation of n = 1–3 reducing equivalents, prior to N2 binding, in a discussion again grounded in the analysis of the E4 state.5,6
The proposed mechanism thus rests on the identification of the Ar-turnover, freeze-trapped intermediate as E4. However, because electrons are delivered to the MoFe protein one at a time, with the rate-limiting step being the off-rate of oxidized Fe protein, it is difficult to directly control, and thus to directly know, the degree of reduction, n, of a trapped intermediate. To overcome this previously intractable problem, we introduced a quench-cryoannealing relaxation protocol for determining n of an EPR-active trapped En turnover state.9 The trapped state was allowed to relax to the resting E0 state in frozen medium, at temperatures near to but below the melting temperature, T ≤ −20 °C. Keeping the sample frozen prevents any additional accumulation of reducing equivalents, as binding of reduced Fe protein to and release of oxidized protein from the MoFe protein both are abolished in a frozen solid; progress in this relaxation was monitored by periodically cooling the sample to cryogenic temperature for EPR analysis. It was assumed that a trapped state could only relax to a less-reduced state through the loss of pairs of reducing equivalents, Scheme 1. For En states formed prior to N2 binding, the equivalents lost would be in the form of H2, as shown; for those that arise later in the catalytic cycle, bound forms of reduced substrate would be lost during relaxation. By means of this protocol we showed that the EPR signal trapped during turnover of the V70I variant of the MoFe protein relaxes to the resting state E0 in a two-step process, each step releasing H2—namely two reducing equivalents—thereby identifying the signal with the E4 state.9 The intermediate state in the relaxation process, which thus corresponds to E2, was observed to contain FeMo-co in an odd-electron (Kramers) state, S = 3/2, as required.
Scheme 1.

The hypothesis that the quench-cryoannealing protocol allows relaxation only by two-equivalent steps implicitly predicts that states that have accumulated an odd number of electrons/protons during turnover under Ar cannot relax to the E0 resting state; as illustrated in Scheme 1, E3 can relax to E1, but by this hypothesis E1 should be stable to relaxation during quench-annealing. To test this prediction, in the present work we freeze-quenched wild-type MoFe protein during Ar turnover under two different conditions of electron flux. Quench-freezing at low flux traps only EPR-silent (non-Kramers, S > 1)10 intermediate E1 along with a reduced concentration of resting state (E0).11,12 Trapping at higher flux further traps two odd-electron (Kramers; S = 3/2) states of FeMo-co, whose EPR signals are denoted 1b and 1c, the former having been shown to correspond to a reduced FeMo-co state (n ≥ 2), the latter to a state at least as reduced as 1b.13 Application of the cryoannealing relaxation protocol to these samples corroborates our hypothesis that an intermediate trapped during turnover under Ar and kept frozen cannot relax toward the resting state in one-equivalent steps, but only by the release of a stable reduction product from FeMo-co. In the case of turnover under Ar, the only product that can be released is H2, which carries two reducing equivalents, and as a result, the E1 state cannot relax. This protocol is also used to measure the steady-state occupancy of the states trapped during turnover under both low and high electron flux, allowing us to discuss the En states associated with the 1b and1c signals.
Materials and Methods
General Methods
All reagents used in these experiments were obtained from Sigma-Aldrich Chemicals (St. Louis, MO, USA) and were used without further purification. Argon gas was from Air Liquide America Specialty Gases LLC (Plumsteadville, PA, USA). Azotobacter vinelandii strains DJ995 (wild-type MoFe protein) and DJ884 (wild-type Fe protein) were grown and nitrogenase proteins were expressed as previously described.14 The wild-type MoFe protein with a seven-histidine tag on the α-subunit allowed for purification using a Zn affinity chromatography protocol.14 The wild-type Fe protein was purified using a previously described anion exchange and size exclusion protocol.15 Both proteins were purified to greater than 95% purity, confirmed by SDS-PAGE analysis using Coomassie blue staining, and were fully active. Proteins and buffers were handled anaerobically in septum-sealed serum vials under an argon atmosphere or on a Schlenk vacuum line. All transfers of gases and liquids were done with Hamilton gastight syringes. All samples in H2O buffer were prepared at pH = 7.3. The “D2O” samples were prepared at pD = 7.3 by exchanging and concentrating the MoFe protein into turnover buffer prepared with D2O at pH 6.9, as read by a pH meter.9
Preparation of EPR Samples
EPR samples were prepared in a solution containing a MgATP regeneration system (13 mM ATP, 15 mM MgCl2, 20 mM phosphocreatine, 2.0 mg/mL bovine serum albumin, and 0.3 mg/mL phosphocreatine kinase) in 200 mM MOPS buffer at pH or pD 7.3 with 50 mM dithionite under Ar. MoFe protein was added to a final concentration of ∼150 μM. Turnover conditions with a relatively high electron flux were initiated by the addition of Fe protein to a final concentration of ∼125 μM. After about 20 s incubation at room temperature, small aliquots of the reaction mixture were transferred into EPR tubes and rapidly frozen in liquid nitrogen.
Low-flux EPR samples were prepared in a reaction mixture containing a MgATP regeneration system as described above at pH 7.0. The MoFe protein concentration was ∼50 μM, while the Fe protein concentration was ∼0.5 μM, giving a Fe protein:MoFe protein ratio of 1:100.11,16 Turnover was initiated and samples transferred to EPR tubes followed by freezing in liquid nitrogen.
Cryoannealing and EPR
The cryoannealing protocol9 involves (i) rapid warming of a sample held at T ≤ 77 K to the temperature of annealing by immersion in a methanol bath held at that temperature; (ii) relaxation at the annealing temperature for the desired number of minutes; (iii) quench-recooling back to 77 K by immersion into liquid N2; (iv) transfer to the helium-temperature cryostat; and (v) collection of EPR spectra.
CW X-band EPR measurements were performed on an ESP 300 Bruker spectrometer equipped with an Oxford ESR 900 cryostat. Spectra with overlapping 1a, 1b, and 1c signals were decomposed following the procedures of Fisher et al.:13 spectra for the individual species were simulated with WINEPR SimFonia software and added so that their sum best matched the experimental spectrum.
Results
The E4 state was originally trapped7 by freezing a turnover mixture in which the V70I MoFe and Fe proteins were at approximately 1:1 molar ratio. This condition provides high electron flux for the reaction and favors highly reduced states. In the present study, we have repeated these studies with the wild-type enzyme. In addition, we have freeze-trapped mixtures tailored to exhibit the “low-flux” condition of turnover, so as to favor states that have accumulated few electrons: MoFe and Fe proteins are mixed in very unequal proportion, typically 100 MoFe per 1 Fe protein. It was anticipated that in such mixtures at steady state the MoFe protein would largely be distributed between the E0 and E1 states, with E2 in low abundance because relaxation to E0 by release of H2 would outcompete the formation of E2 and with negligible populations of more highly reduced states, E3 and E4.
EPR
EPR spectra of samples with MoFe:Fe protein ratios of ∼100:1 freeze-quenched at multiple times subsequent to the initiation of low-flux turnover showed that after ∼100 s the samples reach a steady state with approximately 40% of FeMo-co reduced from resting state E0 to EPR-silent state(s) (Figure SI). These samples exhibit no detectable signals from any EPR-active intermediates. In particular, they do not exhibit the high-spin signals 1b and 1c assigned previously (and see below) to multiply reduced FeMo-co or the low-spin signal from the E4 state. We infer that MoFe protein reaches a steady state involving only two states with significant populations, E0 and E1, under these conditions.
For studying the more highly reduced states of the cofactor, Ar-turnover samples were prepared in H2O and D2O buffer with a molar ratio of MoFe:Fe protein of 6:5. As shown in Figure 1A, both samples demonstrate not only a significant loss of the resting-state signal (designated 1a; g = [4.32, 3.66, 2.01]) but also the appearance of the high-spin signals, which have been observed previously and denoted as 1b (g = [4.21, 3.76, ∼1.97]) and 1c (g = [4.69, ∼3.20, ∼2]). The similar g-values of 1a and 1b signals and the low intensity of 1c do not allow direct measurement of the signals’ intensities. However, as shown by Fisher et al.,13 it is possible to decompose the overlapping EPR signals by simple simulation (Figure 1B). This procedure reveals that the accumulation of 1b and 1c is roughly independent of solvent isotope.
Figure 1.
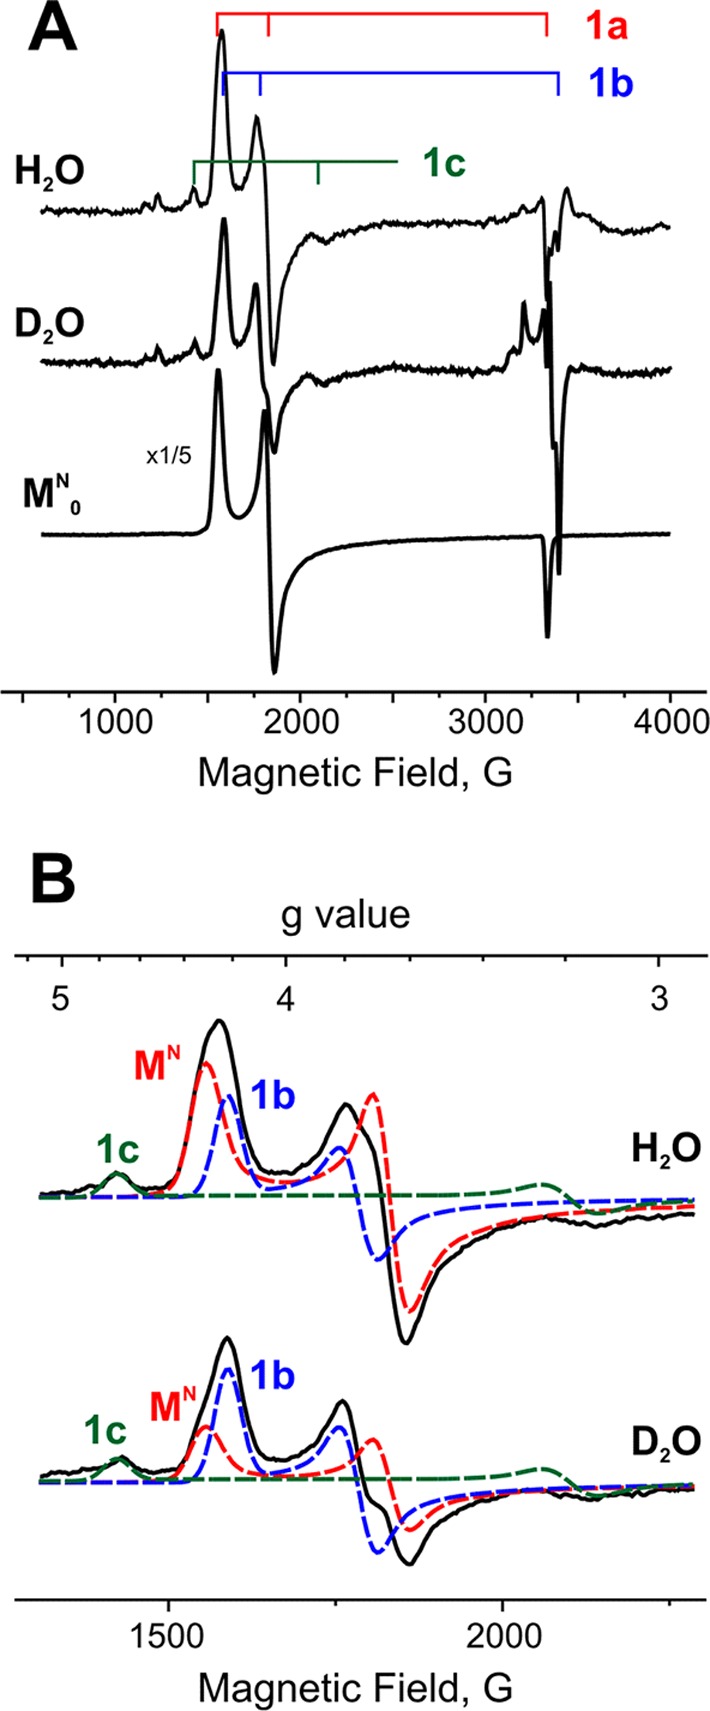
(A) EPR spectra of Ar-turnover samples trapped under high-flux conditions in H2O and D2O buffer; lower downscaled spectrum (×1/5) is control resting-state sample before turnover. Minor low-spin EPR species are discussed in the text. (B) Decompositionof high-spin EPR region into signals from species 1a (MN), 1b, and 1c in freeze-quenched H2O and D2O samples of high-flux Ar turnover before annealing. Conditions: temperature, 3.8 K; microwave frequency, 9.37 GHz; microwave power, 0.5 mW; modulation amplitude, 13 G; time constant, 160 ms; field sweep speed, 38 G/s.
The high-flux turnover EPR spectra also show multiple weak signals in the g-2 region. In addition to the signal from reduced Fe protein, samples prepared with either H2O or D2O solvents show weak signals from an S = 1/2 intermediate with rhombic g-tensor (g = [2.08, 1.99, 1.97]) generated during turnover N2,17 whose presence we attribute to low-level N2 contamination (<0.05 atm) during sample preparation; the contamination is greater and the signal is stronger in the D2O sample. In addition, there is a feature at g = 2.14, clearly seen in D2O, that corresponds to the signal from the S = 1/2 E4 intermediate described previously.7
For completeness, we note that no signal from the oxidized P cluster (S = 1/2)18 is seen under any turnover conditions, in agreement with earlier studies.13
Annealing
Low-Flux Turnover
Figure 2 presents results of annealing nitrogenase samples frozen during steady-state low-flux turnover under Ar, 3 min 45 s after mixing. Comparison of the freeze-quenched and control EPR spectra showed that in the turnover mixture 60% was in the E0 (resting) state and 40% was in the EPR-silent E1 state (Table 1, below). As can be seen, even after annealing for 3 h at −20 °C the resting-state signal did not significantly increase, whereas the E4 intermediate studied earlier relaxed with a half-time of ∼6 min,9 and as discussed below, the 1b and 1c signals formed under high flux relax even faster. These observations establish that the E1 state is stable in a frozen solution at this temperature and does not relax to the resting state. This finding confirms the hypothesis, which underpins the cryoannealing approach, that in the frozen solid the relaxation of an En intermediate state toward the resting state can occur only by the release of a stable reduction product from FeMo-co. In the case of turnover under Ar, the only product that can be released is H2, which carries two reducing equivalents. As a result, the E1 state, which has acquired only one equivalent, cannot return to the resting state during annealing.
Figure 2.
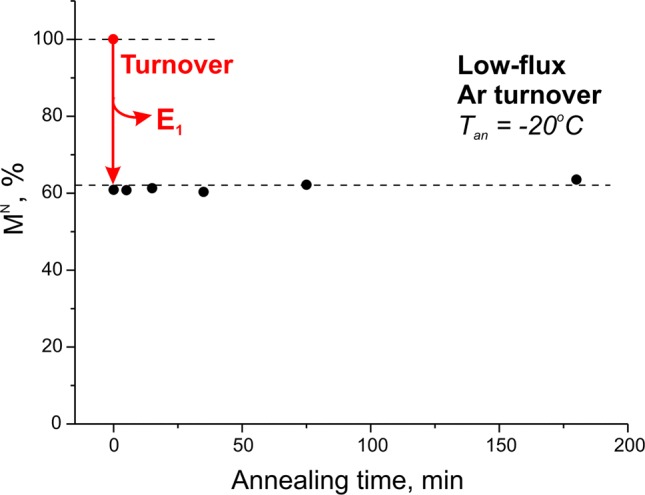
Intensity of resting-state (1a) FeMo-co EPR signal (g2 feature measured as peak-to-peak height), relative to control sample prior to turnover, during annealing at −20 °C of sample freeze-quenched under low-flux Ar turnover. Red arrow represents loss of 1a signal during steady-state turnover as seen upon freeze-quench, prior to annealing.
Table 1. Steady-State Populations of MoFe Protein States during Turnover under Ar.
| low-flux turnover | E0 | E1 | ||
|---|---|---|---|---|
| 60% | 40% | |||
| high-flux turnover | E0 | E1 + E3 | 1b + 1c (E2) | E4 |
|---|---|---|---|---|
| 17% | 56% | 27% | <1% |
High-Flux Turnover
The 1b and 1c signals observed in a sample trapped under high-flux conditions decay too rapidly during annealing of the frozen solid at −20 °C to obtain accurate kinetic measurements, so the decay of 1b and 1c and the recovery of resting state were monitored by annealing carried out at −30 °C instead, as illustrated in Figure 3. Decomposition of these spectra, as discussed above and displayed in Figure 1, shows that during annealing of a frozen H2O–buffer sample at −30 °C the 1b signal decays exponentially with a time constant, τ ≈ 20 min, that corresponds to the time constant for the appearance of the resting-state signal, indicating that 1b converts directly into the resting state, Figure 4. The same experiment with D2O gives τ ≈ 60 min for the 1b signal decay and 1a signal appearance, corresponding to a solvent kinetic isotope effect (sKIE) ≈ 3 for the relaxation of 1b to the resting state (Figure 4).
Figure 3.
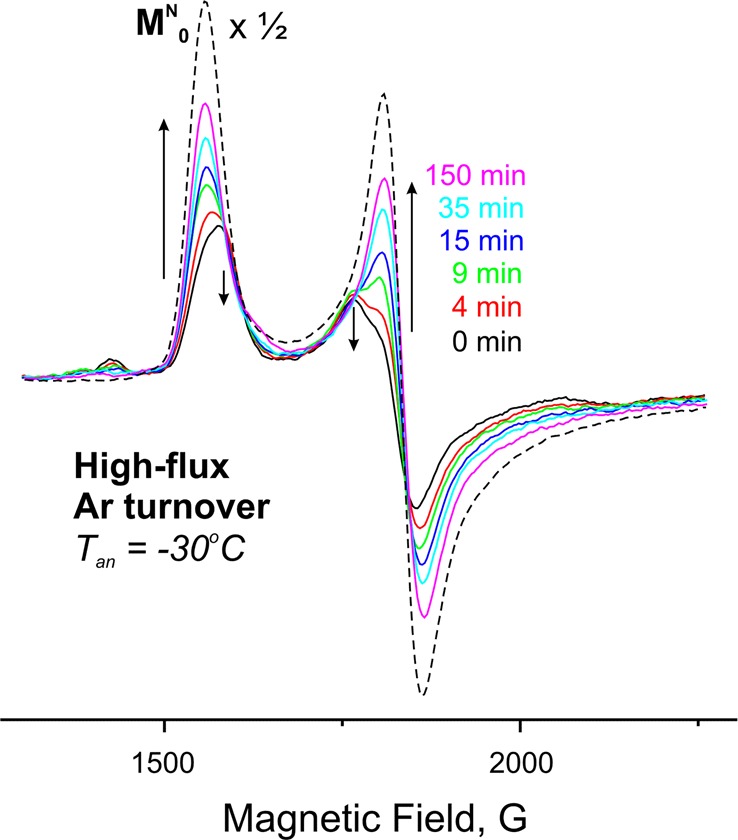
Representative spectra from among those obtained during annealing of the H2O high-flux Ar-turnover sample at −30 °C, showing changes in intensity of high-spin EPR signals. Spectra were decomposed into contributions from 1a and 1b as described in the text and illustrated in Figure 1. Downscaled (×1/2) dashed spectrum presents the resting-state control sample. Conditions: as described in Figure 1.
Figure 4.
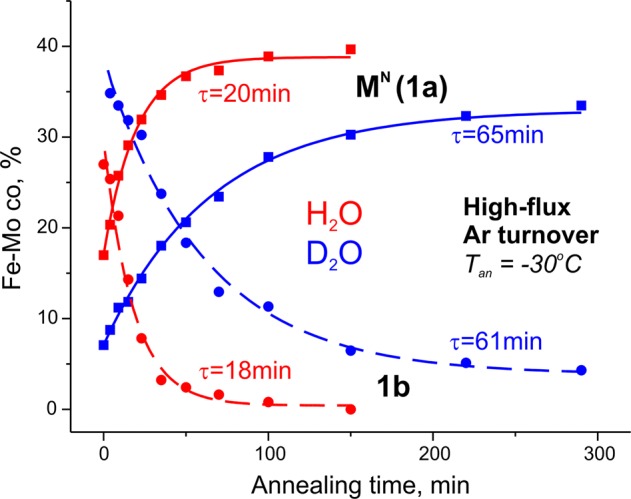
Kinetics of 1b and 1a signals during annealing at −30 °C for Ar-turnover samples prepared in H2O (red) and D2O (blue). Data points normalized as percentage by comparison with resting-state control and fitted as exponential decay for the 1b signal (dotted) and exponential rise for 1a (solid).
In our cryoannealing study of the E4 state of the V70I MoFe protein, E4 returned to the resting state in two discrete and well-resolved kinetic steps, each with a strong kinetic isotope effect, sKIE ≈ 3, indicative that each relaxation occurs with the formation and release of H2.9 The earlier studies that characterized 1b and 1c concluded that 1b is not a conformer of the resting state, but rather represents a reduced FeMo-co state.13 On this basis, the strong kinetic isotope effect observed during the conversion of 1b to 1a indicates that this relaxation occurs with the formation and release of H2. As the 1b signal originates from an EPR-active FeMo-co, this state could be formed only after an even number of electrons are delivered to the paramagnetic resting state FeMo-co, so 1b must be E2 or E4. The assignment of 1b as a high-spin E4 isomer in wild-type MoFe protein, not low-spin as in the V70I MoFe protein, is unlikely because relaxation of this E4 also would be expected to proceed through the resolved sequential release of two H2 molecules. We interpret the decay of 1b during annealing with the prompt formation of the 1a signal as implying an assignment of the 1b signal to the E2 state, which undergoes direct relaxation to E0/1a with the formation and release of H2.
Although the 1c EPR signal is weak, its relaxation kinetics could be studied as well. During annealing, 1c relaxes with about the same rate as the 1b signal relaxes and with an equivalently strong isotope effect, sKIE ≈ 4 (Figure 5). The sKIE again indicates release of H2 from a reduced EPR-active state En with formation of a less-reduced EPR-active state En–2. Because the 1c intensity is so low in comparison with 1b and 1a signals, the experimental results do not determine what species 1c converts to during annealing. However, given that 1b and 1c relax with the same decay constant, the obvious interpretation is that these two signals represent alternative conformations of E2, with both relaxing to E0 through release of H2.
Figure 5.
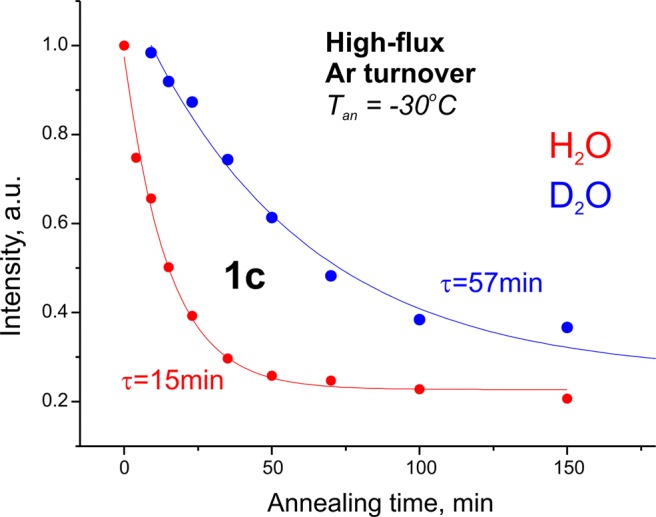
Decay of the 1c signal during the annealing experiment for H2O (red) and D2O (blue) samples of high-flux Ar turnover. Data points obtained as intensity of the g1 feature of the EPR signal are normalized to the maximum of the signal and fitted to an exponential decay function.
Formation of En, n = 1, 3, Intermediates during Higher-Flux Turnover
During annealing of both H2O and D2O turnover samples at −30 °C for 150 min, the resting state recovers to less than 50% of its value before turnover (Figure 3); an additional 5 h of annealing also did not produce significant signal recovery (not shown). The above confirmation that the E1 state cannot relax to resting state during cryoannealing shows that the MoFe protein that remains EPR-silent and does not relax to resting state must be in EPR-silent states, E1 and E3. E3 could relax to E1 by loss of H2, but E1 does not relax at −30 °C; thus, the fraction of the resting signal that does not recover can be assigned to the sum of the two EPR-silent (non-Kramers, S > 1, or diamagnetic) species, E1 + E3. The difference between the population of resting state (1a; E0) that remains after cryoannealing and that seen immediately after quenching then corresponds to the sum of the populations of the two states, 1b and 1c, with little of that attributable to 1c, given its weak EPR signal. Table 1 displays the resulting estimates of the steady-state distribution of FeMo-co among different redox states at low- and high-flux turnover conditions in H2O.
Discussion
The present study provides confirmation of the quench-cryoannealing protocol for determination of the reduction level, n, of a freeze-trapped intermediate. The hypothesis is that this protocol only allows relaxation toward the resting state by the release of a stable reduction product from FeMo-co and, thus by steps of an even number of reducing equivalents, implicitly predicts that states that have accumulated an odd number of electrons/protons (n = 1, 3) during turnover under Ar cannot relax to the E0 resting state: E3 can relax to E1, but E1 by itself cannot relax to E0 in the frozen state. Also implicit in this hypothesis is the requirement that in the frozen matrix the electron-transfer “disproportionation” between the two E1-state FeMo-co in a single MoFe protein does not occur over the hundreds of minutes of an annealing experiment, either because no MoFe protein contains two E1-state FeMo-co or because electron transfer cannot occur under these conditions. The present experiments have confirmed these predictions.
In contrast, in fluid solution, E1 can achieve a steady-state population because it can accept another electron/proton to form E2, which then can accept yet another electron/proton or can relax to E0 through release of H2. These results in turn confirm our assignment of the E4 intermediate through the use of the quench-cryoannealing protocol, the foundation of the proposed mechanism for nitrogenase catalysis.5,6
Comparison of steady-state populations during turnover under low and high electron flux, as monitored by the EPR signals from the freeze-quenched samples prior to annealing, as expected, shows a much smaller population of E0 under high flux (17%), compared to that at low flux (60%), Table 1, and slightly more of the EPR-silent states are trapped with higher flux (E1 + E3 = 56%) than with low flux (E1 = 40%). Not surprisingly, the biggest effect of high flux is to create a large population of the reduced states, 1b + 1c = 27%, and an extremely small, but detectable population of a state with a value of g1 that correspond to that previously found for E4.7
This study further gives insights into the identity of the En intermediate states giving rise to the 1b and 1c signals. It was indeed shown previously that the 1b signal corresponds to a reduced FeMo-co state (n ≥ 2) rather than a conformer of the FeMo-co in the S = 3/2 resting state and that 1c corresponds to a state at least as reduced as 1b.13 However attempts to simulate the kinetics of the appearance of the 1b signal during turnover were puzzling: the measurements could be best fitted by assigning the signal to the E3 state in the Lowe–Thorneley scheme, formed after three-electron transfers to the αβ dimer of MoFe protein. The difficulty, explicitly recognized by the authors, is that FeMo-co that has accumulated three electrons during turnover should have an even number of electrons, and thus the presence of a half-integer signal (S = 3/2), as observed, would require equal concentrations of another paramagnetic center in an E3 intermediate. As there is no such signal, in particular no signal from the oxidized P cluster, we conclude that 1b (and 1c) cannot be assigned to E3. The agreement of rates of relaxation of 1b and 1c with the rate of recovery of 1a/E0 strongly indicates that both 1b and 1c are E2. We have argued above that they do not correspond to the only other plausible alternative, high-spin conformers of E4 that relax to E2 with the measured time constant, with E2 then relaxing to E0. The results for the V70I MoFe protein strongly suggest that in such a case we would expect to accumulate E2 as a kinetic intermediate, as the earlier study showed that the E2 relaxation is much slower than that of E4, and this accumulation should be enhanced by the sKIE when relaxation is done in D2O.
Acknowledgments
This work was supported by the NIH (HL13531 to B.M.H.; GM59087 to L.C.S. and D.R.D.).
Supporting Information Available
This material is available free of charge via the Internet at http://pubs.acs.org.
The authors declare no competing financial interest.
Due to a production error, this paper was published on the Web on March 18, 2014, with the incorrect artwork for Figure 1. The corrected version was reposted on March 20, 2014.
Funding Statement
National Institutes of Health, United States
Supplementary Material
References
- Burgess B. K.; Lowe D. J. Chem. Rev. 1996, 96, 2983–3011. [DOI] [PubMed] [Google Scholar]
- Thorneley R. N. F.; Lowe D. J.. Kinetics and Mechanism of the Nitrogenase Enzyme in Molybdenum Enzymes; Spiro, T. G., ed.; Wiley-Interscience Publications: NY, 1985; pp 221–284. [Google Scholar]
- Wilson P. E.; Nyborg A. C.; Watt G. D. Biophys. Chem. 2001, 91, 281–304. [DOI] [PubMed] [Google Scholar]
- Yang Z.-Y.; Khadka N.; Lukoyanov D.; Hoffman B. M.; Dean D. R.; Seefeldt L. C. Proc. Natl. Acad. Sci. 2013, 110, 16327–16332. [DOI] [PMC free article] [PubMed] [Google Scholar]
- Hoffman B. M.; Lukoyanov D.; Yang Z.-Y.; Dean D. R.; Seefeldt L.. Chem. Rev. 2014, in press [DOI] [PMC free article] [PubMed]
- Hoffman B. M.; Lukoyanov D.; Dean D. R.; Seefeldt L. C. Acc. Chem. Res. 2013, 46, 587–595. [DOI] [PMC free article] [PubMed] [Google Scholar]
- Igarashi R. Y.; Laryukhin M.; Dos Santos P. C.; Lee H. I.; Dean D. R.; Seefeldt L. C.; Hoffman B. M. J. Am. Chem. Soc. 2005, 127, 6231–6241. [DOI] [PubMed] [Google Scholar]
- Lukoyanov D.; Yang Z.-Y.; Dean D. R.; Seefeldt L. C.; Hoffman B. M. J. Am. Chem. Soc. 2010, 132, 2526–2527. [DOI] [PMC free article] [PubMed] [Google Scholar]
- Lukoyanov D.; Barney B. M.; Dean D. R.; Seefeldt L. C.; Hoffman B. M. Proc. Natl. Acad. Sci. 2007, 104, 1451–1455. [DOI] [PMC free article] [PubMed] [Google Scholar]
- Yoo S. J.; Angove H. C.; Papaefthymiou V.; Burgess B. K.; Münck E. J. Am. Chem. Soc. 2000, 122, 4926–4936. [Google Scholar]
- Hageman R. V.; Burris R. H. Proc. Natl. Acad. Sci. 1978, 75, 2699–2702. [DOI] [PMC free article] [PubMed] [Google Scholar]
- Fisher K.; Lowe D. J.; Thorneley R. N. F. Biochem. J. 1991, 279, 81–85. [DOI] [PMC free article] [PubMed] [Google Scholar]
- Fisher K.; Newton W. E.; Lowe D. J. Biochemistry 2001, 40, 3333–3339. [DOI] [PubMed] [Google Scholar]
- Christiansen J.; Goodwin P. J.; Lanzilotta W. N.; Seefeldt L. C.; Dean D. R. Biochemistry 1998, 37, 12611–12623. [DOI] [PubMed] [Google Scholar]
- Seefeldt L. C.; Mortenson L. E. Protein Sci. 1993, 2, 93–102. [DOI] [PMC free article] [PubMed] [Google Scholar]
- Hageman R. V.; Burris R. H. J. Biol. Chem. 1979, 254, 1189–1192. [PubMed] [Google Scholar]
- Barney B. M.; Lukoyanov D.; Igarashi R. Y.; Laryukhin M.; Yang T.-C.; Dean D. R.; Hoffman B. M.; Seefeldt L. C. Biochemistry 2009, 48, 9094–9102. [DOI] [PMC free article] [PubMed] [Google Scholar]
- Tittsworth R. C.; Hales B. J. J. Am. Chem. Soc. 1993, 115, 9763–9767. [Google Scholar]
Associated Data
This section collects any data citations, data availability statements, or supplementary materials included in this article.


