Abstract
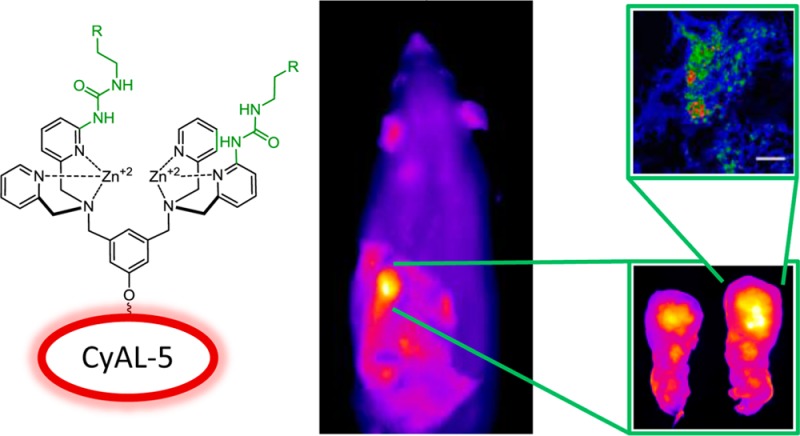
Zinc(II)-bis(dipicolylamine) (Zn-BDPA) coordination complexes selectively target the surfaces of dead and dying mammalian cells, and they have promise as molecular probes for imaging cell death. A necessary step toward eventual clinical imaging applications is the development of next-generation Zn-BDPA complexes with enhanced affinity for the cell death membrane biomarker, phosphatidylserine (PS). This study employed an iterative cycle of library synthesis and screening, using a novel rapid equilibrium dialysis assay, to discover a modified Zn-BDPA structure with high and selective affinity for vesicles containing PS. The lead structure was converted into a deep-red fluorescent probe and its targeting and imaging performance was compared with an unmodified control Zn-BDPA probe. The evaluation process included a series of FRET-based vesicle titration studies, cell microscopy experiments, and rat tumor biodistribution measurements. In all cases, the modified probe exhibited comparatively higher affinity and selectivity for the target membranes of dead and dying cells. The results show that this next-generation deep-red fluorescent Zn-BDPA probe is well suited for preclinical molecular imaging of cell death in cell cultures and animal models. Furthermore, it should be possible to substitute the deep-red fluorophore with alternative reporter groups that enable clinically useful, deep-tissue imaging modalities, such as MRI and nuclear imaging.
Introduction
The ability to noninvasively image dead and dying cells within a living subject is expected to facilitate preclinical research and personalized medical treatment.1 In diverse therapeutic areas like traumatic brain injury, heart attack, and autoimmune disease, the amount of cell death is an indicator of disease progression, whereas in other cases, such as oncology, the typical therapeutic goal is to selectively kill tumor cells. In principle, imaging methods that quantify the degree of cell death can be used to report the status of disease, or alternatively the efficacy of treatment. A wide range of cell death assays have been developed for cell culture and histopathology,2 and there is an ongoing community effort to translate these methods to the clinic.3−5 A large number of biomarkers have been identified for different cell death pathways, but only a subset are tractable targets for in vivo imaging of living subjects. The accessibility of cell surface biomarkers makes them especially attractive as imaging targets and a well-known example in cell death imaging is the anionic phospholipid, phosphatidylserine (PS).6−8
PS comprises roughly 2–10% of total cellular phospholipid in a typical mammalian cell plasma membrane,9 but the transmembrane distribution in most healthy cells is highly asymmetric such that PS is almost exclusively sequestered to the inner leaflet.10,11 A hallmark of most, if not all, cell death pathways is the appearance of PS in the outer leaflet of the plasma membrane, due to attenuation of the active transport systems that maintain the asymmetric transmembrane distribution.12 A promising strategy for in vivo imaging of dead and dying cells is to develop molecular imaging probes with selective affinity for anionic PS-rich membranes over the charge-neutral membrane surfaces of healthy cells.12,13 One of the best known molecular agents for PS imaging is Annexin V, a 35 kDa protein that associates strongly with PS-rich membranes in a Ca2+-dependent fashion (low nanomolar dissociation constant).13 While fluorescently labeled Annexin V has been employed very effectively in cell death microscopy and flow cytometry protocols, the development of suitably labeled versions for in vivo imaging remains an ongoing challenge after twenty years of international effort.14−17 Researchers have started to consider alternative molecules for PS targeting such as other classes of proteins,18−20 peptides,21−24 and small molecules.25,26 Our research lab has contributed to this effort by demonstrating that synthetic, low-molecular-weight zinc(II)-bis(dipicolylamine) (Zn-BDPA) coordination complexes have selective affinity for anionic membranes, including the surfaces of dead and dying mammalian cells.27−30 The selective targeting of Zn-BDPA probes is driven by a combination of electrostatic attraction to the anionic membrane and zinc cation coordination by the phosphate and carboxylate moieties of the PS headgroup. Effective cell death imaging using Zn-BDPA fluorescent probes has been achieved in a range of cell culture systems and small animal models of disease.29,30 In vivo imaging protocols with the current generation of fluorescent Zn-BDPA probes typically employs relatively high doses because the membrane affinity is modest (low micromolar dissociation constant).27 As a necessary step toward eventual clinical imaging applications, we are attempting to develop next-generation Zn-BDPA probes with enhanced PS affinity, so they can be employed as tracers.
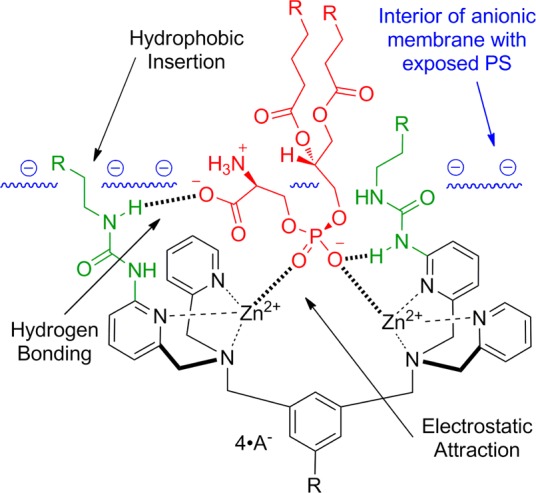
Recently, we reported that a multivalent Zn-BDPA fluorescent probe exhibited increased selectivity for PS-rich membranes and was an effective imaging agent in cell culture and three animal models of cell death.31,32 While the imaging results were impressive, the multivalent probe showed a tendency to undergo cross-linking and self-aggregation which can produce undesired pharmacokinetic properties. Another potential problem with multivalent probes for certain types of imaging applications is the increased molecular size, which may slow rates of diffusion into hindered target sites.17 Here, we describe an alternative but complementary design strategy that employs a single Zn-BDPA core scaffold, and attempts to enhance PS recognition by appending relatively small functional groups. As shown in Scheme 1, the primary coordination bonding with the two zinc cations is strengthened by additional secondary noncovalent interactions with the PS headgroup such as electrostatic attraction, hydrogen bonding, and hydrophobic insertion into the membrane.33,34 The molecular design concept of modified scaffolds has been used before to enhance binding affinity of Zn-BDPA structures to small, water-soluble phosphorylated target molecules such as inorganic phosphate,35−38 nucleoside polyphosphates,39 and phosphorylated peptides.40−42 However, there is no reported attempt to improve Zn-BDPA recognition of PS buried in a bilayer membrane. The strategy of designing modified Zn-BDPA scaffolds de novo using computer modeling was judged to be unreliable given the structural flexibility of the Zn-BDPA scaffold and the dynamic, amphiphilic properties of a target PS-rich bilayer membrane. Instead, we describe here a focused library approach that decorates a dipicolylamine core structure with various types and numbers of appended 2-amido substituents. More specifically, we have fabricated a 25-member library of modified Zn-BDPA library candidates and tested the affinity of each library candidate for PS-rich membranes using a novel rapid equilibrium dialysis assay. The screening identified two lead candidates, and one was converted into a deep-red fluorescent probe and evaluated in a series of FRET-based vesicle titration studies, cell microscopy experiments, and in vivo rat tumor biodistribution measurements. A tangible outcome of this study is disclosure of a next generation, deep-red fluorescent Zn-BDPA probe for enhanced molecular imaging of cell death.
Scheme 1. Illustration of the Putative Primary and Secondary Non-Covalent Interactions between a Phosphatidylserine Head Group (Red) Embedded in an Anionic Membrane Surface (Blue) and a Zn-BDPA Core Structure (Black) with Appended 2-Amido Substituents (Green).
Results and Discussion
Library Synthesis
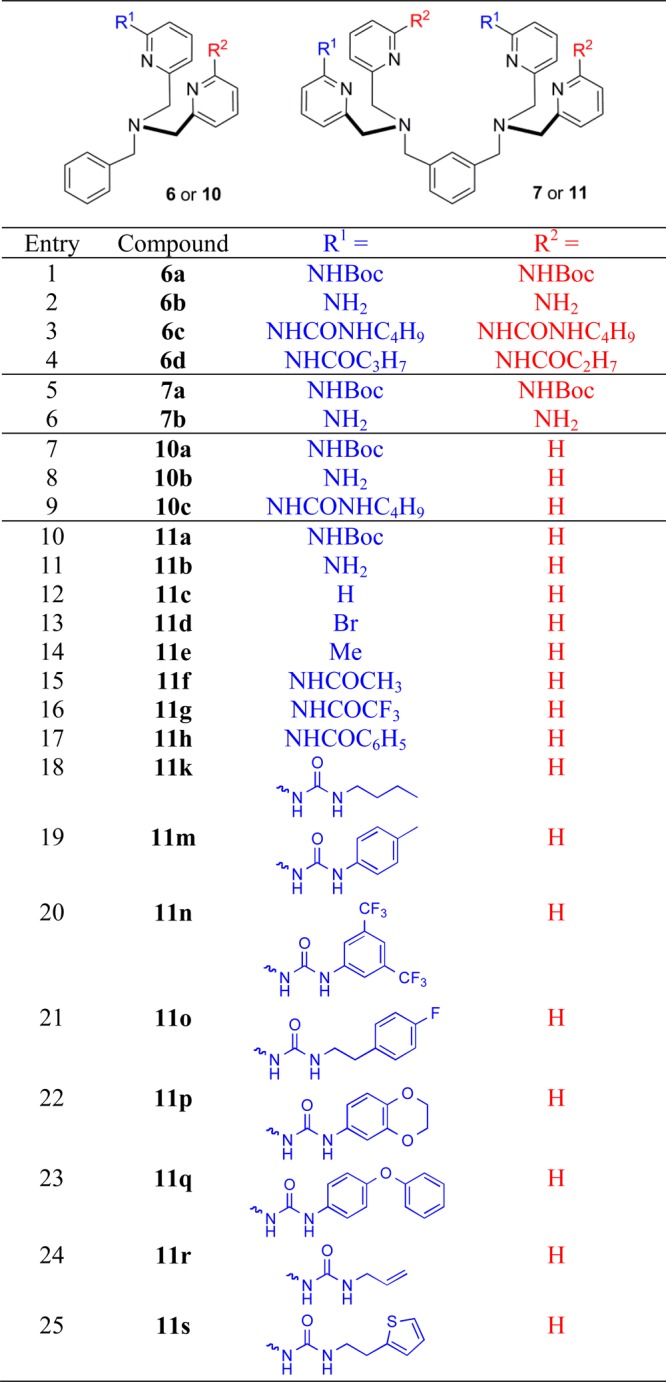
Shown in Chart 1 is a work flow diagram of the iterative process of library generation and screening for selective binding to PS-rich membranes. The three-step cycle involved: (1) synthesis of structurally modified Zn-BDPA compounds, (2) high throughput screening using a rapid equilibrium dialysis method, and (3) confirmation of membrane association ability for lead candidates. Chart 2 contains the entire list of 25 modified DPA scaffolds that were made, converted to zinc(II) complexes, and screened for membrane affinity. There are four sets of scaffolds: mono-DPA scaffolds with one or two appended 2-amido substituents (compounds 6 and 10) and bis-DPA scaffolds with two or four appended 2-amido substituents (compounds 7 and 11). The focus on 2-amido substituents was intentional because literature precedence suggested that the NH residues were likely to form attractive hydrogen bonds to the proximal oxyanion residues within the headgroup of a bound PS (Scheme 1).35−42
Chart 1. Library Generation and Screening.
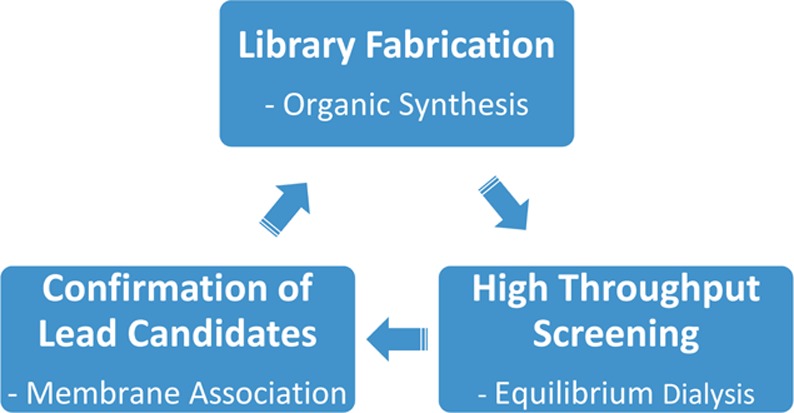
Chart 2. Library of Modified DPA Scaffolds.
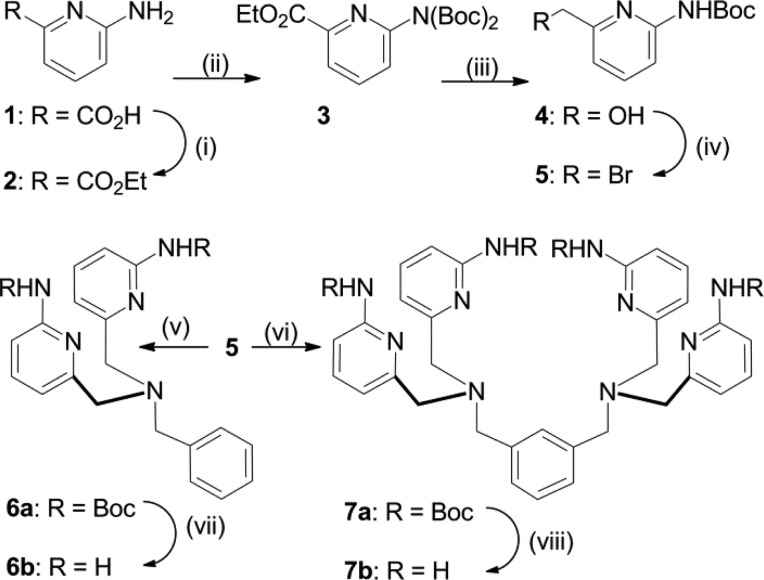
The synthetic pathways to make scaffolds 6 and 7 are described in Scheme 2. The synthesis of N-Boc-protected 2-aminopyridine 5 from commercially available 1 was accomplished in 4 steps and roughly 80% overall yield. Interestingly, when the N-Boc protection of 2 was initially carried out in the presence of 1.0 mol equiv of Boc2O, a statistical mixture of unprotected, monoprotected, and bis-protected products was obtained. To overcome this problem, an excess of Boc2O was employed and the product was isolated solely as the bis-N-Boc protected aminopyridine 3. It is noteworthy that mono-N-Boc deprotection occurs when the reduction of ethyl ester 4 to primary alcohol 5 is conducted using NaBH4 as the reducing agent and CaCl2 as a Lewis acid catalyst. Conversion of compound 5 into either N-Boc-protected aminopyridine 6a or 7a and subsequent deprotection with HCl in EtOAc yielded free aminopyridines 6b and 7b in modest yield. When the deprotection was attempted under standard DCM/TFA conditions, large amounts of decomposition were observed. The 2-aminopyridine group in 6b was successfully converted into derivatives 6c and 6d by reaction with the appropriate isocyanate or acid anhydride, respectively. In contrast, the same reactions with the more congested homologue 7b yielded a mixture of partially reacted products and none of the desired tetra-acylation product.
Scheme 2. Synthesis of Scaffolds 6a–b and 7a–b.
Reagents and conditions: (i) SOCI2, EtOH, 91%; (ii) DMAP, Boc2O, Acetone,tBuOH, 91%; (iii) NaBH4, CaCI2, EtOH, 98%; (iv) PPh3, CBr4, K2CO3, DCM, O °C → rt, 97%; (v) Benzylamine, DMF, DIPEA, 50 °C, 92%; (vi) m-Xylylenediamine, DIPEA, DMF, 50 °C, 71%; (vii) HCI, EtOAc, 75%; (viii) HCI, EtOAc, 57%.
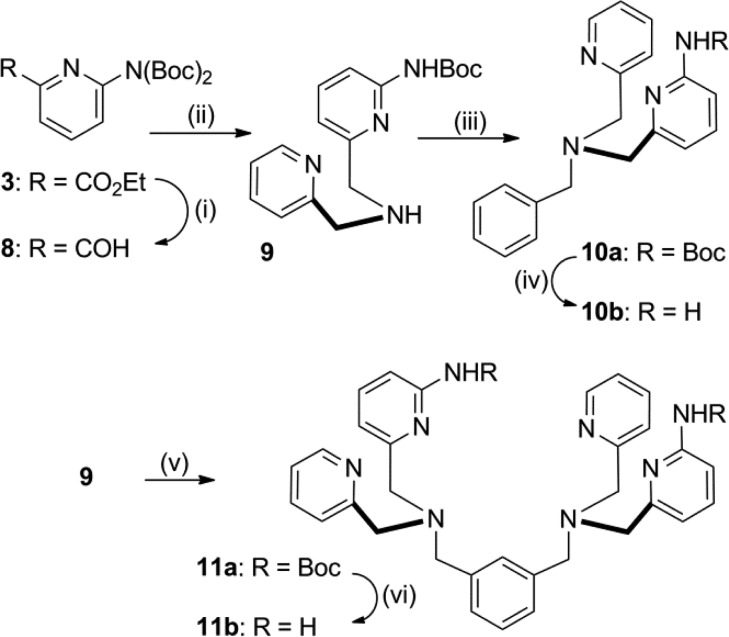
The synthetic pathways to make scaffolds 10 and 11 are described in Scheme 3. The key intermediate 9 was obtained in 4 steps with roughly 50% overall yield. The reduction of ethyl ester 3 to aldehyde 8 yielded a mixture of mono- and bis-N-Boc products that were purified for characterization but used in synthesis as a mixture of products. Reductive amination of aldehyde 8 in the presence of CaCl2 produced the mono-N-Boc protected aminopyridine 9 which was converted to either 10a or 11a in good yield. N-Boc deprotection was carried out using HCl in EtOAc to yield aminopyridines 10b and 11b, which were reacted with the appropriate acid anhydrides and isocyanates to yield 10c and 11f–s. The syntheses of related analogues 11d–e is described in the Supporting Information. Each of the modified DPA scaffolds in Chart 2 was converted to the corresponding Zn2+ complex and then screened for ability to associate with PS-rich vesicles.
Scheme 3. Synthesis of Scaffolds 10a–b and 11a–b.
Reagents and conditions: (i) DIBAL-H, DCM, −78 °C, 81%; (ii) 2-Picolylamine, CHCI3; MeOH, NaBH4, 70%; (iii) Benzyl bromide, CHCI3, DIPEA, 86%; (iv) HCI, EtOAc, 67%; (v) m-Xylene dibromide, CHCI3, DIPEA, 96%; (vi) HCI, EtOAc, 83%.
Library Screening
There are few literature assays that measure association of small molecules to a model membrane system.47 The most common is the solid phase adherence assay that fabricates a target membrane by adsorbing phospholipids to the interior surfaces of plastic microwell plates.48 In our hands, this assay was not reproducible, and we were not confident that the membranes formed by the surface adsorption process were biologically relevant. Therefore, we searched for a high throughput screening method using vesicles.47 After some experimentation, we developed a rapid equilibrium dialysis (RED) assay using a commercially available apparatus that consisted of two compartments, source and receiver, separated by a microporous dialysis membrane (8000 molecular weight cutoff) that we confirmed was impermeable to 200-nm-diameter vesicles.49 As illustrated by the schematic cartoon in Figure 1, the assay assessed the ability of each library member to be trapped by vesicles on one side of the dialysis membrane. More specifically, each assay was started by adding a solution of PS-rich vesicles composed of POPC:Cholesterol:POPS, 65:25:10 (mimic of dead/dying cell membranes) to the ‘source’ compartment and a single member of the Zn-BDPA library (12.5 μM) to the ‘receiver’ compartment. The system was allowed to equilibrate at 37 °C for 16 h and the Zn2+ concentration in each compartment was determined using a colorimetric indicator. Validation experiments showed that the ratio of Zn2+ concentrations was a measurable surrogate for the ratio of Zn-BDPA concentration (see Supporting Information). The results of the RED screening are presented in Figure 1 as the ratio value, [Zn2+]Receiver/[Zn2+]Source, such that lower values represent increased affinity for PS-rich vesicles; the blue line corresponds to the value for compound 11c, the original unmodified Zn-BDPA. While the complete screening data set is shown in Figure 1, the work actually progressed as an iterative process of four sublibrary synthesis and screening cycles (Chart 1). From this screening data two lead candidates, 11k and 11o, were identified. It is worth noting that both compounds have two ureido substituents with hydrophobic butyl or phenethyl groups, and we infer that the enhanced affinity for PS-rich vesicles is driven by a combination of multiple hydrogen bonding interactions with the PS headgroup and partial hydrophobic insertion into the membrane (Scheme 1).
Figure 1.
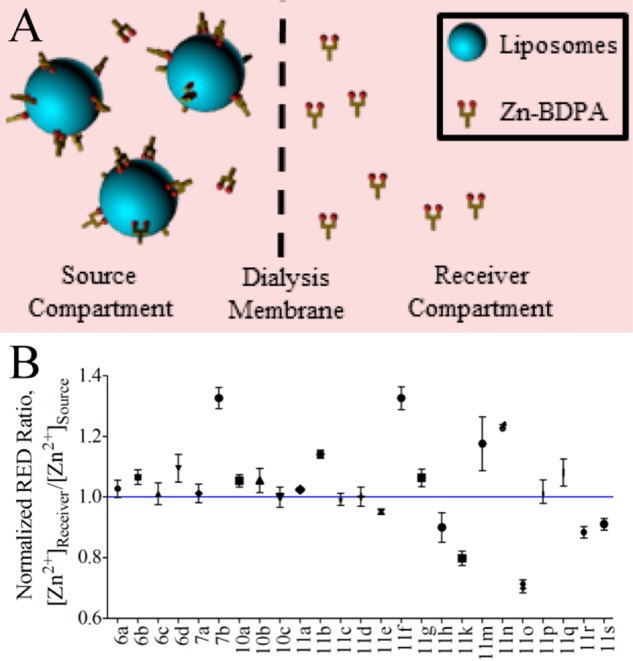
Schematic cartoon of the high throughput RED assay (A). RED screening results for the 25 member library of modified Zn-DPA compounds relative to the original unmodified compound, 11c (B). A low [Zn2+]Receiver/[Zn2+]Source ratio indicates compounds that have relatively high affinity for PS-rich vesicles.
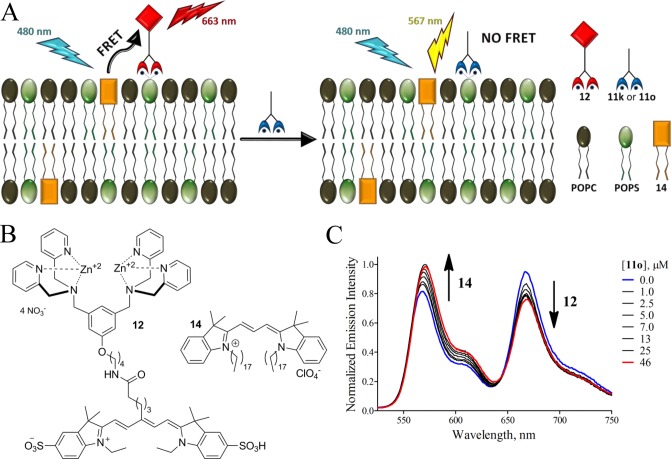
The next step in the screening process was to confirm affinity to PS-rich membranes and assess membrane selectivity. Two methods were investigated. The first approach simply repeated the RED assay measuring the equilibrium position in the presence of different amounts of either PS-rich vesicles (POPC:Cholesterol:POPS, 65:25:10) or PC vesicles (POPC:Cholesterol, 25:75; mimics of healthy cells) such that association constants for library candidates 11k and 11o could be determined. Direct comparison of association constants for PS-rich and PC vesicles serves as an indicator of probe selectivity for dead/dying vs healthy cells. These vesicle association experiments are summarized in the Supporting Information and they show that the RED assay was able to effectively measure membrane affinity for different membrane compositions. However, a significant drawback was the need to conduct multiple RED measurements which limited throughput and consumed expensive resources. In order to quickly confirm high affinity to PS-rich membranes, while only using small amounts of the precious lead candidates, we developed the fluorescence resonance energy transfer (FRET) displacement assay that is illustrated in Figure 2. The assay utilizes FRET from a lipophilic fluorescence energy donor dye 14 that is embedded in the membrane to fluorescent probe 12 as an energy acceptor associated with the vesicle exterior.43 Displacement of 12 from the vesicle surface due to preferential binding of a modified Zn-BDPA compound leads to disruption of the FRET and a diagnostic ratiometric change in fluorescence emission, as shown in Figure 2C. A standard method for fitting competitive displacement data was used to determine the dissociation constants in Table 1 (titration curves and data treatment are shown in Figures S4 and S5). The measured dissociation constants for 11k and 11o are 51 ± 6 nM and 37 ± 8 nM, respectively.45 The chemical structure of 11o was judged to be the most promising for further development as an effective deep-red fluorescent probe for biological imaging.
Figure 2.
Schematic cartoon of the FRET displacement assay (A). Chemical structures of fluorescence energy acceptor 12 and lipophilic energy donor 14 (B). Emission profile for the FRET displacement experiment using anionic PS-rich vesicles (POPS:POPC:14, 50:49:1) and lead candidate 11o (C).
Table 1. Dissociation Constants of Various Zn-BDPA Compounds from PS-Richa and PC Vesiclesb in HEPES Bufferc at 25 °C.
| compound | Kd PS-rich vesicles, nMf | Kd PC vesicles, nMf |
|---|---|---|
| 12d | 133 ± 35 | 360 ± 60 |
| 13d | 39 ± 6 | 190 ± 31 |
| 11ke | 51 ± 6 | -- |
| 11oe | 37 ± 8 | -- |
PS-Rich vesicles were composed of POPS:POPC:14, 50:49:1.
PC vesicles were composed of POPC:14, 99:1.
HEPES buffer = 10 mM HEPES, 137 mM NaCl, 3.2 mM KCl, 1.0 mM Zn(NO3)2·6H2O, pH 7.4.
Kd determined using a FRET titration assay.
Kd determined using a FRET displacement assay.
Uncertainty is standard deviation from the mean for experiments performed in at least triplicate.
Fluorescent Probe Synthesis and Screening
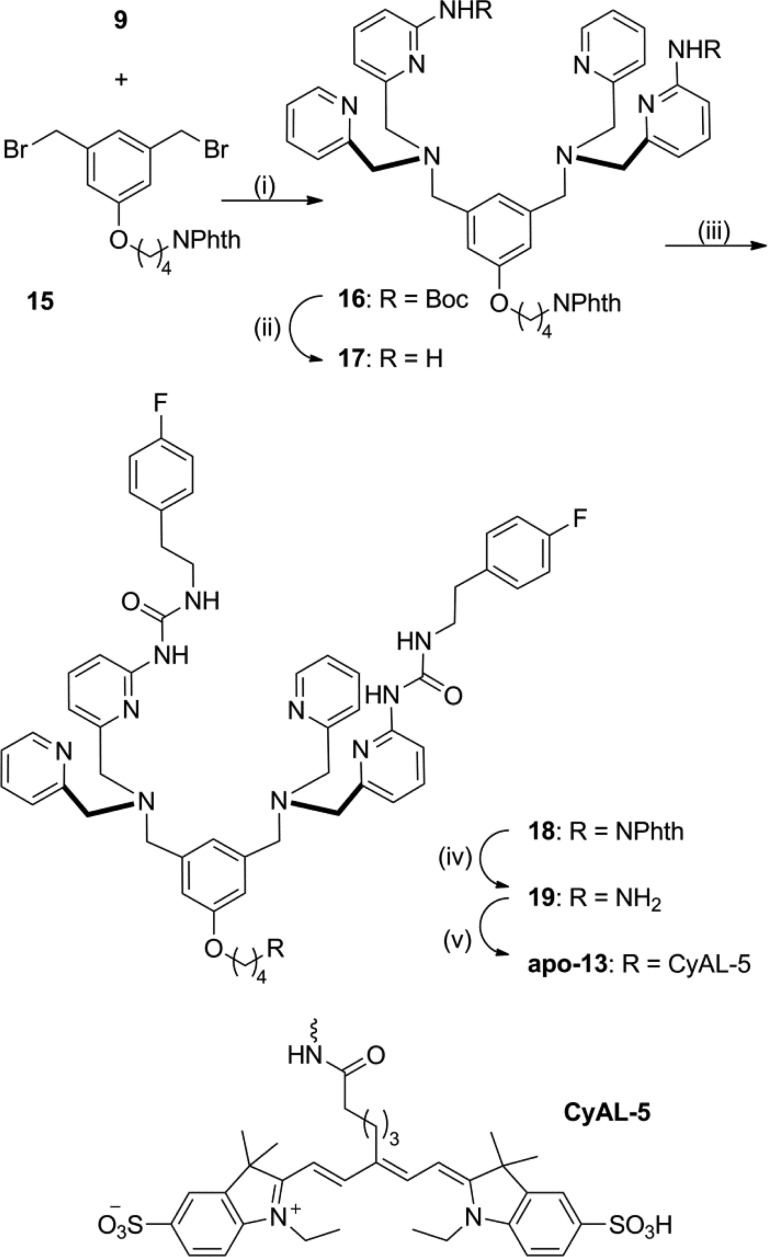
Library candidate 11o was conjugated to the deep-red fluorophore CyAL-5 to make the fluorescent probe 13.43 As shown in Scheme 4 the building block 15(27) was alkylated with the modified DPA 9 to provide scaffold 16. Removal of the N-Boc protecting group produced 17, which was subsequently reacted with 4-fluorophenethyl isocyanate to yield 18. Treatment of 18 with hydrazine monohydrate effectively removed the phthalimide protecting group and produced primary amine 19 which was condensed with CyAL-5 to make apo-13 in high yield (93% for the dye conjugation step; see Chart S2 for chemical structure of CyAL-5). Purification and Zn2+ complexation provided the fluorescent probe 13 (Figure 3). The photophysical properties of 13 (Figure S7 and Table S1) are typical for a deep-red fluorescent cyanine dye. To ensure good solubility of stock solutions for bioimaging studies, probe 13 was formulated as an aqueous solution with a small fraction of DMSO.
Scheme 4. Synthesis of Modified Fluorescent Probe 13.
Reagents and conditions: (i) DIPEA, MeCN, 24%; (ii) EtOAc, HCI, 97%; (iii) 4-fluorophenethyl isocyanate, CHCI3, 80%; (iv) H2NNH2, DCM, ElOH, 42%; (v) CyAL-5, DSC, DMF, 24 h; 19, DMF, TEA, 48 h, 93%.
Figure 3.
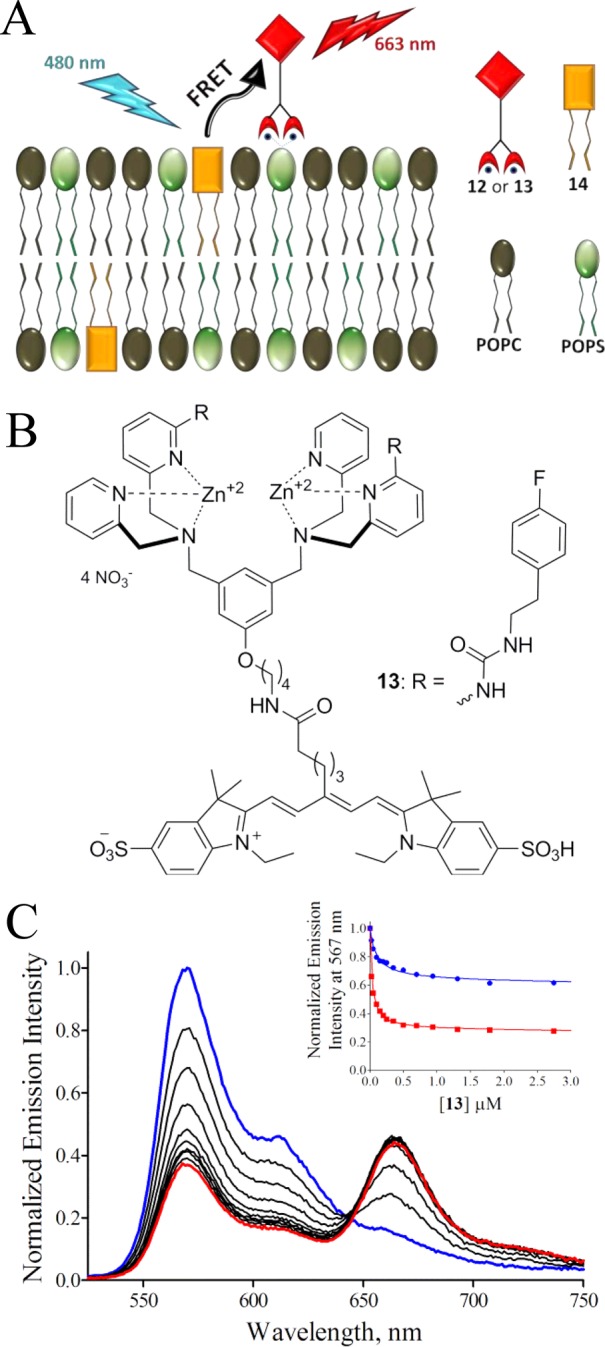
Schematic cartoon of the FRET titration assay (A). Chemical structure of 13 (B). FRET profiles for titration of PS-rich vesicles (10 μM total lipid; POPS:POPC:14, 50:49:1) and 13 (C). FRET titration curves for either PS-rich (10 μL total lipid; POPS:POPC:14, 50:49:1; red squares) or PC vesicles (10 μL total lipid; POPC:14, 99:1; blue circles) and 13 (C-inset).
The membrane affinity and selectivity of unmodified Zn-BDPA 12 and modified Zn-BDPA 13 were evaluated using the FRET titration assay in Figure 3. Similar to the displacement system above, the assay measures quenching of membrane embedded, energy donor dye 14 caused by FRET to acceptor probe 12 or 13 on the vesicle surface. The derived association constants are listed in Table 1. The data shows that modified fluorescent probe 13 (Kd = 39 ± 6 nM) has the same affinity for PS-rich membranes as the Zn-BDPA targeting group 11o (Kd = 37 ± 8 nM) indicating that the attached CyAL-5 fluorophore acts only as a reporter group and does not affect membrane association. A comparison of dissociation constants for modified Zn-BDPA 13 and unmodified 12 reveals that 13 has a 3-fold higher affinity for PS-rich vesicles than 12 and also slightly higher selectivity over PC vesicles. Taken together, the vesicle studies indicate that modified fluorescent probe 13 targets PS-rich membranes over PC membranes better than the unmodified fluorescent probe 12. The next step of the research was to compare probe fluorescence imaging performance in cell culture and living animals.
Cell Studies
A standard cell vitality assay showed that probes 12 and 13 are not toxic to mammalian cells (MDA-MB-231 and CHO-K1) when present at <25 μM (Figure S8), which is much lower than the concentration needed for biological imaging. This result agrees with the lack of toxicity seen in previously published cell and animal imaging studies using fluorescent Zn-DPA probes.28,30,32
Cell microscopy studies employed cultures of mammalian cells (MDA-MB-231 and CHO-K1). Samples of dead/dying cells were generated by treatment with etoposide, a small molecule topoisomerase inhibitor that is known to induce apoptosis and necrosis. After treatment with etoposide (5 μM) for 16 h, or media for healthy cells, the separate cell samples were incubated with 10 μM of either probe 12 or 13, and subjected to epifluorescence microscopy. As shown by the representative micrographs in Figure 4, there was slight staining of healthy cells by either fluorescent probe, but clear evidence of much stronger probe targeting to dead/dying cells. Furthermore, the staining of dead/dying cells by probe 13 was much stronger than the staining by probe 12. Additional microscopy studies using culture mixtures of healthy and dead/dying cells showed selective targeting of probe 13 to the morphologically distinct dead/dying cells (Figure S9). Flow cytometry was used to unambiguously verify the discrimination of dead/dying cells from healthy cells. In Figure 5 are overlaid histogram plots of three separate samples of CHO-K1 cells: healthy unstained cells (orange), healthy cells stained with probe 13 (red), and etoposide treated cells stained with 13 (blue). The histograms show that probe 13 can quantify the fraction of etoposide treated cells that are either dead/dying or healthy.
Figure 4.
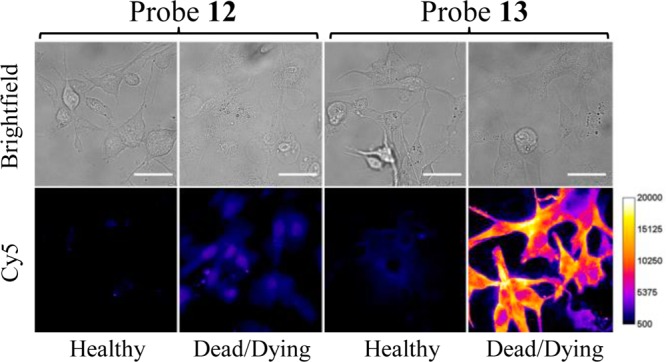
Fluorescence micrographs (Bright field = top; Cy5 = bottom) of healthy or dead/dying MDA-MB-231 cells stained with 10 μM of either 12 (left two panels) or 13 (right two panels). The dead/dying cells were treated with etoposide (5 μM) for 16 h, then incubated with 10 μM of probe for 30 min at 37 °C and washed with HEPES buffer. Scale bar = 25 μm.
Figure 5.
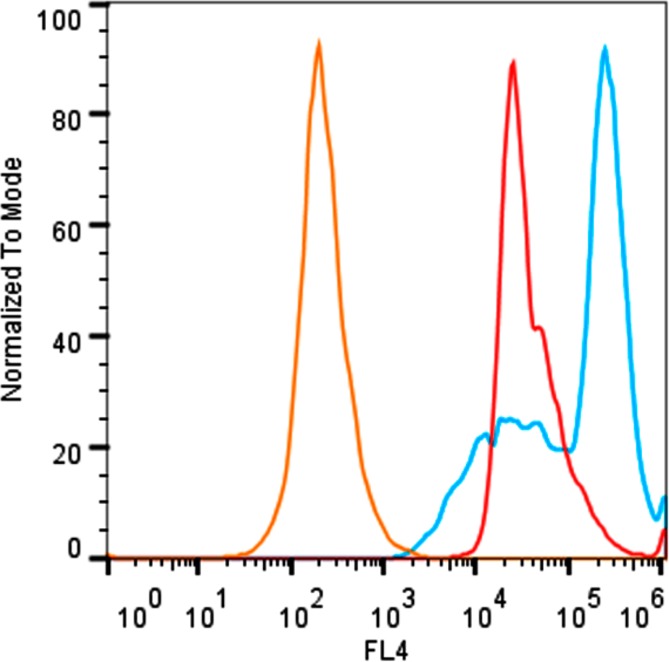
Combined histogram plot depicting flow cytometry results for different populations of CHO-K1 cells; unstained healthy cells (orange), healthy cells stained with 10 μM of 13 (red), and cells treated with etoposide (15 μM, 13 h) then stained with 10 μM of 13 (blue).
A final point with the cell microscopy studies concerns the cellular location of the probe staining. Protein-derived fluorescent probes like Annexin V do not readily penetrate the plasma membranes of apoptotic cells; thus, they can be used in co-staining protocols to distinguish early stage apoptotic cells from necrotic cells.13 Likewise, previous microscopic studies of fluorescent Zn-BDPA probes have shown that they localize at the periphery of apoptotic cells.32 In contrast, the micrographs of dead/dying cells stained with probe 13 (Figure 4) suggest that the probe permeates into the cytosol, a conclusion supported by additional confocal microscopic imaging (Figure S10). However, probe 13 does not enter the cell nucleus, a targeting feature that was confirmed with co-staining studies using a blue-emitting nucleic acid stain (Figure S11). The ability of probe 13 to enter necrotic cells is expected since the cells have a compromised plasma membrane. The permeation of 13 into apoptotic cells is unusual but perhaps not surprising, because the two lipophilic phenethyl ureido groups promote membrane insertion.
Animal Studies
The ability to target dead/dying cells in a living animal was assessed by determining probe biodistribution in a rat subcutaneous tumor model that is known to develop necrotic foci. Previous studies have demonstrated that this an effective animal model for testing cell death targeting performance of fluorescent Zn-BDPA probes.30,32,50 In this present case, the biodistributions of untargeted deep-red CyAL-5 dye, unmodified probe 12, and modified probe 13 were determined in tumor-bearing rats and control rats without tumors. The subcutaneous tumors were prepared by injecting PAIII prostate cancer cells into the right flank of each animal and allowing 14 days for tumor growth and development of a necrotic tumor core. Each cohort was given a tail vein injection of one of the three fluorescent probes (3.0 mg/kg) in water (10% DMSO). The animals were euthanized 24 h later and biodistributions were determined by imaging the excised tissues using a planar fluorescence imaging station with a deep-red filter set (λex = 590 nm, λem = 670 nm). The biodistribution graphs in Figures S12 and S13 show that the untargeted CyAL-5 dye cleared rapidly from the body with no significant tumor accumulation. In comparison, there was much higher tissue retention of probes 12 and 13, with the unmodified probe 12 clearing equally through kidney and liver, and the modified probe 13 clearing primarily through the liver. Most importantly, tumor accumulation of probe 13 was 3-fold higher than probe 12 (Figure 6). The spatial distribution of each probe within the resected tumors was determined by slicing the tumors in half along the longest axis and acquiring fluorescent images of the interior-facing surfaces. As shown by the representative images in Figure 7, the probe distribution was localized at the necrotic core of the tumor.30 Microscopic imaging of thin histological tumor slices confirmed that the deep-red fluorescence of probes 12 and 13 colocalized with the tumor’s necrotic regions (Figure 8). Thus, there is strong evidence that probes 12 and 13 target the dead and dying cells in the tumor tissue, and the 3-fold higher accumulation of probe 13 correlates with its higher affinity for the PS biomarker that is exposed on the dead/dying cell surface.
Figure 6.
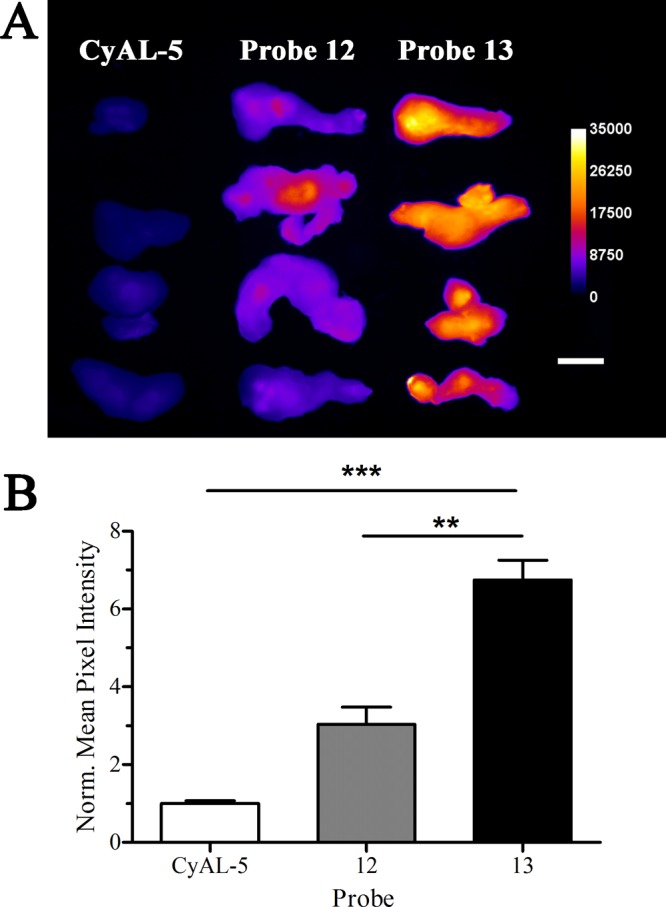
Ex vivo fluorescence images of excised rat prostate tumors from animals sacrificed 24 h after intravenous dosing (3.0 mg/kg) with deep-red CyAL-5 dye, probe 12, or probe 13 (A). Mean pixel intensities for the tumors normalized to the value for CyAL-5 (B). Error bars are standard error of the mean. N = 4, **P ≤ 0.01, ***P ≤ 0.001. Length scale bar = 1 cm.
Figure 7.
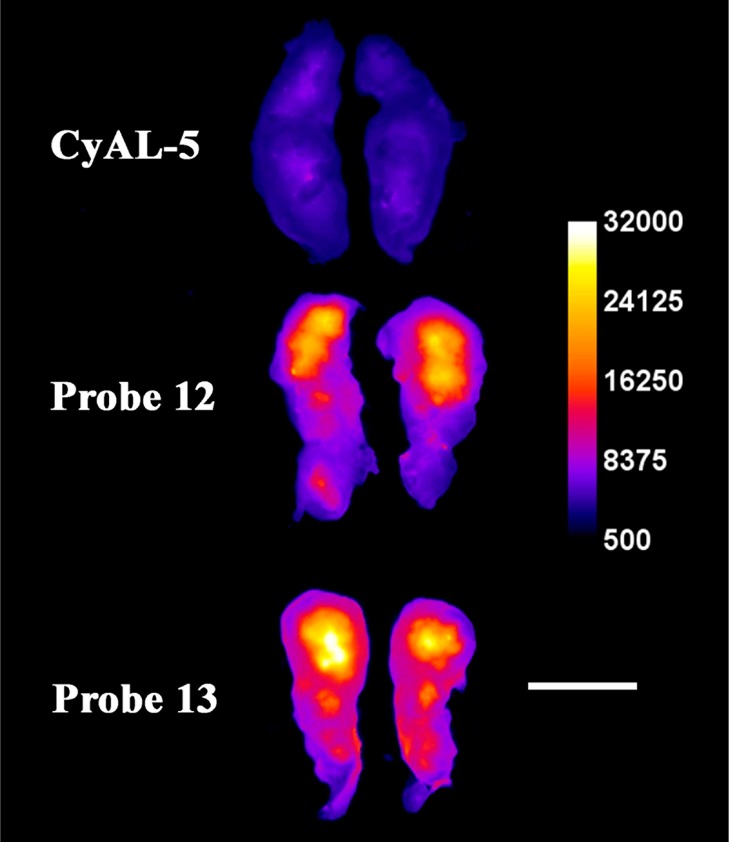
Representative ex vivo, deep-red fluorescence images of excised and sliced rat prostate tumors from animals sacrificed at 24 h after intravenous dosing with deep-red CyAL-5 dye, probe 12, or probe 13 (3.0 mg/kg). Each tumor is sliced along the longest axis with the core of the tumor facing the camera. The fluorescence intensity scale bar applies to all images (arbitrary units). Length scale bar = 1 cm.
Figure 8.
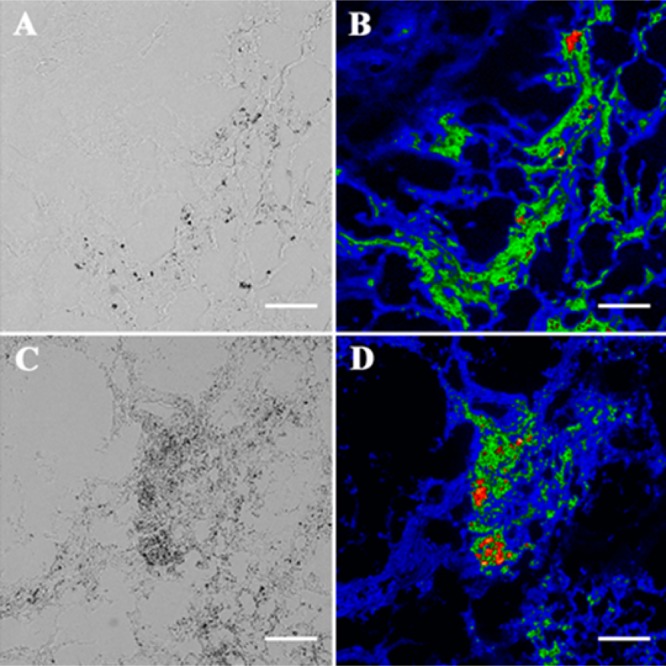
Coregistered micrographs of histological slices (5 μm) of tumor core; the brightfield images (A, C) show necrotic cells as darker regions that colocalize with deep-red fluorescence emission of probe 12 (B) and probe 13 (D). Scale bar = 130 μm.
Conclusions
An iterative cycle of library synthesis and screening enabled the discovery of two modified Zn-BDPA structures, 11k and 11o, that have enhanced affinity for bilayer membranes that contain the cell death membrane biomarker PS. The screening utilized a novel rapid equilibrium dialysis (RED) assay to identify lead structures with high affinity for PS-rich vesicles. Structure 11o was chosen for further testing and conjugated with a CyAL-5 fluorophore to make the deep-red fluorescent probe, 13. The targeting and imaging performance of modified probe 13 was compared with the unmodified control probe 12. The evaluation process included a series of FRET-based vesicle titration studies, cell microscopy experiments, and in vivo rat tumor biodistribution measurements. In all cases, the modified probe 13 exhibited comparatively higher affinity and selectivity for the target membranes. It is notable that the RED assay using PS-rich vesicles in buffer was an accurate screen for identifying modified Zn-BDPA structures with enhanced affinity for dead/dying cells in culture and dead/dying tissue in a living animal.
A tangible outcome of this study is disclosure of 13 as a next-generation deep-red fluorescent probe for preclinical molecular imaging of cell death in cell cultures and animal models. It should be possible to substitute the deep-red fluorophore with alternative reporter groups that enable clinically useful, deep-tissue imaging modalities, such as MRI and nuclear imaging.51 The structure of the targeting group 11o contains two lipophilic phenethyl ureido groups and it appears that they facilite probe permeation into the cytosol of dead/dying cells. Thus, the targeting group, 11o, may have value as a lead structure for further development as a drug delivery agent that can selectively target and permeate dying mamallian cells.52
Experimental Procedures
Materials and General Methods
All of the chemicals were of reagent grade and were used as purchased. Reactions were monitored by TLC analysis using 250 μm glass backed silica gel plates (SiliaPlate TLC, Silicycle, Quebec City, Canada) and compounds were visualized by UV light (254 and 365 nm). Flash column chromatography was carried out using either alumina (Aluminum Oxide, neutral, ∼150 mesh, Sigma-Aldrich, St. Louis, MO, USA) or silica gel (SiliaFlashP60, 230–400 mesh, Silicycle, Quebec City, Canada). Both 1H and 13C NMR (300, 500, or 600 MHz) spectra were acquired using a nondeuterated solvent peak as an internal reference. High-resolution mass spectra (HRMS) were recorded using electrospray ionization. Rapid equilibrium dialysis (RED) experiments were performed using a single-use rapid equilibrium dialysis apparatus equipped with 8K MWCO membranes (Thermo Scientific Pierce, Rockford, IL, USA; product number 90006). Compound 14, 1,1′-dioctadecyl-3,3,3′,3′-tetramethylindocarbocyanine perchlorate, was purchased from Life Technologies (Grand Island, NY, USA).
Synthetic Procedures
2. Thionyl chloride (2.63 mL, 36.2 mmol) was added to a stirred solution of 6-aminopyridine-2-carboxylic acid (2.31 g, 16.7 mmol) in EtOH (60 mL) at 0 °C. After being allowed to stir for 30 min at 0 °C, the reaction mixture was refluxed for 12 h. The reaction mixture was cooled to room temperature and solvent was removed under reduced pressure. Water was added to the crude residue and the pH was adjusted to 9 upon addition of saturated sodium bicarbonate. The reaction mixture was extracted with chloroform twice and the organic layers were dried over MgSO4. Solvent was removed to yield the product (2.55 g, 91% yield) as a yellow oil without the need for further purification. 1H NMR (300 MHz, CDCl3) δ 1.28 (t, J = 7 Hz, 3H), 4.29 (q, J = 7 Hz, 2H), 5.35 (s, 2H), 6.57 (d, J = 8 Hz, 2H), 7.31 (d, 7 Hz, 1H), 7.38 ppm (t, J = 7.8 Hz, 1H); 13C NMR (300 MHz, CDCl3) δ 14.5, 61.7, 113.0, 115.2, 138.3, 146.3, 159.2, 165.7 ppm; HRMS (ESI, CH3CN): m/z = 167.0833 ([M+H+]).
3. To a solution of 2 (9.31 g, 56.0 mmol) in tBuOH (200 mL) and acetone (70 mL) was added DMAP (100 mg, 750 μmol) and Boc2O (24 g, 110 mmol). The reaction mixture was allowed to stir at room temperature overnight. The reaction mixture was poured into water and extracted with hexanes. The organic layer was dried over MgSO4. The residue was purified by silica gel column chromatography with 4:1 Hexane:EtOAc as the eluent to yield the desired product as a white powder (18.58 g, 91%). 1H NMR (300 MHz, CDCl3) δ 1.41 (t, J = 7 Hz, 3H), 1.46 (s, 18H), 5.55 (q, J = 7 Hz, 2H), 7.47 (d, J = 8 Hz, 1H), 7.87 (t, J = 8 Hz, 1H), 8.04 (d, J = 8 Hz, 1H) ppm; 13C NMR (300 MHz, CDCl3) δ 14.5, 28.1, 62.1, 83.6, 120.1, 123.5, 124.9, 138.8, 147.5, 151.1, 152.5 ppm; HRMS (ESI, CH3CN): m/z = 367.1866 ([M+H+]).
4. To a mixture of 3 (3.64 g, 9.97 mmol) and CaCl2 (2.19 g, 19.7 mmol) in EtOH (25 mL) was added NaBH4 (1.14 g, 30.1 mmol) at 0 °C. After stirring for 2 h at 0 °C H2O was added to the reaction mixture. The reaction mixture was extracted three times with chloroform and the organic layer was dried over Na2SO4. The crude residue was purified by silica gel column chromatography with 1:1 Hexane:EtOAc as the eluent to yield the desired product as a clear oil (2.20 g, 97%). 1H NMR (300 MHz, CDCl3) δ 1.52 (s, 9H), 3.77 (br s, 1H, OH), 4.65 (s, 2H), 6.91 (d, J = 8 Hz, 1H), 7.54 (br s, 1H, NH), 7.65 (t, J = 8 Hz, 1H), 7.82 (d, J = 8 Hz, 1H) ppm; 13C NMR (300 MHz, CDCl3) δ 28.4, 64.0, 81.4, 110.8, 115.2, 139.2, 151.3, 152.5, 157.7 ppm; HRMS (ESI, CH3CN): m/z = 247.1084 ([M+Na+]).
5. To a solution of 4 (1.90 g, 5.86 mmol), CBr4 (5.64 g, 16.9 mmol), and K2CO3 (3.51 g, 25.4 mmol) in anhydrous dichloromethane (60 mL) at 0 °C was added by dropwise addition a solution of PPh3 (4.44 g, 16.9 mmol) in anhydrous dichloromethane (60 mL). The reaction mixture was allowed to warm to room temperature while stirring overnight. The reaction mixture was filtered to remove any insoluble material. The crude residue was purified by silica gel column chromatography with 1:1 Hexane:EtOAc as the eluent to yield the desired product as a clear oil (2.22 g, 97% yield). 1H NMR (300 MHz, CDCl3) δ 1.50 (s, 9H), 4.41 (s, 2H), 7.05 (d, J = 8 Hz, 1H), 7.58 (br s, NH, 1H), 7.64 (t, J = 8 Hz, 1H), 7.86 (d, J = 8 Hz, 1H) ppm; 13C NMR (300 MHz, CDCl3) δ 28.4, 33.7, 81.3, 111.9, 118.1, 139.4, 151.9, 152.4, 155.0 ppm; HRMS (ESI, CH3CN): m/z = 309.0220 ([M+Na+].
6a. To a solution of 5 (100 mg, 350 μmol) in DMF (2 mL) was added benzylamine (19 μL, 170 μmol) and DIPEA (25 μL, 140 μmol). The reaction mixture was heated to 50 °C and was allowed to stir overnight under argon. Solvent was removed and the residue was dissolved in CHCl3 and washed three times with water. The organic layer was dried over MgSO4 and the crude product was purified using alumina column chromatography with 100% CHCl3 as the eluent to yield the desired product as a pale yellow oil (80.8 mg, 92% yield). 1H NMR (500 MHz, CDCl3) δ 1.51 (s, 18H), 3.70 (s, 6H), 7.23–7.26 (m, 3H), 7.32 (t, J = 8 Hz, 2H), 7.41 (d, J = 8 Hz, 2H), 7.58 (br s, NH, 2H), 7.65 (t, J = 8 Hz, 2H), 7.80 (d, J = 8 Hz, 2H) ppm; 13C NMR (500 MHz, CDCl3) 28.5, 58.5, 59.5, 81.1, 96.2, 110.6, 117.7, 127.3, 128.6, 129.1, 138.8, 151.4, 152.7 ppm; HRMS (ESI, MeCN): m/z = 520.2931 ([M+H]+).
6b. To a solution of 6a (71 mg, 140 μmol) in EtOAc (3 mL) was added HCl (1 mL) at 0 °C. The reaction mixture was allowed to warm to room temperature while stirring overnight. Concentration NaOH (50% w/v) was used to neutralize the reaction mixture. The product was extracted using EtOAc and the organic layer was dried of MgSO4. The crude material was purified using alumina gel column chromatography with 0–2% MeOH:CHCl3 as the eluent to yield the desired product as a dark yellow oil (32.6 mg, 75% yield). 1H NMR (600 MHz, CDCl3) δ 3.62 (s, 4H), 3.67 (s, 2H), 4.41 (br s, NH, 4H), 6.34 (d, J = 7 Hz, 2H), 6.98 (d, J = 7 Hz, 2H), 7.21 (t, J = 7 Hz, 1H), 7.29 (t, J = 7 Hz, 2H), 7.39–7.41 (m, 4H) ppm; 13C NMR (600 MHz, CDCl3) δ 58.4, 59.7, 106.7, 112.4, 126.9, 128.2, 128.8, 138.3, 139.2, 157.8, 158.3 ppm; HRMS (ESI, MeCN): m/z = 320.1897 ([M+H]+).
7a. To a solution of 5 (300 mg, 1.0 mmol) in DMF (6 mL) was added m-xylylenediamine (28 μL, 210 μmol) and DIPEA (100 μL, 570 μmol). The reaction mixture was heated to 50 °C and was allowed to stir overnight under argon. Solvent was removed and the residue was dissolved in CHCl3 and was washed three times with water. The organic layer was dried over MgSO4 and the crude product was purified using silica gel column chromatography with 100% CHCl3 as the eluent to yield the desired product as a pale yellow solid (143.0 mg, 70% yield). 1H NMR (500 MHz, CDCl3) δ 1.37 (s, 36H), 3.53 (s, 4H), 3.69 (s, 8H), 7.06–7.12 (m, 7H), 7.56 (t, J = 8 Hz, 4H), 7.79 (d, J = 8, 4H), 7.92 (s, 1H), 8.38 (s, 4H) ppm; 13C NMR (500 MHz, CDCl3) 28.4, 57.5, 59.8, 80.7, 110.7, 118.0, 127.7, 127.9, 130.9, 138.8, 152.0, 152.8, 158.1 ppm; HRMS (ESI, MeCN): 961.5320 ([M+H]+).
7b. To a solution of 7a (130 mg, 140 μmol) in EtOAc (2 mL) was added HCl (1.0 mL) at 0 °C. The reaction mixture was allowed to warm to room temperature while stirring overnight. Concentration NaOH (50% w/v) was used to neutralize the reaction mixture. The product was extracted using EtOAc and the organic layer was dried of MgSO4. The crude material was purified using alumina gel column chromatography with 0–5% MeOH:CHCl3 as the eluent to yield the desired product as a dark yellow oil (44.4 mg, 57% yield). 1H NMR (600 MHz, CDCl3) δ 3.52 (s, 8H), 3.62 (s, 4H), 6.41 (d, J = 7 Hz, 4H), 6.90 (d, J = 7 Hz, 4H), 7.19–7.23 (m, 2H), 7.38 (t, J = 7 Hz, 4H), 7.57 (s, 1H), 7.89 (s, 1H) ppm; 13C NMR (600 MHz, CDCl3) δ 58.5, 59.4, 107.2, 111.3, 127.6, 128.7, 131.3, 138.6, 139.3, 157.4, 159.2 ppm; HRMS (ESI, MeCN). m/z = 561.3209 ([M+H]+).
8. DIBAL-H (3 mL, 1 M toluene solution) was added to a solution of 3 (500 mg, 1.36 mmol) in anhydrous DCM (7 mL) at −78 °C (dry ice/acetone) under argon gas and the mixture was allowed to stir for 3 h. The reaction was quenched upon addition of MeOH (1 mL) and 20% potassium sodium tartrate (10 mL). Upon warming to room temperature the reaction mixture was washed with DCM and the organic layer was dried over Na2SO4. The crude product was purified by silica gel column chromatography with 0–10% EtOAc:Hexanes as the eluent to yield the desired mono-N-Boc product as a clear oil (150 mg, 50% Yield, Rf = 0.35, SiO2, 10% EtOAc/hexanes). The bis-N-Boc product was also obtained as a clear oil (134 mg, 31% yield, Rf = 0.23, SiO2, 10% EtOAc/hexanes). An overall 80% yield was observed for both aldehyde products. Mono-N-Boc: 1H NMR (300 MHz, CDCl3) δ 1.51 (s, 9H), 7.62 (dd, J = 8 Hz, 1 Hz, 1H), 7.85 (t, J = 8 Hz, 1H), 8.05 (br s, NH, 1H), 8.23 (d, J = 8 Hz, 1H), 9.91 (s, 1H) ppm; 13C NMR (500 MHz, CDCl3) δ 28.3, 81.8, 117.1, 117.3, 139.4, 150.9, 152.5, 152.8, 192.7 ppm; HRMS (ESI, MeCN): m/z = 245.0921 ([M+Na]+). Bis-N-Boc: 1H NMR (500 MHz, CDCl3) δ 1.46 (s, 18H), 7.56 (d, J = 6 Hz, 1H), 7.86 (d, J = 6 Hz, 1H), 7.93 (t, J = 6 Hz, 1H), 9.97 (s, 1H) ppm; 13C NMR (500 MHz, CDCl3) δ 28.0, 83.8, 119.8, 125.8, 139.1, 151.1, 151.9, 152.9, 192.7 ppm; HRMS (ESI, MeCN): m/z = 345.1450 ([M+Na]+).
9. To a stirred solution of 8 (100 mg, 450 μmol) in CHCl3 (4 mL) at room temperature was added 2-picolylamine (47 μL, 450 μmol). NMR was used to monitor reaction progress. After stirring for 30 min, NaBH4 (61 mg, 1.6 mmol) and MeOH (1 mL) were added, and the reaction mixture was allowed to stir for an additional 3 h. The reduction was quenched by addition of H2O (2 mL). Organic solvents were removed under reduced pressure and the reaction mixture was extracted three times with chloroform; the organic layer was dried over Na2SO4. The crude product was purified using silica gel column chromatography with 0–10% MeOH:EtOAc as the eluent to yield the desired product as a pale yellow oil (98.9 mg, 70%). 1H NMR (500 MHz, CDCl3) δ 1.46 (s, 9H), 2.60 (br s, NH, 1H), 3.81 (s, 2H), 3.91 (s, 2H), 6.92 (d, J = 7 Hz, 1H), 7.10 (dd, J = 5, 8 Hz, 1H), 7.28 (t, J = 8 Hz, 1H), 7.54–7.59 (m, 3H), 7.74 (d, J = 8 Hz, 1H), 8.51 (d, J = 6 Hz, 1H) ppm; 13C NMR (500 MHz, CDCl3) δ 28.4, 54.3, 54.8, 80.8, 110.4, 116.9, 122.0, 122.4, 136.5, 138.6, 149.4, 151.6, 152.5, 158.0, 159.8 ppm; HRMS (ESI, CH3CN): m/z = 315.1836 ([M+H+], m/z = 337.1659 ([M+Na+].
10a. To a stirred solution of 9 (160 mg, 500 μmol) in CHCl3 (5 mL) was added DIPEA (50 μL, 290 μmol) and benzyl bromide (55.0 μL, 460 μmol). The reaction mixture was allowed to stir overnight at room temperature. Solvent was removed and the crude material was purified using silica gel column chromatography with 0–2% MeOH:CHCl3 as the eluent to yield the desired product as a dark yellow oil (161.7 mg, 86% yield). 1H NMR (500 MHz, CDCl3) δ 1.50 (s, 9H), 3.67 (s, 2H), 3.68 (s, 2H), 3.83 (s, 2H), 7.13 (dq, J = 1, 7 Hz, 1H), 7.20–7.25 (m, 2H), 7.31 (t, J = 7 Hz, 2H), 7.36 (br s, NH, 1H), 7.40 (s, 1H), 7.41 (s, 1H), 7.59–7.67 (m, 3H), 7.77 (d, J = 5 Hz, 1H), 8.50–8.52 (m, 1H) ppm; 13C NMR (500 MHz, CDCl3) δ 28.5, 58.6, 59.6, 60.2, 81.1, 110.5, 117.7, 122.2, 123.0, 127.4, 128.6, 129.1, 136.8, 138.8, 149.2, 151.4, 152.6 ppm; HRMS (ESI, MeCN): m/z = 405.2289 ([M+H]+).
10b. To a solution of 10a (160 mg, 390 μmol) in EtOAc (5 mL) was added HCl (1.5 mL) at 0 °C. The reaction mixture was allowed to warm to room temperature while stirring overnight. Concentration NaOH (50% w/v) was used to neutralize the reaction mixture. The product was extracted using EtOAc and the organic layer was dried of MgSO4. The crude material was purified using silica gel column chromatography with 0–5% MeOH:CHCl3 as the eluent to yield the desired product as a dark yellow oil (79.8 mg, 67% yield). 1H NMR (600 MHz, CDCl3) δ 3.64 (s, 2H), 3.69 (s, 2H), 3.81 (s, 2H), 4.59 (br s, NH, 2H), 6.38 (d, J = 8 Hz, 1H), 6.96 (d, J = 8 Hz, 1H), 7.13 (t, J = 6 Hz, 1H), 7.22 (t, J = 7 Hz, 1H), 7.30 (t, J = 7 Hz, 2H), 7.41–7.44 (m, 3H), 7.63–7.67 (m, 2H), 8.50 (d, J = 6 Hz, 1H) ppm; 13C NMR (600 MHz, CDCl3) δ 58.7, 59.2, 60.0, 107.4, 112.3, 122.1, 122.9, 127.2, 128.4, 128.9, 136.7, 138.9, 139.2, 148.9, 157.6, 158.1, 160.0 ppm; HRMS (ESI, MeCN): m/z = 305.1743 ([M+H]+).
11a. To a solution of α,α′-dibromo-m-xylene (150.4 mg, 570 μmol) in CHCl3 (20 mL) was added DIPEA (0.30 mL, 1.72 mmol) and 9 (391.0 mg, 1.24 mmol). The reaction mixture was allowed to stir at room temperature overnight. The resulting solution was washed once with water and the organic layer was dried over MgSO4. The crude residue was purified by column chromatography with 0–20% MeOH:CHCl3 as the eluent to yield the desired product as a white solid (400 mg, 96% yield). 1H NMR (500 MHz, CDCl3) δ 1.28 (s, 18H), 3.57 (s, 4H), 3.75 (s, 4H), 3.79 (s, 4H), 7.09–7.18 (m, 7H), 7.50 (d, J = 4 Hz, 4H), 7.64 (t, J = 8 Hz, 2H), 7.85 (d, J = 8 Hz, 2H), 7.96 (s, 1H), 8.47 (d, J = 5 Hz, 2H), 8.98 (br s, NH, 2H) ppm; 13C NMR (500 MHz, CDCl3) δ 28.3, 57.9, 59.7, 60.6, 80.5, 110.7, 118.1, 122.2, 123.2, 127.8, 130.6, 136.5, 138.9, 139.4, 148.9, 152.5, 152.9, 158.1, 160.0 ppm; HRMS (ESI, MeCN): m/z = 731.4054 ([M+H]+).
11b. To a solution of 11a (400 mg, 550 μmol) in EtOAc (15 mL) at 0 °C was added concentrated HCl (5.4 mL). The reaction mixture was allowed to warm to room temperature while stirring overnight. The pH was adjusted to 10 with saturated Na2CO3 and the product was extracted with EtOAc. The organic layer was dried over MgSO4 and solvent was removed under reduced pressure. The crude residue was purified by column chromatography with 0–10% MeOH:EtOAc as the eluent to yield the desired product as a brown oil (239 mg, 83% yield). 1H NMR (500 MHz, CDCl3) δ 3.63 (s, 4H), 3.67 (s, 4H), 3.81 (s, 4H), 4.47 (br s, NH, 4H), 6.34 (d, J = 8 Hz, 2H), 6.98 (d, J = 7 Hz, 2H), 7.12–7.13 (m, 2H), 7.23–7.29 (m, 3H), 7.38 (t, J = 7 Hz, 2H), 7.51 (s, 1H), 7.58–7.64 (m, 4H), 8.50–8.52 (m, 2H) ppm; 13C NMR (500 MHz, CDCl3) δ 58.7, 60.0, 60.3, 106.9, 112.7, 122.1, 122.9, 127.7, 128.4, 129.3, 136.6, 138.5, 139.3, 149.1, 158.0, 158.4, 160.3 ppm; HRMS (ESI, MeCN): m/z = 531.2988 ([M+H]+).
12. Compound 12 is commercially available (Molecular Targeting Technologies Inc.; West Chester, PA, USA) and can be prepared following literature procedures.43
apo-13. To a solution of CyAL-5 (11.5 mg, 17.2 μmol, purchased from Molecular Targeting Technologies Inc., Philadelphia, USA) in anhydrous DMF (175 μL) was added triethylamine (35 μL, 250 μmol) and N,N′-disuccinimidyl carbonate (17.4 mg, 67.9 μmol). The reaction mixture was protected from light and allowed to stir under argon at room temperature for 24 h. To the reaction mixture was added a solution of 19 (29.4 mg, 31.0 μmol, 1.8 equiv) dissolved in DMF (200 μL). The reaction mixture was protected from light and allowed to stir under argon at room temperature for 48 h. Solvent was removed under reduced pressure and the crude material was purified using preparatory TLC methods (silica gel preparatory TLC plate, 80:20:2 CHCl3:MeOH:NH4OH as the mobile phase, redeveloped 3 times to achieve good separation) to yield the desired product as a blue solid (24.4 mg, 89% yield). 1H NMR (600 MHz, DMSO-d6) δ 1.23 (t, J = 6 Hz, 6H), 1.42–1.49 (m, 4H), 1.60–1.66 (m, 4H), 1.67 (s, 12H), 2.12 (t, J = 6 Hz, 2H), 2.70 (t, J = 6 Hz, 4H), 3.01–3.05 (m, 2H), 3.14–3.16 (m, 2H), 3.39 (q, J = 6 Hz, 4H), 3.41 (s, 4H), 3.51 (s, 4H), 3.64 (s, 4H), 3.85 (t, J = 6 Hz, 2H), 4.15–4.18 (m, 4H), 6.15 (d, J = 12 Hz, 2H), 6.74 (s, 2H), 6.99 (s, 1H), 7.00–7.05 (m, 10H), 7.16–7.22 (m, 6H), 7.27 (d, J = 12 Hz, 2H), 7.45 (d, J = 12 Hz, 2H), 7.54 (t, J = 6 Hz, 2H), 7.63 (d, J = 6 Hz, 2H), 7.68 (t, J = 6 Hz, 2H), 7.80 (br s, NH, 2H), 8.13 (d, J = 12 Hz, 2H), 8.45 (d, J = 12 Hz, 2H), 9.22 (br s, NH, 2H) ppm; HRMS (ESI, MeCN): m/z = 1598.6975 ([M-H]−).
15. Compound 15 was prepared using literature procedures.27
16. To a solution of 9 (500 mg, 1.59 mmol) and DIPEA (0.5 mL, 2.87 mmol) in MeCN (20 mL) was added 15 (348 mg, 720 μmol). The reaction mixture was allowed to stir overnight under nitrogen. Solvent was removed and the residue was dissolved in CHCl3 and was washed three times with water. The organic layer was dried over MgSO4 and the crude product was purified using silica gel column chromatography with a gradient of 50% hexanes in EtOAc to 10% MeOH in EtOAc as the eluent to yield the desired product as a brown oil (164.1 mg, 24% yield). Unreacted starting material (9) was recycled after purification (217 mg, 43% recovery). 1H NMR (500 MHz, CDCl3) δ 1.29 (s, 18H), 1.79–1.89 (m, 4H), 3.53 (s, 4H), 3.72 (s, 4H), 3.74 (t, J = 7 Hz, 2H), 3.78 (s, 4H), 3.94 (t, J = 7 Hz, 2H), 6.69 (s, 2H), 7.10 (t, J = 7 Hz, 2H), 7.12 (d, J = 7 Hz, 2H), 7.462 (s, 1H), 7.51–7.52 (m, 4H), 7.63 (t, J = 7 Hz, 2H), 7.68–7.70 (m, 2H), 7.81–7.84 (m, 4H), 8.47 (d, J = 7 Hz, 2H), 8.77 (br s, NH, 2H); 13C NMR (500 MHz, CDCl3) δ 25.6, 26.9, 28.3, 37.9, 58.1, 59.7, 60.6, 67.3, 80.6, 110.6, 113.8, 118.1, 122.2, 122.8, 123.2, 123.5, 132.3, 134.2, 136.5, 138.9, 140.7, 149.0, 152.3, 152.9, 158.1, 158.8, 160.1, 168.7; HRMS (ESI, CH3CN): m/z = 948.4778 ([M+H+]).
17. To a solution of 16 (465 mg, 490 μmol) in 12.5 mL EtOAC at 0 °C was added 4.5 mL concentrated HCl. The reaction mixture was allowed to warm to room temperature while stirring overnight. The reaction mixture was washed with saturated Na2CO3 and extracted with DCM. The organic layer was dried over MgSO4 and solvent was removed. The crude material was purified using silica gel column chromatography with 0–20% MeOH:CHCl3 as the eluent to yield the desired product as a brown oil (359 mg, 97% yield). 1H NMR (500 MHz, CDCl3) δ 1.81–1.90 (m, 4H), 3.61 (s, 8H), 3.76 (t, J = 7 Hz, 2H), 3.79 (s, 4H), 3.97 (t, J = 7 Hz, 2H), 6.35 (d, J = 7 Hz, 2H), 6.81 (s, 2H), 6.93 (d, J = 7 Hz, 2H), 7.04 (s, 1H), 7.09–7.12 (m, 2H), 7.37 (t, J = 7 Hz, 2H), 7.60–7.61 (m, 4H), 7.69–7.71 (m, 2H), 7.83–7.84 (m, 2H), 8.49 (d, J = 7 Hz, 2H) ppm; 13C NMR (600 MHz, CDCl3) δ 25.4, 26.7, 29.7, 37.7, 58.5, 59.9, 60.1, 67.0, 106.6, 112.5, 113.3, 121.8, 122.7, 123.2, 132.1, 133.9, 136.4, 138.2, 140.6, 148.8, 157.8, 158.2, 159.0, 160.0, 168.5 ppm; HRMS (ESI, MeCN): m/z = 748.3731 ([M+H]+).
18. To a solution of 17 (200 mg, 270 μmol) in CHCl3 (500 μL) was added 4-fluorophenethyl isocyanate (200 μL, 1.37 mmol). The reaction was allowed to stir at room temperature for 12 h. Solvent was removed and the crude material was purified using silica gel column chromatography with 0–10% MeOH:CHCl3 as the eluent to yield the desired product as a yellow oil (231 mg, 80% yield). 1H NMR (500 MHz, CDCl3) δ 1.78–1.89 (m, 4H), 2.84 (t, J = 7 Hz, 4H), 3.42 (s, 4H), 3.57 (s, 4H), 3.62 (q, J = 7 Hz, 4H), 3.73 (s, 4H), 3.74 (t, J = 7 Hz, 2H), 3.96 (t, J = 7 Hz, 2H), 6.64 (d, J = 8 Hz, 2H), 6.84 (s, 2H), 6.89–6.94 (m, 4H), 7.01 (s, 1H), 7.09–7.16 (m, 8H), 748 (t, J = 8 Hz, 2H), 7.52 (d, J = 8 Hz, 2H), 7.60 (td, J = 2, 8 Hz, 2H), 7.68–7.69 (m, 2H), 7.81–7.82 (m, 2H), 8.49–8.51 (m, 2H), 8.75 (br s, NH, 2H), 9.52 (br s, NH, 2H) ppm; 13C NMR (600 MHz, CDCl3) δ 25.4, 26.7, 35.4, 37.6, 40.9, 58.6, 59.5, 60.1, 67.1, 110.0, 113.3, 115.0, 115.2, 115.4, 122.0, 122.5, 123.2, 130.1, 132.1, 134.0, 135.1, 136.5, 140.6, 149.0, 152.7, 155.4, 156.2, 159.2, 159.6, 160.6, 162.3, 168.4 ppm; HRMS (ESI, MeCN): m/z = 1078.4911 ([M+H]+).
19. To a solution of 18 (194 mg, 180 μmol) in CH2Cl2 (0.82 mL) and EtOH (3.0 mL) was added hydrazine monohydrate (80 μL, 1.65 mmol). The reaction mixture was allowed to stir at room temperature overnight during which a large amount of white precipitate formed. The reaction mixture was filtered, concentrated, dissolved in dichloromethane, filtered, and concentrated again to yield the desired product as an off-white solid (72.6 mg, 43% yield). 1H NMR (600 MHz, CDCl3) δ 1.63 (p, J = 7 Hz, 2H), 1.78 (p, J = 7 Hz, 2H), 2.27 (s, 2H), 2.76 (t, J = 8 Hz, 2H), 2.83 (t, J = 8 Hz, 4H), 3.43 (s, 4H), 3.57 (s, 4H), 3.61 (q, J = 6 Hz, 4H), 3.74 (s, 4H), 3.91 (t, J = 7 Hz, 2H), 6.68 (d, J = 8 Hz, 2H), 6.83 (s, 2H), 6.90 (t, J = 8 Hz, 4H), 6.98 (s, 1H), 7.07 (d, J = 8 Hz, 2H), 7.10–7.15 (m, 6H), 7.46 (t, J = 8 Hz, 2H), 7.51 (d, J = 7 Hz, 2H), 7.59 (d of t, J = 2, 8 Hz, 2H), 8.48–8.50 (m, 2H), 8.74 (br s, NH, 2H), 9.52 (br s, NH, 2H) ppm; 13C NMR (600 MHz, CDCl3) δ 26.6, 29.7, 35.4, 40.9, 41.6, 58.6, 59.5, 60.2, 67.6, 109.8, 113.4, 115.2, 115.4, 121.1, 122.1, 122.6, 130.2, 130.2, 135.1, 136.5, 138.6, 140.4, 149.0, 152.5, 155.8, 156.5, 159.2, 159.5, 160.6, 162.3 ppm; HRMS (ESI, MeCN): m/z = 948.4809 ([M+H]+).
Zinc Complexation
Stock solutions of Zn(NO3)2·6H2O (25 mM) and BDPA scaffolds were prepared in MeOH and mixed such that the [Zn2+]:[DPA] molar ratio was 1:1. The solutions were allowed to shake for 1 h before the solvent was removed by rotary evaporation followed by sitting under vacuum for a period of at least 1 h.
Preparation of Vesicles
All phospholipids were purchased from Avanti Polar Lipids (Alabaster, AL) and stored at −20 °C until use. Appropriately sized aliquots of lipid solutions were added to a clean, dry test tube. Solvent was removed by evaporation using a gentle stream of N2 gas. Residual solvent was removed under vacuum over a period of at least 1 h. Lipids were rehydrated with the desired buffer. A glass ring was added to the solution to ensure complete removal of all lipid from the test tube wall and the solution was vortexed. The suspension was extruded 21 times through a 19 mm polycarbonate membrane with 200-nm-diameter pores. Vesicles were used on the day of preparation. For RED studies, PS-rich vesicles were composed of POPC:Cholesterol:POPS in the molar ratio of 65:25:10 and PC vesicles were composed of POPC:Cholesterol in the molar ratio of 75:25. For FRET studies, the PS-rich vesicles were composed of POPS:POPC:14 in the molar ratio of 50:49:1 and the PC vesicles were composed of POPC:14 in the molar ratio of 99:1.
Rapid Equilibrium Dialysis (RED) Assay
Qualitative RED assays were conducted using a single-use RED apparatus (Thermo Scientific Pierce product number 90006) following the guidelines provided by the vendor. The apparatus consists of two compartments, ‘source’ and ‘receiver’, separated by an 8000 molecular weight cutoff membrane that is impermeable to 200-nm-diameter vesicles. Briefly, a solution of either PS-rich vesicles composed of POPC:Cholesterol:POPS, 65:25:10, or PC vesicles composed of POPC:Cholesterol, 75:25 (1.0 mM total lipid) was added to the ‘source’ compartment (500 μL) of a RED apparatus while a single member of the Zn-BDPA library (40 μM) was added to the ‘receiver’ compartment (750 μL). All RED screens were carried out using TES buffer (10 mM TES, 145 mM NaCl, pH 7.4) and the system was allowed to equilibrate by shaking at 180 rpm and 37 °C for 16 h. The amount of Zn2+ in each compartment was determined using a colorimetric indicator, NO2–PAPS (see Supporting Information).44 Control experiments confirmed that unbiased RED equilibration of the Zn-BDPA candidate occurred in the absence of vesicles.
FRET Displacement Assay
A FRET ensemble of fluorescence energy acceptor 12 bound to the surface of PS-rich vesicles containing energy donor 14 was prepared by mixing 12 (10 μM) and PS-rich vesicles (20 μM total lipid; POPS:POPC:14, 50:49:1) in 2.0 mL of HEPES buffer (5 mM HEPES, 137 mM NaCl, 3.2 mM KCl, 1.0 mM Zn(NO3)2·6H2O, pH 7.4) at 25 °C. Aliquots of lead Zn-BDPA compounds, 11k or 11o, were titrated into separate samples of the FRET ensemble while stirring. After waiting approximately 60 s for equilibration to occur, the fluorescence emission spectrum was acquired (λex = 480 nm, λem = 500–750 nm). Plots of fluorescence intensity ratio (I567 nm/I663 nm) as a function of Zn-BDPA concentration were generated and fit using a computer to a competitive binding model that determined 1:1 association constants (see Supporting Information).45
FRET Titration Assay
Fluorescent probes 12 and 13 were titrated separately into aqueous samples containing either PS-rich (10 μM total lipid; POPS:POPC:14, 50:49:1) or PC (10 μM total lipid; POPC:14, 99:1) vesicles in 3.0 mL HEPES buffer (5 mM HEPES, 137 mM NaCl, 3.2 mM KCl, 1.0 mM Zn(NO3)2·6H2O, pH 7.4) at 25 °C while stirring. After waiting approximately 60 s to ensure full equilibration, the fluorescence emission spectrum was acquired (λex = 480 nm, λem = 500–750 nm). Plots of fluorescence intensity (λem = 567 nm) as a function of probe concentration were generated and the association constants were determined using a nonlinear least-squares fitting procedure adapted for fluorescence spectroscopy (see Supporting Information).46
MTT Cell Viability Assay
Quantification of cell toxicity was measured using the 3-(4,5-dimethylthiazol-2-yl)-2,5-diphenyltetrazolium bromide (MTT) cell viability assay. The number of viable cells is directly correlated to the amount of reduced formazan. Only active reductase enzymes in living cells can reduce MTT; therefore, high levels of cell viability are indicated by a purple formazan color. The relative toxicity of fluorescent probes 12 and 13 can be assayed at different concentrations by comparing the formazan absorbance at 570 nm.
MDA-MB-231 (human breast cancer) and CHO-K1 (Chinese hamster ovary) cells were purchased from American Type Culture Collection, seeded into 96-microwell plates, and grown to confluency of 85% in RPMI or F-12K media supplemented with 10% fetal bovine serum, and 1% streptavidin l-glutamate at 37 °C and 5% CO2. The Vybrant MTT cell proliferation Assay Kit (Invitrogen, Eugene, USA) was performed according to the manufacture’s protocol and validated using 50 μM etoposide as a positive control for high toxicity. The cells were treated with either 12 or 13 (0–50 μM) and incubated for 18 h at 37 °C. The medium was removed and replaced with 100 μL of RPMI or F-12K media containing [3-(4,5-dimethylthiazol-2-yl)-2,5-diphenyltetrazolium bromide] (MTT, 1.2 mM). An SDS-HCl detergent solution was added and incubated at 37 °C and 5% CO2 for an additional 4 h. The absorbance of each well was read at 570 nm and normalized to wells containing no cells or added probe (measured in quadruplicate).
Cell Microscopy Studies
Separately, MDA-MB-231 cells and CHO-K1 cells were treated with either 15 μM etoposide for 12 h or left untreated in cell media. Cells treated with etoposide were washed once with HEPES buffer (10 mM HEPES, 137 mM NaCl, 3.2 mM KCl, pH = 7.4) before incubation with probe. Fluorescent probes 12 and 13 were suspended in HEPES buffer (1% DMSO; 1 mM stock) and diluted to a final concentration of 10 μM. Cells were treated with either 12 or 13 for 30 min at 37 °C and 5% CO2. An additional wash step was performed and cells were resuspended in HEPES buffer. The cells were immediately viewed using a TE-2000U epifluorescence microscope utilizing the brightfield and Cy5 filter settings (λex = 620/60, λem = 700/75; 60/100× magnification). Each Cy5 fluorescence micrograph in a sequence was normalized to the highest fluorescence intensity. For co-staining experiments, populations of healthy and dead/dying cells were stained with 5 μM SYTOX Blue, a nucleic acid stain, 15 min prior to staining with 12 or 13. All data was manipulated using ImageJ 1.40g software.
Confocal scanning laser microscopy of MDA-MB-231 cells was performed using a Nikon A1R confocal microscope to examine the cellular localization of 13 in dead/dying cells. Etoposide treatment and cell staining was carried out using the same procedure stated above (15 μM etoposide; 12 h incubation). Sequential planar images were taken (4 μm apart) of the dead/cying cells using a 60× microscope objective and a deep-red emission wavelength filter.
Flow Cytometry Studies
CHO-K1 cells were purchased from American Type Culture Collection, seeded into three T25 flasks, and grown to confluency in F-12K media supplemented with 10% fetal bovine serum, and 1% streptavidin l-glutamate at 37 °C and 5% CO2. The cells were either treated with 15 μM etoposide for 13 h or left untreated in cell media. Cells treated with etoposide were washed once with HEPES buffer (10 mM HEPES, 137 mM NaCl, 3.2 mM KCl, pH = 7.4) before incubation with probe. Probe 13 was suspended in HEPES buffer (1% DMSO; 1 mM stock) and diluted to a final concentration of 10 μM. Cells were treated with 13 for 15 min at 37 °C and 5% CO2. Three additional wash steps were performed, cells were treated with trypsin, and flasks were incubated at 37 °C until cells were detached. Once detached, the cells were centrifuged at 125g for 10 min. The trypsin was removed from the pellet solution, and the cells were resuspended in 1 mL HEPES buffer. Flow cytometry was performed using a Beckman Coulter FC500 Flow Cytometer (FL4 channel; 10 000 cell count, medium flow rate) and histogram plots were generated using FlowJoIX software.
Rat Biodistribution Studies
All animal handling and imaging procedures were approved by the University of Notre Dame Institutional Animal Care and Use Committee. Four week-old male Lobund Wistar rats (Freimann Life Science Center; 125 g, N = 4) were injected subcutaneously into the right flank with 1 × 10⁶ Prostate Adenocarcinoma III (PAIII) cells suspended in 300 μL of DMEM medium. Tumors grew for 14 days, then the rats were injected intravenously via the tail vein with 3 mg/kg of CyAL-5, 12, or 13, in a DMSO/water solution (10% DMSO). Twenty-four hours after probe injection, the rats were anesthetized and sacrificed via cervical dislocation. Selected tissues were excised and placed onto a transparent imaging tray for ex vivo fluorescence imaging. Epifluorescence images were acquired using a Kodak In Vivo Multispectral Imaging Station FX (Carestream Health; Rochester, NY) equipped with 590 ± 10 nm excitation and 670 ± 20 nm emission filter set. The images were acquired for 30 s at a 190 mm field of view (f-stop = 2.51, 2 × 2 bin). Tumors were separated into halves along the longest axis. The tumor halves were placed onto a transparent imaging tray so the inner cores faced the camera. The fluorescence images were analyzed using ImageJ 1.40g software. Region of interest (ROI) analysis was performed by drawing a shape around excised tissue. The mean pixel intensities were measured and biodistribution results depicted as mean pixel intensities ± standard error of the mean, with statistical analysis using a Student’s t test. The biodistribution analysis assumes that the deep-red fluorescence emission for CyAL-5, probe 12, or probe 13 from a specific organ suffers the same amount of signal attenuation; thus, the mean pixel intensities for a specific organ reflect the relative probe concentrations.
Histological Analysis
Tumor slices were snap-frozen in OCT, sliced (5 μm thickness) at −17 °C, adhered to Unifrost microscope slides (Azer Scientific, USA), fixed with chilled acetone for 10 min, and air-dried for an additional 20 min. Finally, a coverslip was adhered, and the slide was allowed to dry for at least 1 h. Brightfield and deep-red fluorescence images of the slices were acquired using a Nikon TE-2000U epifluorescence microscope equipped with a Cy5 filter set (λex = 620/60, λem = 700/75). Images were analyzed using ImageJ 1.40g software.
Acknowledgments
This work was supported by the NIH (GM059078 to B.D.S.). We thank Dr. S. Xiao for early stage experiments and the research group of Professor A. Hummon for access to UV/vis instrumentation.
Glossary
Abbreviations
- Boc2O
di-tert-butyl dicarbonate
- DCM
dichloromethane
- DIPEA
N,N-diisopropylethylamine
- DMF
dimethylformamide
- DMSO
dimethylsulfoxide
- FRET
fluorescence resonance energy transfer
- HEPES
2-[4-(2-hydroxyethyl)piperazin-1-yl]ethanesulfonic acid
- MTT
3-(4,5-dimethylthiazol-2-yl)-2,5-diphenyltetrazolium bromide
- NHS
N-hydroxysuccinimide
- POPC
1-palmitoyl-2-oleoyl-sn-glycero-3-phosphocholine
- POPS
1-palmitoyl-2-oleoyl-sn-glycero-3-phospho-l-serine [sodium salt]
- PS
phosphatidylserine
- PC
phosphocholine
- RED
rapid equilibrium dialysis
- TEA
triethylamine
- TES
2-[[1,3-dihydroxy-2-(hydroxymethyl)propane-2-yl]amino]ethanesulfonic acid
- TFA
trifluoroacetic acid
- Zn-BDPA
zinc(II)-bisdipicolylamine
- Zn-DPA
zinc(II)-dipicolylamine
Supporting Information Available
Chemical synthesis, compound characterization, screening assays, curve fitting procedures, and imaging results. This material is available free of charge via the Internet at http://pubs/acs/org.
The authors declare no competing financial interest.
Funding Statement
National Institutes of Health, United States
Supplementary Material
References
- Smith B. A.; Smith B. D. (2012) Biomarkers and molecular probes for cell death imaging and targeted therapeutics. Bioconjugate Chem. 23, 1989–2006. [DOI] [PMC free article] [PubMed] [Google Scholar]
- Kepp O.; Galluzzi L.; Lipinski M.; Yuan J.; Kroemer G. (2011) Cell death assays for drug discovery. Nat. Rev. Drug Discovery 10, 221–37. [DOI] [PubMed] [Google Scholar]
- Huang X.; Lee S.; Chen X. (2011) Design of ″smart″ probes for optical imaging of apoptosis. Am. J. Nucl. Med. Mol. Imaging 1, 3–17. [PMC free article] [PubMed] [Google Scholar]
- Blankenberg F. G. (2008) In vivo detection of apoptosis. J. Nucl. Med. 49, 81S–95S. [DOI] [PubMed] [Google Scholar]
- Smith G.; Nguyen Q. D.; Aboagye E. O. (2009) Translational imaging of apoptosis. Anti-Cancer Agents Med. Chem. 9, 958–67. [DOI] [PubMed] [Google Scholar]
- Balasubramanian K.; Schroit A. J. (2003) Aminophospholipid asymmetry: A matter of life and death. Annu. Rev. Physiol. 65, 701–34. [DOI] [PubMed] [Google Scholar]
- Belhocine T.; Prato F. (2011) Transbilayer phospholipids molecular imaging. EJNMMI Res. 1, 17. [DOI] [PMC free article] [PubMed] [Google Scholar]
- Gao J. M.; Zheng H. (2013) Illuminating the lipidome to advance biomedical research: peptide-based probes of membrane lipids. Future Med. Chem. 5, 947–59. [DOI] [PMC free article] [PubMed] [Google Scholar]
- Vance J. E.; Steenbergen R. (2005) Metabolism and functions of phosphatidylserine. Prog. Lipid Res. 44, 207–34. [DOI] [PubMed] [Google Scholar]
- Frey B.; Gaipl U. (2011) The immune functions of phosphatidylserine in membranes of dying cells and microvesicles. Semin. Immunopathol. 33, 497–516. [DOI] [PubMed] [Google Scholar]
- Fadeel B.; Xue D. (2009) The ins and outs of phospholipid asymmetry in the plasma membrane: roles in health and disease. Crit. Rev. Biochem. Mol. Biol. 44, 264–77. [DOI] [PMC free article] [PubMed] [Google Scholar]
- Leventis P. A.; Grinstein S. (2010) The distribution and function of phosphatidylserine in cellular membranes. Ann. Rev. Biophys. 39, 407–27. [DOI] [PubMed] [Google Scholar]
- Schutters K.; Reutelingsperger C. (2010) Phosphatidylserine targeting for diagnosis and treatment of human diseases. Apoptosis 15, 1072–82. [DOI] [PMC free article] [PubMed] [Google Scholar]
- Vanderheyden J.-L.; Liu G.; He J.; Patel B.; Tait J. F.; Hnatowich D. J. (2006) valuation of 99mTc-MAG3-annexin V: influence of the chelate on in vitro and in vivo properties in mice. Nucl. Med. Biol. 33, 135–44. [DOI] [PubMed] [Google Scholar]
- Ke S.; Wen X. X.; Wu Q. P.; Wallace S.; Charnsangavej C.; Stachowiak A. M.; Stephens C. L.; Abbruzzese J. L.; Podoloff D. A.; Li C. (2004) Imaging taxane-induced tumor apoptosis using PEGylated, In-111-labeled annexin V. J. Nucl. Med. 45, 108–15. [PubMed] [Google Scholar]
- Beekman C. A. C.; Buckle T.; van Leeuwen A. C.; Valdés Olmos R. A.; Verheij M.; Rottenberg S.; van Leeuwen F. W. B. (2011) Questioning the value of 99mTc-HYNIC-annexin V based response monitoring after docetaxel treatment in a mouse model for hereditary breast cancer. Appl. Radiat. Isot. 69, 656–62. [DOI] [PubMed] [Google Scholar]
- Palmowski K.; Rix A.; Lederle W.; Behrendt F.; Mottaghy F.; Gray B.; Pak K.; Palmowski M.; Kiessling F. (2013) A low molecular weight zinc2+-dipicolylamine-based probe detects apoptosis during tumour treatment better than an annexin V-based probe. Eur. Radiol. 1–8. [DOI] [PubMed] [Google Scholar]
- Tavare R.; Torres Martin De Rosales R.; Blower P.; Mullen G. (2009) Efficient site-specific radiolabeling of a modified C2A domain synaptotagmin I with [99mTc(CO)3]+: a new radiopharmaceutical for imaging cell death. Bioconjugate Chem. 20, 2071–81. [DOI] [PubMed] [Google Scholar]
- Alam I. S.; Neves A. A.; Witney T. H.; Boren J.; Brindle K. M. (2010) Comparison of the C2A domain of synaptotagmin-I and annexin-V as probes for detecting cell death. Bioconjugate Chem. 21, 884–91. [DOI] [PubMed] [Google Scholar]
- Falborg L.; Waehrens L.; Alsner J.; Bluhme H.; Frokiaer J.; Heegaard C.; Horsman M.; Rasmussen J.; Rehling M. (2010) Biodistribution of 99mTc-HYNIC-lactadherin in mice--a potential tracer for visualizing apoptosis in vivo. Scand. J. Clin. Lab. Invest. 70, 209–16. [DOI] [PubMed] [Google Scholar]
- Burtea C.; Ballet S.; Laurent S.; Rousseaux O.; Dencausse A.; Gonzalez W.; Port M.; Corot C.; Elst L. V.; Muller R. N. (2012) Development of a magnetic resonance imaging protocol for the characterization of atherosclerotic plaque by using vascular cell adhesion molecule-1 and apoptosis-targeted ultrasmall superparamagnetic iron oxide derivatives. Arterioscler., Thromb., Vasc. Biol. 32, E36–E48. [DOI] [PubMed] [Google Scholar]
- Kapty J.; Banman S.; Goping I. S.; Mercer J. R. (2012) Evaluation of phosphatidylserine-binding peptides targeting apoptotic cells. J. Biomol. Screen. 17, 1293–1301. [DOI] [PubMed] [Google Scholar]
- Xiong C. Y.; Brewer K.; Song S. L.; Zhang R.; Lu W.; Wen X. X.; Li C. (2011) Peptide-based imaging agents targeting phosphatidylserine for the detection of apoptosis. J. Med. Chem. 54, 1825–35. [DOI] [PubMed] [Google Scholar]
- Zheng H.; Wang F.; Wang Q.; Gao J. M. (2011) Cofactor-free detection of phosphatidylserine with cyclic peptides mimicking lactadherin. J. Am. Chem. Soc. 133, 15280–3. [DOI] [PubMed] [Google Scholar]
- Oltmanns D.; Zitzmann-Kolbe S.; Mueller A.; Bauder-Wuest U.; Schaefer M.; Eder M.; Haberkorn U.; Eisenhut M. (2011) Zn(II)-bis(cyclen) complexes and the imaging of apoptosis/necrosis. Bioconjugate Chem. 22, 2611–24. [DOI] [PubMed] [Google Scholar]
- Cooley C. M.; Hettie K. S.; Klockow J. L.; Garrison S.; Glass T. E. (2013) A selective fluorescent chemosensor for phosphoserine. Org. Biomol. Chem. 11, 7387–92. [DOI] [PubMed] [Google Scholar]
- Lakshmi C.; Hanshaw R. G.; Smith B. D. (2004) Fluorophore-linked zinc(II)dipicolylamine coordination complexes as sensors for phosphatidylserine-containing membranes. Tetrahedron 60, 11307–15. [Google Scholar]
- Smith B. A.; Xie B. W.; van Beek E. R.; Que I.; Blankevoort V.; Xiao S. Z.; Cole E. L.; Hoehn M.; Kaijzel E. L.; Lowik C.; Smith B. D. (2012) Multicolor fluorescence imaging of traumatic brain injury in a cryolesion mouse model. ACS Chem. Neurosci. 3, 530–37. [DOI] [PMC free article] [PubMed] [Google Scholar]
- Smith B. A.; Gammon S. T.; Xiao S. Z.; Wang W.; Chapman S.; McDermott R.; Suckow M. A.; Johnson J. R.; Piwnica-Worms D.; Gokel G. W.; Smith B. D.; Leevy W. M. (2011) In vivo optical imaging of acute cell death using a near-infrared fluorescent zinc-dipicolylamine probe. Mol. Pharmaceut. 8, 583–90. [DOI] [PMC free article] [PubMed] [Google Scholar]
- Smith B. A.; Akers W. J.; Leevy W. M.; Lampkins A. J.; Xiao S.; Wolter W.; Suckow M. A.; Achilefu S.; Smith B. D. (2010) Optical imaging of mammary and prostate tumors in living animals using a synthetic near infrared zinc(II)-dipicolylamine probe for anionic cell surfaces. J. Am. Chem. Soc. 132, 67–9. [DOI] [PMC free article] [PubMed] [Google Scholar]
- Xiao S. Z.; Turkyilmaz S.; Smith B. D. (2013) Convenient synthesis of multivalent zinc(II)-dipicolylamine complexes for molecular recognition. Tetrahedron Lett. 54, 861–4. [DOI] [PMC free article] [PubMed] [Google Scholar]
- Smith B. A.; Harmatys K. M.; Xiao S.; Cole E. L.; Plaunt A. J.; Wolter W.; Suckow M. A.; Smith B. D. (2013) Enhanced cell death imaging using multivalent zinc(II)-bis(dipicolylamine) fluorescent probes. Mol. Pharmaceut. 10, 3296–303. [DOI] [PMC free article] [PubMed] [Google Scholar]
- O’Neil E. J.; Jiang H.; Smith B. D. (2013) Effect of bridging anions on the structure and stability of phenoxide bridged zinc dipicolylamine coordination complexes. Supramol. Chem. 25, 315–22. [DOI] [PMC free article] [PubMed] [Google Scholar]
- Hanshaw R. G.; Stahelin R. V.; Smith B. D. (2008) Noncovalent keystone interactions controlling biomembrane structure. Chem.—Eur. J. 14, 1690–7. [DOI] [PMC free article] [PubMed] [Google Scholar]
- Huang F.; Cheng C.; Feng G. (2012) Introducing ligand-based hydrogen bond donors to a receptor: both selectivity and binding affinity for anion recognition in water can be improved. J. Org. Chem. 77, 11405–8. [DOI] [PubMed] [Google Scholar]
- Drewry J. A.; Fletcher S.; Hassan H.; Gunning P. T. (2009) Novel asymmetrically functionalized bis-dipicolylamine metal complexes: peripheral decoration of a potent anion recognition scaffold. Org. Biomol. Chem. 7, 5074–7. [DOI] [PubMed] [Google Scholar]
- Lee J. H.; Park J.; Lah M. S.; Chin A.; Hong J.-I. (2007) High-affinity pyrophosphate by a synergistic effect receptor metal coordination and hydrogen bonding in water. Org. Lett. 9, 3729–731. [DOI] [PubMed] [Google Scholar]
- Mareque-Rivas J. C.; Torres Martin de Rosales R.; Parsons S. (2004) The affinity of phosphates to zinc(II) complexes can be increased with hydrogen bond donors. Chem. Commun. 610–1. [DOI] [PubMed] [Google Scholar]
- Pouessel J.; Le Bris N.; Bencini A.; Giorgi C.; Valtancoli B.; Tripier R. (2012) Glyphosate and ATP binding by mononuclear Zn(II) complexes with non-symmetric ditopic polyamine ligands. Dalton Trans. 41, 10521–32. [DOI] [PubMed] [Google Scholar]
- Drewry J. A.; Duodu E.; Mazouchi A.; Spagnuolo P.; Burger S.; Gradinaru C. C.; Ayers P.; Schimmer A. D.; Gunning P. T. (2012) Phosphopeptide selective coordination complexes as promising Src homology 2 domain mimetics. Inorg. Chem. 51, 8284–91. [DOI] [PubMed] [Google Scholar]
- Drewry J. A.; Burger S.; Mazouchi A.; Duodu E.; Ayers P.; Gradinaru C. C.; Gunning P. T. (2012) Src homology 2 domain proteomimetics: developing phosphopeptide selective receptors. Med. Chem. Commun. 3, 763–70. [DOI] [PubMed] [Google Scholar]
- Drewry J. A.; Fletcher S.; Yue P.; Marushchak D.; Zhao W.; Sharmeen S.; Zhang X.; Schimmer A. D.; Gradinaru C.; Turkson J.; Gunning P. T. (2010) Coordination complex SH2 domain proteomimetics: an alternative approach to disrupting oncogenic protein-protein interactions. Chem. Commun. 46, 892–4. [DOI] [PMC free article] [PubMed] [Google Scholar]
- Scott J. L.; Musselman C. A.; Adu-Gyamfi E.; Kutateladze T. G.; Stahelin R. V. (2012) Emerging methodologies to investigate lipid-protein interactions. Integr. Biol. 4, 247–58. [DOI] [PMC free article] [PubMed] [Google Scholar]
- Segers J.; Laumonier C.; Burtea C.; Laurent S.; Vander Elst L.; Muller R. N. (2007) From phage display to magnetophage, a new tool for magnetic resonance molecular imaging. Bioconjugate Chem. 18, 1251–58. [DOI] [PubMed] [Google Scholar]
- Waters N. J.; Jones R.; Williams G.; Sohal B. (2008) Validation of a rapid equilibrium dialysis approach for the measurement of plasma protein binding. J. Pharm. Sci. 97, 4586–95. [DOI] [PubMed] [Google Scholar]
- White A. G.; Gray B. D.; Pak K. Y.; Smith B. D. (2012) Deep-red fluorescent imaging probe for bacteria. Bioorg. Med. Chem. Lett. 22, 2833–6. [DOI] [PMC free article] [PubMed] [Google Scholar]
- Connors K. A. (1987) Binding Constants: The Measure of Complex Stability, John Wiley & Sons, New York. [Google Scholar]
- Smith B. A.; Xiao S. Z.; Wolter W.; Wheeler J.; Suckow M. A.; Smith B. D. (2011) In vivo targeting of cell death using a synthetic fluorescent molecular probe. Apoptosis 16, 722–31. [DOI] [PMC free article] [PubMed] [Google Scholar]
- Wyffels L.; Gray B. D.; Barber C.; Woolfenden J. M.; Pak K. Y.; Liu Z. L. (2011) Synthesis and preliminary evaluation of radiolabeled bis(zinc(II)-dipicolylamine) coordination complexes as cell death imaging agents. Bioorg. Med. Chem. 19, 3425–33. [DOI] [PMC free article] [PubMed] [Google Scholar]
- McDunn J. E.; Muenzer J. T.; Dunne B.; Zhou A.; Yuan K.; Hoekzema A.; Hilliard C.; Chang K. C.; Davis C. G.; McDonough J.; Hunt C.; Grigsby P.; Piwnica-Worms D.; Hotchkiss R. S. (2009) An anti-apoptotic peptide improves survival in lethal total body irradiation. Biochem. Biophys. Res. Commun. 382, 657–62. [DOI] [PMC free article] [PubMed] [Google Scholar]
- Ying T.; Li Z. J.; Juan Z.; Pan J. M. (2005) Recent advances of the derivatives of pyridylazo as reagents in analytical chemistry. Rev. Anal. Chem. 24, 103–47. [Google Scholar]
- Xie H. Z.; Yi S.; Wu S. K. (1999) Study on host-guest complexation of anions based on tri-podal naphthylthiourea derivatives. J. Chem. Soc., Perkin Trans. 2, 2751–4. [Google Scholar]
Associated Data
This section collects any data citations, data availability statements, or supplementary materials included in this article.


