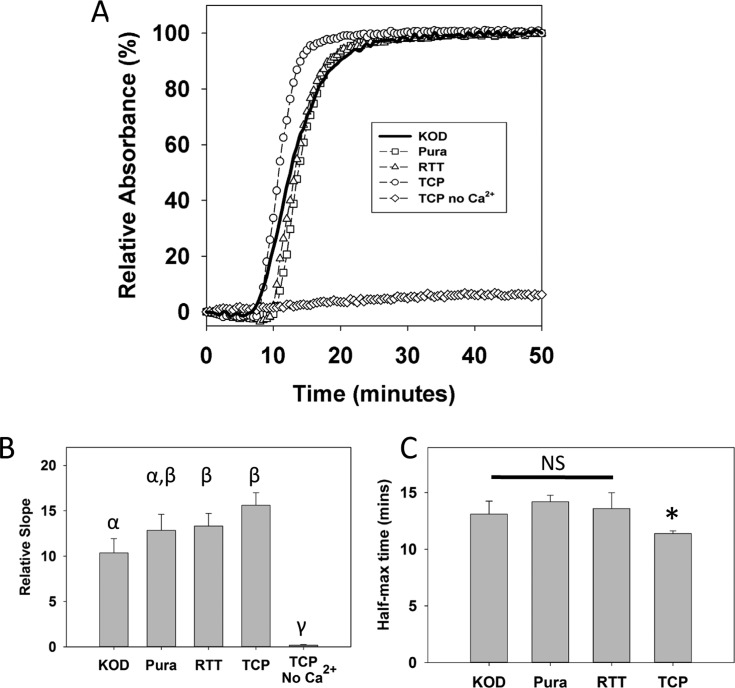
Figure 5.
Plasma recalcification profile on surfaces. (A) PPP + Ca2+ incubated on KOD, RTT, PURA, and TCP surfaces showed characteristic clotting kinetics as a function of time, compared to negative control PPP without Ca2+ on TCP. Data was normalized to respective sample absorbance at 50 min. Negative control absorbance was normalized to TCP 50 min absorbance. (B) PPP clotting rate as measured by the slope of linear region of the curves showed no significant difference for the surfaces. (C) Clotting time as determined by half-max time showed that hydrogel surfaces clotted more quickly than TCP. (n = 6, *p < 0.05 between different Greek symbols).

