

Abstract
Chemical labeling of peptides prior to shotgun proteomics allows relative quantification of proteins in biological samples independent of sample origin. Current strategies utilize isobaric labels that fragment into reporter ions. However, quantification of reporter ions results in distorted ratio measurements due to contaminating peptides that are co-selected in the same precursor isolation window. Here, we show that quantitation of isobaric peptide fragment isotopologues in tandem mass spectra reduces precursor interference. The method is based on the relative quantitation of isobaric isotopologues of dimethylated peptide fragments in tandem mass spectra following higher energy collisional dissociation (HCD). The approach enables precise quantification of a proteome down to single spectra per protein and quantifies >90% of proteins in a MudPIT experiment and accurately measures proteins in a model cell line for cystic fibrosis.
Keywords: quantitative proteomics, mass spectrometry
Introduction
Metabolic or chemical incorporation of stable isotopes followed by ratio determination of isotope peaks in survey mass spectra represents the predominant method for quantification of protein samples by mass spectrometry.2 Alternative strategies that quantify fragment ions in tandem mass spectra have received increasing attention because of improved sensitivity and greater ability to measure multiple samples simultaneously (sample multiplexing).3 In isobaric tagging approaches peptides are labeled with isobaric moieties (for example, TMT, iTRAQ, or ICAT) that fragment into reporter ions of different isotope mass that are detected in the low mass range of the tandem mass spectrum. While very efficient, reporter ion-based quantification accuracy suffers from simultaneous fragmentation of additional peptides sporadically present in the precursor isolation window of 2.0 Da used to isolate the most abundant isotope peaks of a doubly charged peptide. These interfering ions distort the observed from the expected reporter ion signal. We estimated that in a MudPIT1 proteomic experiment ∼30% of tandem mass spectra were contaminated with additional peptide-derived precursor peaks, whereas the combined signal intensity of the contamination represented on average ∼40% of the total ion signal intensity.
Several approaches have been put forward to resolve ratio distortions of reporter ions that are caused by interfering precursor ions. For example, MS3-based approaches isolate MS/MS peaks and fragment these to measure a purified reporter ion signal,4 or the mass selection window can be narrowed.4 Moreover, precursor ion populations present in a small mass window can be deconvoluted by automated gas-phase purification in which a proton transfer alters the charge or mass of contaminating precursor ions.5 Alternatively, isobaric peptide termini labeling (IPTL) quantifies N- and C-terminal labeled fragment ions that most likely differ from contaminating fragment ions.6
Here we evaluated whether the quantification of identified, isobaric isotopologue peptide fragment ions in tandem mass spectra could at least partially prevent ratio distortions that are caused by interfering precursor ions. Quantification of isobaric isotopologues relies on a mass difference in the millidalton range because isobaric isotopologues are molecular species of the same mass number that differ only in isotope composition. The use of isobaric isotopologues for peptide quantification at the survey mass spectrum level has been described recently using metabolic (NeuSILAC) and chemical (NeuCODE) labeling7 and was recently extended to the quantification of peptide fragments with pseudoisobaric dimethyl labeling (pIDL).8
Here, we use reductive methylation for isobaric isotopologue labeling of peptides and show improved peptide quantifications in a MudPIT experiment.1 We apply the method to measure the protein levels of the cystic fibrosis transmembrane conductance regulator (CFTR) in a cell model for human cystic fibrosis.
Materials and Methods
Protein Sample Preparation
CFBE, HBE, and HEK cells were grown in cell culture medium (DMEM or AMEM supplemented with 10% FBS, 1x Pen/Strep (GIBCO), and 2 mM glutamine) at 37 °C and 5% CO2. Cells were washed with 1x PBS and lysed with TNI buffer (50 mM TrisHCl, pH 7.5, 0.5% IGEPAL CA-630, 250 mM NaCl, 1 mM EDTA, 1x Complete EDTA-free protease inhibitor cocktail (Roche), 1x Phosphatase Inhibitor Mix, PhosSTOP (Roche)). Lysates were passed 3 times through a 31 gauge needle and sonicated for 10 min prior to centrifugation to remove remaining cell debris. Protein content was subsequently determined by bicinchoninic acid assay, and methanol/chloroform precipitation was used to remove detergents, lipids, and other unwanted small molecules. Briefly, 100 μg of protein was precipitated with 4x volumes of methanol and 1x volume of chloroform by centrifugation (10 min, 16000 rpm, room temperature). The resulting protein pellet was subsequently washed with 3 v/v methanol (centrifugation 10 min, 16000 rpm), and residual liquid was removed by evaporation at room temperature and normal atmospheric pressure prior to protein digestion.
Digestion of Cell Lysates with LysC
The residual protein pellet was dissolved in 0.2% Rapigest (Waters) in 0.1 M TEAB (triethylammonium bicarbonate) and mixed vigorously for 15 min at room temperature as well as sonicated for 1 h in a water-bath sonicator. Cysteine disulfide bonds were subsequently reduced with 50 mM TCEP (tris(2-carboxyethyl)phosphine, Sigma) for 20 min in the dark at RT and acetylated with 100 mM iodoacetamide for 30 min in the dark at RT. Proteins were subsequently digested with LysC (1:100 (w/w), Promega).
Dimethylation of Peptides
Peptides were reductively methylated in 40% acetonitrile/0.1 M TEAB by adding either formaldehyde or 13C-formaldehyde to a final concentration of 40 mM and subsequent addition of sodium cyanoborohydride to a final concentration of 24 mM for 1 h at room temperature. Samples were quenched by the addition of ammonium bicarbonate at a final concentration of 0.1 M.
Sample Preparation and Liquid Chromatography
The sample volume was subsequently reduced under vacuum and redissolved in 0.1% formic acid in water. The samples were incubated for 1 h at 37 °C to inactivate Rapigest and subsequently centrifuged for 15 min at room temperature in order to remove aggregated cleavage products of Rapigest. Samples were mixed in the ratio indicated and loaded onto C18 resin (Aqua 5, Phenomenex) in a MudPIT setup consisting of 2 cm Aqua 5 followed by 2 cm Partisphere SCX (Whatman) in a 250 μm i.d. nondeactivated fused silica with a Kasil frit of about 1 mm length. Peptides were separated on a 115 mm long reversed phase C18 column packed with Aqua 3 (Phenomenex) of an i.d. of 100 μm with a in-house pulled electrospray ionization tip. Salt pulses to release peptides were delivered with an Agilent 1200 Quad pump at a back pressure of 65 bar in a split flow setup at a flow rate of about 150 nL/min at the tip. A biphasic reversed phase gradient with buffer A (5% acetonitrile, 0.01% formic acid) was used with a first step of 5 min from 0% to 10% B (95% acetonitrile and 0.01% formic acid) and a subsequent shallow gradient of 10% to 55% buffer B over 70 min. Ten percent step increments of buffer C (0.5 M ammonium acetate) starting at 0% were set up with a final salt pulse of 90% delivered in the presence of 10% buffer B to obtain a 10-step separation of the peptides.
Mass Spectrometry
Electrospray ionized peptides were detected with an Orbitrap Velos with one survey scan (m/z 300–1800) at a nominal resolution of 60,000. (Resolution is defined based on peak width and calculated with Δm being the full width of the peak at half of its maximum (fwhm) height if not stated otherwise.) The top 10 precursor ions were selected for subsequent MS/MS analysis if they were measured with at least a signal of 5,000 counts and were determined to harbor a charge state of 2 or greater. The sequential MS/MS scans fragmented the peptides first for quantification in HCD and measured the resulting ions subsequently in the Orbitrap at a nominal resolution of 30,000. For HCD fragmentation the precursor isolation width was set to m/z 2.0, 5 × 10⁴ ions were accumulated, the normalized collisional energy was set to 45%, and the default charge state assumed was 2. The activation time was set to 2 ms. A subsequent CID tandem mass spectrum (104 ions, isolation width m/z 2.0, normalized collisional energy of 35%, default charge state 2, Activation Q of 0.25, and an activation time of 10 ms) was acquired in parallel while the Orbitrap determined HCD tandem mass spectra. Peaks in the mass spectrum are reported as centroids following automatic centroid determination in the Orbitrap Velos.
Data Analysis
Acquired spectra were extracted with RawExtract 1.9.9.2 and the human Uniprot database (2013) searched for peptide spectrum matches with ProLuCID. Resulting spectra were filtered on the basis of a decoy database approach to a false positive rate below 1% at peptide level. Quantification was performed with Census based on calculated isotopologue masses and shifted by the experimentally determined systematic mass shift, if necessary.100 Signal intensities of the isotopologue peaks were extracted with Census and directly utilized for quantification of spectra and proteins with the in-house Perl script Isotopoquant. Selected b and y ion isotopologue ratio measurements were averaged (mean) for each spectrum and subsequently each protein. Any spectrum measurement without an isotopologue signal was rejected. Further data processing was performed in Prism (Graphpad) or Excel (Microsoft).
Results
Isobaric Isotopologue Labeling of Peptides
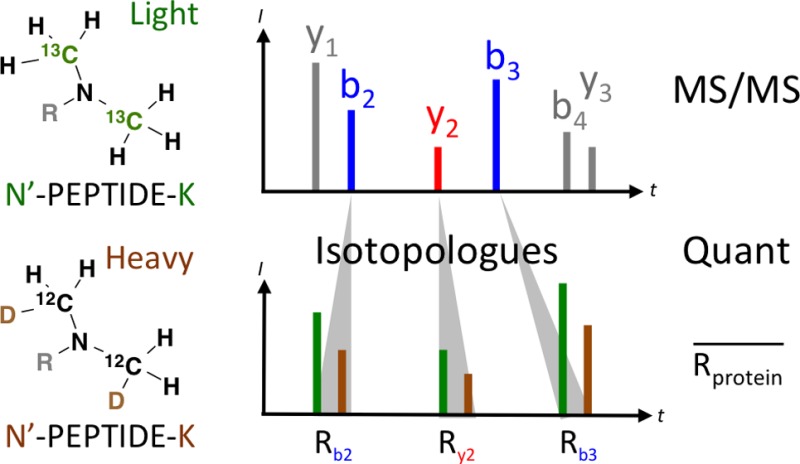
First we evaluated how efficient isobaric isotopologues are detected and quantified in a MudPIT experiment. To this end, 50 μg of a HEK whole cell lysate was digested with the enzyme LysC, either light or heavy dimethyl labeled, and mixed in a ratio of 1:1 (Figure 1A). The robust protocol for reductive methylation of peptides and proteins has a long-standing tradition9 and drew recent attention for isotope-based quantification in MS survey scans.10 To dimethyl label peptides with light isobaric isotopologues at primary amines of N-termini and C-terminal lysine side chains, 13C formaldehyde introduced a Schiff’s base that was subsequently reduced with trihydrogen borocyanate. To introduce a heavy isobaric isotopologue, the initial Schiff’s base was synthesized with 12C-formaldehyde and subsequently reduced with trideuterium borocyanate. The light and heavy dimethylated lysine or N-termini differ by 5.84 mDa because the element-specific mass deficit causes 13C to be 2.92 mDa lighter than deuterium. For example, the isobaric masses for a C-terminal y1 ion of a 2H or 13C dimethyl labeled lysine are 177.1508 and 177.1567 Da, respectively.
Figure 1.

Isobaric isotopologue labeling and quantification of peptides. (A) Primary amines of peptides were dimethylated either with 13C formaldehyde and sodium borocyanate or with formaldehyde and trideuterium sodium borocyanate to introduce light and heavy isotopologue methyl groups, respectively. The mass difference of the isobaric isotopologues is indicated. N′ denotes the peptide N-terminus. (B) A HEK cell proteome was labeled according to the schematic. (C) The isobaric isotopologue analysis for the HCD tandem mass spectrum of the peptide AFVDFLSDEIK is shown with identified b and y ions labeled in blue and red, respectively. A vertical line (black, dashed) and the area shaded in gray indicate the mass range acquired with a mass resolution of less than 30,000. The table lists individual ratio measurements for the b and y ion peptide fragments present in the low m/z mass range as well as the average of the b2 and y2 ion ratios.
Labeled peptides were analyzed in an Orbitrap Velos with one survey scan followed by data-dependent fragmentation of the 10 most abundant ions (Supplemental Figure 1A). Each precursor ion was fragmented twice, once with higher energy collisional dissociation (HCD) in order to obtain high signal intensities for low mass b and y ion peptide fragments followed by detection in the Orbitrap with a nominal resolution of 30,000 to quantify isobaric isotopologues and once in parallel with collision induced dissociation (CID) in the linear ion trap for efficient peptide identification (Supplemental Figure 1B). The CID spectrum is acquired fast enough to fit in the time window needed to record the high resolution HCD mass spectrum in the Orbitrap.
Systematic and random measurement errors influence mass precision. Therefore, we analyzed the intensities of the two y1 dimethylated lysine isobaric isotopologues of a complete MudPIT experiment (Supplemental Figure 2). While detection of the two isobaric y1 isotopologues requires a theoretical resolution of at least 60,000 (estimated from a resolution of 30,400 at m/z 177.1538 by the 10% valley definition), we determined an average resolution of 236,000 at m/z 177.1568 when the Orbitrap mass analyzer was set to a nominal resolution of 30,000. Experiments performed at a resolution lower than 30,000 failed to resolve the two y1 isobaric isotopologues reliably, whereas increasing the nominal resolution to 60,000 drastically reduced the number of identified peptides due to the increased time needed for recording the transient in the Orbitrap mass analyzer. Light and heavy y1 isobaric isotopologues were measured with high precision in almost all tandem mass spectra with minimal peak broadening (SD ±0.13 mDa). The y1 ion signal intensities covered 5 orders of magnitude from 102 to 107 counts with an average of 2.88 × 10³ counts (Supplemental Figure 2, right panel). Background ion signals of lower signal intensity were observed only at lower or higher m/z values than the y1 isobaric isotopologues and displayed a repetitive pattern along the m/z axis, which did not interfere with detection and quantification of the y1 isobaric isotopologues.
Searching the acquired HCD tandem mass spectra yielded 4820 peptide identifications of which more than >99% harbored dimethylated y1 lysine fragment ions (Supplemental Figure 3). The ratio of light to heavy of the y1 isobaric isotopologues was 1.03 in average with a standard deviation of 1.40 fold, which limits the precision by which protein ratios could be determined. The ratio measurement was constant over 3 orders of magnitude of signal intensity and about 10-fold higher than background with ∼104 counts in average. An accurate measurement of isobaric isotopologue mixing ratios over 4 orders of magnitude (from 100:1 to 1:100) has been demonstrated recently.8
Resolving Ratio Distortions with Isobaric Isotopologue Quantitation in Tandem Mass Spectra
In the case of a digest with carboxy-terminal specific proteases such as LysC, interfering precursor peptides generate y1 ions identical to the selected precursor ion, whereas higher numbered, contaminating b and y ions most likely differ in mass and therefore are expected to allow for more accurate ratio measurements. For example, chances are ∼1:20 (∼5%) that y2 ions are identical for both the selected and contaminating peptides, because it is an estimated 1 out of 20 amino acids that the second-most C-terminal amino acid of two peptides derived from a LysC digest is identical (not considering an unequal average occurrence of amino acids in the proteome or modified amino acids as well as the presence of more than one contaminating peptide in the precursor window). This likelihood drops further with higher numbered fragment ions.
The example peptide fragment ion spectrum in Figure 1C shows that isobaric isotopologue pairs were present for all identified b and y ions up to m/z 500 at a nominal resolution of 30,000. The peptide was quantified with an average ratio of 0.95 based on b2 and y2 isobaric isotopologues. In this example b3, b4, and y3 isobaric isotopologues were not considered for quantification because isobaric isotopologues were required to be within a ±5 mDa mass window in order to ensure that the correct isobaric isotopologue pair was identified. Because the resolving power is inverse proportional to the square root of m/z in an Orbitrap mass analyzer,11 only single fragment ion peaks were observed above m/z 500 for which the relative contribution of the individual isobaric isotopologues determined the peak centroid. Because a single light or heavy peak reflects the relative abundance of the isobaric isotopologue with higher signal intensity, the presence of only one isobar can be used for semiquantitative analyses.
In order to show rigorously that peptide quantifications are almost free from precursor interference, a HEK cell lysate was digested with trypsin or LysC and light or heavy labeled, respectively, mixed in a 1:1 ratio, and analyzed (Figure 2A). The sample harbors peptide pools that are either light only or heavy only or labeled with both isobaric isotopologues so that precursor contamination can be determined precisely (Figure 2B–E).
Figure 2.

Identification of precursor contamination. (A) A HEK cell lysate was digested with trypsin or LysC and either light or heavy labeled, respectively, and mixed in a 1:1 ratio prior to mass spectrometric analysis. (B–E) Peptides were segregated in four different pools as indicated on the left. Each peptide pool was analyzed for the number of light and heavy labeled b and y isobaric isotopologues (middle panel) for fragment ions b1–b6 and y1–y6. Isotopologues were grouped in light and heavy (“L and H”) or light only (“Light”) or heavy only (“Heavy”), and consecutive bars of the same color represent b1–b6 (blue) and y1–y6 (red) fragment ions. The first or the most prominent bar is labeled with the fragment ion number. Arrows indicate distortions that were caused by precursor contamination. Box plots on the right show the distribution of log2 transformed ratio measurements determined for each fragment ion series number with whiskers indicating the minimal and maximal value measured. Numbers above the box plots indicate the sum of spectra. The arrows point to distorted y1 ion ratio measurements.
First, we examined tryptic peptides with a C-terminal arginine and independent of the N-terminal amino acid preceding the site of cleavage, which could be either an arginine or lysine (Figure 2B). The setup of the experiment predicted that only N-terminal and not C-terminal fragment ions were labeled light and not heavy. Indeed, we observed almost exclusively b2 and higher numbered peptide fragments that were labeled light (Figure 2B, middle panel, “Light”); b1 ions were seldom detected because the oxazolone ion is not formed (with few exceptions). A simultaneous detection of light and heavy isotopologues (“L and H” group) was rare (<1%) but not unexpected because first the reagents used for labeling contained up to 1% isotope impurities, which makes it likely that heavy labeled methyl isobaric isotopologues were present and second interfering precursor ions that start with the identical N-terminal amino acid might be present in up to 5% of spectra. The corresponding isobaric isotopologue ratios were compressed toward 1:1 with increasing b ion series number (average ratio: 12.1-fold for b2, 3.7-fold for b3, and 0.9-fold for b4, Figure 2B, right panel). This compression of the ratio measurements most likely results from decreased average signal intensity with increased fragment ion series number (Supplemental Figure 4A), while a minimal signal intensity is required for the observation of both isobaric isotopologue peaks (Supplemental Figure 4B).
Peptides N-terminally cleaved after arginine and harboring a C-terminal lysine were exclusively a product of the digest with trypsin and thus both b and y ion series were light labeled only (Figure 2C). While the vast majority of b2, y2, and higher numbered peptide fragment ions (>95%) was measured without precursor contamination, heavy labeled lysine y1 ions, which derived from precursor contaminations, yielded to a simultaneous presence of light and heavy y1 isobaric isotopologues in 84% of spectra (Figure 2C, middle panel, arrow), and y1 ions observed as light only were reduced correspondingly (Figure 2C, arrowhead). Heavy labeled ions of higher fragment ion number were less frequent with 3.1% for y2, 1.1% for y3, and 0.1% for y4 ions. The average ratio H/L for y1 isobaric isotopologues was 5.3-fold, which is distorted toward 1:1 (Figure 2C, right panel, arrow). This ratio distortion was different from the ratio compression observed for the remaining y ion series (8.3-fold for y2, 3.2-fold for y3 and 1.4-fold for y4, Figure 2C, right panel). Heavy b ions were detected for b2 in 4.5%, b3 in 1.6%, and b4 in 0.5% of spectra with an average ratio of 10.1-fold for b2, 4.3-fold for b3, and 2.9-fold for b4 for the same reasons described above (Supplemental Figure 4).
Both enzymes trypsin and LysC generate peptides that are preceded by lysine and end with a lysine. Thus a substantial number of peptides yielded ratio measurements in both b and y ion series (Figure 2D, middle panel, “L and H”). In addition peptide fragment ions were determined as light or heavy only in about equal proportions (Figure 2D, middle panel, “Light” and “Heavy”). Y1 fragment ions yielded about twice as often a ratio measurement than y2 fragment ions, which is again most likely due to the presence of contaminating precursor peptides (Figure 2D, arrow). B2 and y2 isobaric isotopologues as well as isobaric isotopologues of larger fragment ions were highly abundant and measured close to the expected ratio of 1:1. Thus b2 and y2 ion isobaric isotopologues as well as higher numbered fragment ion isobaric isotopologues quantified peptides with high precision and almost free from interfering precursor peptides.
Finally, we analyzed peptides cleaved N- and C-terminally at lysine and which harbor at least one arginine in the peptide sequence (Figure 2E). This peptide population is labeled heavy because LysC cleaves after lysine only, whereas trypsin cleaves the peptide after the internal arginine into two peptides, although mis-cleavage can occur. Figure 2E shows that heavy only labeled b and y ions (“Heavy”) were preferentially observed as expected with the exception for the y1 isobaric isotopologues. In 66% of spectra light labeled y1 isobaric isotopologues were detected along with the expected heavy labeled y1 fragment ion (Figure 2E, middle panel, arrow). These light y1 isobaric isotopologues were derived from contaminating precursor ions. Conversely, a reduced number of heavy only y1 isobaric isotopologues was observed (Figure 2E, middle panel, arrowhead).
Arginine-containing peptide sequences are sometimes not cleaved by trypsin, resulting in peptides in which a cleavage site was missed. In this case, both heavy and light isotopologue isobaric isotopologues were anticipated. Indeed, average ratios for fragment ions b2, b3, y2, and y3 were measured close to a ratio of 1:1, which indicated that trypsin failed to cleave after arginine in a number of peptides.
In summary, isobaric isotopologues derived from contaminating precursor ions were present in up to 86% of spectra. Thus peptide quantifications were more accurate when fragment ions were excluded that were identical for the interfering and selected precursor peptide. Quantification accuracy increased when measurements were based only on higher numbered b and y ions that were more specific for the identified peptide. Thus the quantification of isobaric isotopologues in tandem mass spectra represents an alternative approach to reduce interference caused by precursor contamination.
Proteome-Wide Isobaric Isotopologue Quantification
To evaluate quantification efficiency and applicability of the method to shotgun proteomics, we compared the proteome of two isogenic lung epithelial cells lines, HBE and CFBE. Both cell lines express the cystic fibrosis transmembrane conductance regulator (CFTR) in low abundance in this cell culture model for cystic fibrosis. Deletion of phenylalanine 508 (ΔF508) causes CFTR mis-folding and cellular accumulation, which is responsible for over 80% of cases of cystic fibrosis, the most common genetically inherited childhood disease in Caucasians. Wt CFTR is present in HBE and ΔF508 CFTR in CFBE cells.
Following digestion with trypsin we dimethylated the proteome of HBE and CFBE cells with light and heavy isobaric isotopologues, respectively, and performed a MudPIT experiment as described above. Peptides were then identified with ProLuCID12 in a search against the human Uniprot protein database and filtered with DTASelect2 to a false positive rate of <1% based on a complementary decoy database search strategy. Based on the HCD tandem mass spectra acquired, 3929 proteins were identified with a global false discovery rate of 0.99%. About equal amounts of light only or heavy only labeled fragment ion isobaric isotopologues were identified (Figure 3A). b2 and y2 and higher numbered isobaric isotopologues were quantified with at least one ratio measurement for >80% of proteins with an average ratio close to 1:1 (Figure 3B), whereas y1 and b1 ions were excluded because of the prevalent precursor ion interference. Higher numbered b and y ions can be included; however, the quantification result did not improve overall because of the ratio compression described above.
Figure 3.
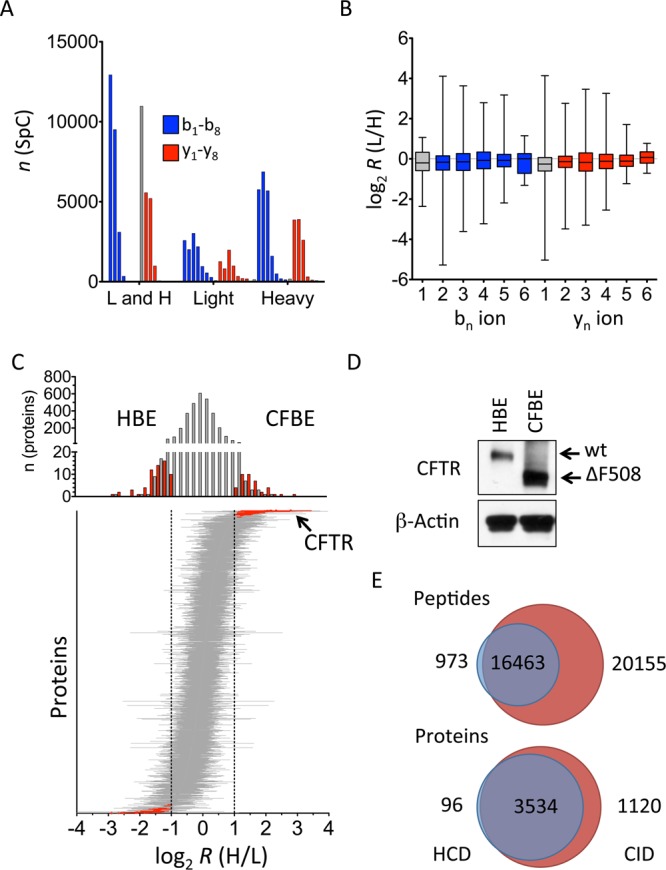
Comparison of wt and ΔF508 CFTR expressed HBE and CFBE cells, respectively. (A) The bar graph shows the absolute number of measurements for light and heavy, light only, and heavy only isobaric ion measurements in one MudPIT experiment. The isobaric b ion series (b1–b8) is indicated in blue, whereas the y ion series is indicated in red. Gray shaded y1 ions are not considered for quantification. (B) The box plot shows the distribution of the ratios measured for b1–b6 and y1–y6. (C) Upper panel: The bar graph shows the frequency distribution of proteins versus the average ratio determined for each protein. Red bars indicate proteins with at least 1.4-fold (one SD) difference to a 1:1 ratio. Lower panel: The blot shows all proteins sorted according to their mean ratio along the y-axis. Bars indicate the standard deviation. Proteins of which the ratio diverges at least one standard deviation (gray, dashed vertical lines) are shown in red. (D) CFTR was detected by Western blot in HBE and CFBE whole cell protein lysates. Actin is shown as loading control. (E) The number of spectra and proteins that were quantified on the basis of HCD alone (HCD) or on the basis of HCD tandem mass spectra of the matching, identified CID tandem mass spectra (CID) is indicated in the corresponding Venn diagrams.
The size of the quantified proteome increased to >90% in the case where quantifications were based on peptides detected with at least one light only or heavy only isotopologue fragment ion. Protein ratios between CFBE and HBE cells were measured with high enough precision and accuracy to discern differential protein expression. Renormalized protein ratios were equally distributed around a ratio of 1:1 with a standard deviation of 1.4-fold (Figure 3C). This measurement variation mainly reflected the precision by which a 1:1 isobaric isotopologue ratio can be determined. Sixty-three proteins were less and 40 proteins more abundant in CFBE cells with at least two standard deviations (Figure 3C). For example, CFTR is estimated to be present in the range of only 100 molecules/cell and was detected with one peptide in this MudPIT experiment. ΔF508 CFTR was 3.5-fold more abundant in CFBE than in HBE cells based on the ratio determined for the b2 fragment ion. Additional fragment ions of this peptide were measured as heavy only and thus supported the enrichment of ΔF508 CFTR protein in CFBE cells. A Western blot detected CFTR in CFBE and HBE cells and validated the quantification result obtained from the quantitation of the isobaric isotopologues (Figure 3D).
Combining CID and HCD tandem mass spectra in one search yielded 4750 quantified proteins based on 54,054 individual identified spectra. The majority of peptides were identified on the basis of CID fragmentation (36,618 spectra). HCD contributed 2% unique peptide identifications (Figure 3E). Individual CID tandem mass spectra were quantified based on the corresponding HCD tandem mass spectra of the same precursor ion, which increased the number of quantified fragment ions 1.87-fold and made it possible to quantify an additional 1120 unique proteins. Thus sequential HCD and CID measurements for the same peptide precursor are useful given the efficacy of CID for peptide identifications and of HCD for quantification.
Discussion
Here, we present an efficient approach to resolve ratio distortions caused by interfering precursor ions. In order to do so, peptides were dimethylated to encode isobaric isotopologues, and following HCD the ratio of isobaric isotopologues was determined for fragment ions identified in tandem mass spectra.
The method proved competitive to alternative isotope quantification approaches, and mass spectrometers with faster data acquisition at higher resolving power will allow quantitating additional, higher numbered fragment ions in less time to further improve in accuracy and precision. The ratio compression observed with increasing m/z value (ion series number) most likely depends on fragment ion intensity, which is dependent on instrument settings such as the amount of precursor ions isolated.
The measurement precision for individual peptides was increased because multiple measurements within a single tandem mass spectrum are possible. Having several fragment ions available made it possible to quantify >90% of an identified proteome in a single MudPIT experiment with drastically reduced ratio distortion caused by interfering precursor ions. Additional peptide fragment ions such as a, x, c, and z ions as well as ions with a defined neutral loss or loss of an immonium ion can be considered for quantitation as long as they are unambiguously identified and most likely unique to the peptide selected.
The variation of measurement was 1.4-fold for the isobaric isotopologue ratios. Similar variations have been observed for alternative quantification approaches and appear to be a consequence of random measurement errors that occur when two closely adjacent m/z peaks are detected with Fourier transformation-based mass spectrometers. Physical constraints during ion injection from the C-trap into the Orbitrap, coalescence of ion clouds in the Orbitrap, and additional FT parameter settings such as recording time of the frequency transient have been pointed out as sources for measurement errors in recent publications,13 and better instrument calibration routines might improve intensity ratio measurements in the future.
Recent publications show that the reagents used for reductive methylation can be varied in order to obtain a different isobaric isotopologue code8 and can be combined with isobaric peptide termini labeling (IPTL) in order to enable more complex labeling schemes.6b The approach described here can be readily applied to quantify peptides that are fragmented and measured simultaneously (spectrum multiplexing) or to peptides that are identified during a data independent acquisition of tandem mass spectra.
Conclusions
We show that the careful choice of chemical labeling (reductive methylation) combined with an optimal peptide fragmentation strategy (HCD) and subsequent detection of isobaric isotopologue fragment ions at sufficient mass resolution (>30,000), as well as a selection of appropriate fragment ions (b2, y2, or higher numbered fragment ions), enables almost accurate proteome quantification to near completeness despite the presence of interfering precursor ions.
Acknowledgments
We’re grateful to Jan Kaiser for comments on the manuscript. The work was funded in part by NIH P41RR011823 and P01 AG031097.
Glossary
Abbreviations
- CID
collision-induced dissociation
- HCD
higher energy collisional dissociation
- MS
mass spectrum
- CFTR
cystic fibrosis transmembrane conductance regulator
- SD
standard deviation
- HEK
human embryonic kidney
- N′
N-terminus
- L
light
- H
heavy
- MudPIT
multidimensional protein identification technology
- SpC
spectrum counts
Supporting Information Available
Supplementary figures as described in the text. This material is available free of charge via the Internet at http://pubs.acs.org.
The authors declare no competing financial interest.
Funding Statement
National Institutes of Health, United States
Supplementary Material
References
- a Washburn M. P. Driving biochemical discovery with quantitative proteomics. Trends Biochem. Sci. 2011, 363170–7. [DOI] [PubMed] [Google Scholar]; b Nikolov M.; Schmidt C.; Urlaub H. Quantitative mass spectrometry-based proteomics: an overview. Methods Mol. Biol. 2012, 893, 85–100. [DOI] [PubMed] [Google Scholar]
- a Werner T.; Becher I.; Sweetman G.; Doce C.; Savitski M. M.; Bantscheff M. High-resolution enabled TMT 8-plexing. Anal. Chem. 2012, 84167188–94. [DOI] [PubMed] [Google Scholar]; b Treumann A.; Thiede B. Isobaric protein and peptide quantification: perspectives and issues. Expert Rev. Proteomics 2010, 75647–53. [DOI] [PubMed] [Google Scholar]
- Washburn M. P.; Wolters D.; Yates J. R. 3rd Large-scale analysis of the yeast proteome by multidimensional protein identification technology. Nat. Biotechnol. 2001, 193242–7. [DOI] [PubMed] [Google Scholar]
- a Ting L.; Rad R.; Gygi S. P.; Haas W. MS3 eliminates ratio distortion in isobaric multiplexed quantitative proteomics. Nat. Methods 2011, 811937–40. [DOI] [PMC free article] [PubMed] [Google Scholar]; b Wuhr M.; Haas W.; McAlister G. C.; Peshkin L.; Rad R.; Kirschner M. W.; Gygi S. P. Accurate multiplexed proteomics at the MS2 level using the complement reporter ion cluster. Anal. Chem. 2012, 84219214–21. [DOI] [PMC free article] [PubMed] [Google Scholar]
- a Vincent C. E.; Rensvold J. W.; Westphall M. S.; Pagliarini D. J.; Coon J. J. Automated gas-phase purification for accurate, multiplexed quantification on a stand-alone ion-trap mass spectrometer. Anal. Chem. 2013, 8542079–86. [DOI] [PMC free article] [PubMed] [Google Scholar]; b Wenger C. D.; Lee M. V.; Hebert A. S.; McAlister G. C.; Phanstiel D. H.; Westphall M. S.; Coon J. J. Gas-phase purification enables accurate, multiplexed proteome quantification with isobaric tagging. Nat. Methods 2011, 811933–5. [DOI] [PMC free article] [PubMed] [Google Scholar]
- a Koehler C. J.; Arntzen M. O.; Treumann A.; Thiede B. A rapid approach for isobaric peptide termini labeling. Methods Mol. Biol. 2012, 893, 129–41. [DOI] [PubMed] [Google Scholar]; b Koehler C. J.; Arntzen M. O.; de Souza G. A.; Thiede B. An approach for triplex-isobaric peptide termini labeling (triplex-IPTL). Anal. Chem. 2013, 8542478–85. [DOI] [PubMed] [Google Scholar]
- a Rose C. M.; Merrill A. E.; Bailey D. J.; Hebert A. S.; Westphall M. S.; Coon J. J. Neutron encoded labeling for Peptide identification. Anal. Chem. 2013, 85105129–37. [DOI] [PMC free article] [PubMed] [Google Scholar]; b McAlister G. C.; Huttlin E. L.; Haas W.; Ting L.; Jedrychowski M. P.; Rogers J. C.; Kuhn K.; Pike I.; Grothe R. A.; Blethrow J. D.; Gygi S. P. Increasing the multiplexing capacity of TMTs using reporter ion isotopologues with isobaric masses. Anal. Chem. 2012, 84177469–78. [DOI] [PMC free article] [PubMed] [Google Scholar]
- Zhou Y.; Shan Y.; Wu Q.; Zhang S.; Zhang L.; Zhang Y. Mass defect-based pseudo-isobaric dimethyl labeling for proteome quantification. Anal. Chem. 2013, 852210658–10663. [DOI] [PubMed] [Google Scholar]
- Park S. K.; Yates J. R., 3rd, . Census for proteome quantification. Current protocols in bioinformatics / editoral board, Andreas D. Baxevanis, 2010, Chapter 13, Unit 13 12 1–11. [DOI] [PubMed] [Google Scholar]
- Moore G.; Crichton R. R. Reductive methylation: a method for preparing functionally active radioactive ribosomes. FEBS Lett. 1973, 37174–8. [DOI] [PubMed] [Google Scholar]
- a Boersema P. J.; Raijmakers R.; Lemeer S.; Mohammed S.; Heck A. J. Multiplex peptide stable isotope dimethyl labeling for quantitative proteomics. Nat. Protoc. 2009, 44484–94. [DOI] [PubMed] [Google Scholar]; b Wilson-Grady J. T.; Haas W.; Gygi S. P. Quantitative comparison of the fasted and re-fed mouse liver phosphoproteomes using lower pH reductive dimethylation. Methods 2013, 61, 277–86. [DOI] [PubMed] [Google Scholar]
- Zubarev R. A.; Makarov A. Orbitrap mass spectrometry. Anal. Chem. 2013, 85115288–96. [DOI] [PubMed] [Google Scholar]
- Xu T.; Venable J. D.; Park S. K.; Cociorva D.; Lu B.; Liao L.; Wohlschlegel J.; Hewel J.; Yates J. R. ProLuCID, a fast and sensitive tandem mass spectra-based protein identification program. Mol. Cell. Proteomics 2006, 510S174–S174. [Google Scholar]
- a Kaufmann A.; Walker S. Accuracy of relative isotopic abundance and mass measurements in a single-stage orbitrap mass spectrometer. Rapid Commun. Mass Spectrom. 2012, 2691081–90. [DOI] [PubMed] [Google Scholar]; b Erve J. C.; Gu M.; Wang Y.; DeMaio W.; Talaat R. E. Spectral accuracy of molecular ions in an LTQ/Orbitrap mass spectrometer and implications for elemental composition determination. J. Am. Soc. Mass Spectrom. 2009, 20112058–69. [DOI] [PubMed] [Google Scholar]; c Gorshkov M. V.; Fornelli L.; Tsybin Y. O. Observation of ion coalescence in Orbitrap Fourier transform mass spectrometry. Rapid Commun. Mass Spectrom. 2012, 26151711–7. [DOI] [PubMed] [Google Scholar]
Associated Data
This section collects any data citations, data availability statements, or supplementary materials included in this article.