

Abstract

Pancreatic cancer is a lethal disease where specific early detection biomarkers would be very valuable to improve outcomes in patients. Many previous studies have compared biosamples from pancreatic cancer patients with healthy controls to find potential biomarkers. However, a range of related disease conditions can influence the performance of these putative biomarkers, including pancreatitis and diabetes. In this study, quantitative proteomics methods were applied to discover potential serum glycoprotein biomarkers that distinguish pancreatic cancer from other pancreas related conditions (diabetes, cyst, chronic pancreatitis, obstructive jaundice) and healthy controls. Aleuria aurantia lectin (AAL) was used to extract fucosylated glycoproteins and then both TMT protein-level labeling and label-free quantitative analysis were performed to analyze glycoprotein differences from 179 serum samples across the six different conditions. A total of 243 and 354 serum proteins were identified and quantified by label-free and TMT protein-level quantitative strategies, respectively. Nineteen and 25 proteins were found to show significant differences in samples between the pancreatic cancer and other conditions using the label-free and TMT strategies, respectively, with 7 proteins considered significant in both methods. Significantly different glycoproteins were further validated by lectin-ELISA and ELISA assays. Four candidates were identified as potential markers with profiles found to be highly complementary with CA 19–9 (p < 0.001). Obstructive jaundice (OJ) was found to have a significant impact on the performance of every marker protein, including CA 19–9. The combination of α-1-antichymotrypsin (AACT), thrombospondin-1 (THBS1), and haptoglobin (HPT) outperformed CA 19–9 in distinguishing pancreatic cancer from normal controls (AUC = 0.95), diabetes (AUC = 0.89), cyst (AUC = 0.82), and chronic pancreatitis (AUC = 0.90). A marker panel of AACT, THBS1, HPT, and CA 19–9 showed a high diagnostic potential in distinguishing pancreatic cancer from other conditions with OJ (AUC = 0.92) or without OJ (AUC = 0.95).
Keywords: serum, pancreatic cancer, glycoprotein biomarker, quantitative proteomics, TMT protein-level labeling, ELISA
Introduction
Pancreatic cancer is one of the most lethal malignancies. Although it is only the tenth most common cancer in the United States, it is the fourth leading cause of cancer-related death.1−3 According to the SEER (Surveillance, Epidemiology, and End Results) database, pancreatic cancer has a poor long-term outcome, with a five-year survival rate of less than 5%.1 However, a patient’s prognosis is considerably improved when malignant lesions are identified at an early stage of the disease and removed by surgical resection.4 Unfortunately, the overwhelming majority of patients do not present with early stage disease and, currently, there are no clinically useful strategies for early detection of pancreatic cancer.5 Carbohydrate antigen 19–9 (CA 19–9), the current established pancreatic cancer biomarker, does not provide the sensitivity and specificity required to detect early pancreatic cancer.6 Moreover, CA 19–9 may be absent in about 10–15% of the population who are carriers of the Lewis-negative genotype and do not secrete the antigen.7 Thus, a more reliable and universal biomarker or biomarker panel for pancreatic cancer diagnosis is urgently needed.
The advance of proteomic technology based on mass spectrometry has propelled investigators to find several alternative serum biomarker candidates to overcome the limitations of CA 19–9. A variety of methods have been developed to identify differentially abundant proteins in pancreatic cancer.8−10 Among the single biomarker or biomarker panels that have been generated so far, none have proven to be clinically superior to CA 19–9.11,12 This situation requires a re-evaluation of current pancreatic cancer biomarker discovery strategies. Analysis of serum glycoproteins might be an avenue for pancreatic biomarker discovery based on the following rationale: (1) the majority of current U. S. Food and Drug Administration (FDA) approved cancer biomarkers currently used as therapeutic targets or for clinical diagnosis are glycoproteins,13 (2) abnormal protein glycosylation patterns are associated with cancer progression,14 and (3) screening serum glycoproteins in serum biomarker discovery has been shown to be a powerful means to identify novel diagnostic markers in other cancers.15,16
Many biomarker studies for pancreatic cancer seek to find biomolecules that discriminate individuals with a disease against a background population of normal controls.8,9 Though these binary comparisons can be useful, it does not faithfully reflect the nuanced state of the population best served by such biomarkers. Symptomatically similar conditions can confound traditional biomarkers, perhaps due to partially overlapping molecular mechanisms of disease. From a practical standpoint, useful biomarkers need to differentiate a disease against a range of similar conditions. The discovery of novel biomarkers for pancreatic cancer requires more than comparing healthy adults to cancer patients regardless of the platform for discovery. High-risk factors for pancreatic cancer include a family history of pancreatic cancer, hereditary pancreatitis, cystic fibrosis, chronic pancreatitis, long-term type II diabetes, and age.17−19 In addition, around 75% of patients with pancreatic cancer have obstructive jaundice.20 The biomarker of CA 19–9 also has been found to be elevated in both nonmalignant conditions (e.g., pancreatitis, pancreatic cysts—both pseudocysts and cystic neoplasms of the pancreas—and OJ) and other diseases (e.g., diabetes).17 Therefore, studies designed to discover potential early detection biomarkers need to have age-matched samples from men and women representing chronic pancreatitis, cyst, obstructive jaundice, and diabetes.
In order to find a more reliable biomarker or biomarker panel, several pancreatic cancer related disease states (diabetes, cystic neoplasms of the pancreas, chronic pancreatitis, and obstructive jaundice) along with healthy controls were compared with pancreatic cancer patients. Lectin extraction and quantitative proteomics methods were applied to discover potential serum glycoprotein biomarkers that distinguish pancreatic cancer from the other groups. A lectin array strategy was first applied to detect global lectin-specific glycosylation changes in serum proteins. The lectin Aleuria aurantia (AAL), which is specific for fucose, showed a significantly different response and was used to enrich glycoproteins. Because more than 170 serum samples needed to be quantified, an isobaric protein-level labeling strategy of serum glycoprotein quantification was developed to minimize the influence of inconsistency during sample preparation.21 Twenty-five significantly different proteins were obtained by TMT isobaric protein-level labeling quantification analysis. The serum samples were also identified and quantified by a label-free method in parallel. Seven glycoproteins presented significant differences using both methods. ELISA and lectin-ELISA were used to further validate the potential markers. The potential biomarkers identified were found to be complementary with CA 19–9. A marker panel of AACT, THBS1, HPT, and CA 19–9 showed a high diagnostic potential in distinguishing pancreatic cancer from other controls (AUC = 0.92).
2. Materials and Methods
2.1. Serum Samples
The 179 serum samples used in this study included prospectively recruited patients with a confirmed diagnosis of pancreatic cancer, chronic pancreatitis, pancreatic cysts, obstructive jaundice, long-term (10 or more years) type II diabetes mellitus, and healthy adults with the ability to provide written informed consent. Pancreatic cysts samples included 20 intraductal papillary mucinous neoplasm (IPMN) and 10 mucinous cystic neoplasm (MCN) serum samples. Pancreatic cancer samples were composed of 3 grade IA, 1 grade IB, 6 grade IIA, 8 grade IIB, 2 grade III, and 17 grade IV patients serum samples. Patients with other cancers or transplant recipients were excluded. All pancreatic cancer patients had not undergone any form of treatment at the time of serum collection. The detailed demographic information is presented in Table 1. The sera from the chronic pancreatitis, pancreatic cysts, obstructive jaundice, type II diabetes mellitus, and healthy controls were age- and sex-matched to the cancer group. Serum samples were placed at room temperature for 30 min to allow the clot to form in the red topped tubes and then centrifuged at 1300g at 4 °C for 20 min. The serum was transferred to polypropylene tubes and stored at −70 °C until assayed. All serum samples were labeled with a unique identifier to protect the confidentiality of the patient. None of the samples were thawed more than twice before analysis. This study was approved by the Institutional Review Board for the University of Michigan Medical School. Before high-abundance protein depletion of the serum, the samples were randomized into 35 sets in order to reduce individual variation from different groups. Each set included four to six samples from the different disease groups. In addition, normal serum samples pooled from 30 healthy people (Bioreclamation LLC, Westbury, NY) were used as an internal standard for the TMT labeling experiments.
Table 1. Characteristics of the Study Patientsa.
| normal | cancer | type II DM | cyst | CP | OJ | ||
|---|---|---|---|---|---|---|---|
| gender | total | 30 | 37 | 30 | 30 | 30 | 22 |
| male | 14 | 16 | 20 | 9 | 17 | 13 | |
| female | 16 | 21 | 10 | 21 | 13 | 9 | |
| age, years | mean | 60 | 60 | 61 | 61 | 58 | 58 |
| SEM | 2.34 | 1.70 | 1.95 | 2.70 | 1.93 | 2.64 | |
| range | 28–89 | 28–80 | 37–82 | 24–86 | 30–83 | 46–78 | |
| race | white | 30 | 31 | 10 | 28 | 27 | 22 |
| otherb | 0 | 6 | 20 | 2 | 2 | 0 | |
| diabetes | 0 | 15 | 30 | 8 | 11 | 0 | |
| jaundice | 0 | 11 | 0 | 2 | 3 | 22 |
Abbreviation: cancer, pancreatic cancer; cyst, cystic neoplasms of the pancreas; CP, chronic pancreatitis; OJ, obstructive jaundice.
Other races include Black/African American; Bi/Multiracial/Hispanic, and unknown.
2.2. Serum Depletion
IgY-14 LC10 columns (Sigma, St. Louis, MO) were used to deplete 14 high-abundance proteins in this study. The depletion was performed with 250 μL serum according to the manufacturer’s instructions. The serum sample was diluted 5 times with 1 X depletion buffer and loaded onto an IgY14 LC10 column. The flow-through fraction between 0 to 30 min was transferred into a 15 mL YM-3 centrifugal device (Millipore, Billerica, MA) and centrifuged at 4000g, followed by buffer exchange three times with 5 mL deionized water. The final sample volume was 300 μL. The final protein concentration was measured using a Bradford assay kit (Bio-Rad, Hercules, CA). The depletion of each set of serum samples was completed in the same day so that all the samples were processed consistently in the same set.
2.3. Lectin Array
Lectin array analysis was performed as described previously.22 Sixteen lectins (Vector Laboratories, Burlingame, CA) with different specificities were dissolved in 10% PBS to 1 mg/mL and spotted in triplicate on 16 pad nitrocellulose slides (Avid, Grace Bio-Laboratories) using a piezoelectric noncontact printer (Nano plotter; GESIM, Germany). The final volume of each spot was 2.5 nL from five-spotting of 500 pL. The slides were incubated in a humidity-controlled incubator (>45% humidity) overnight to allow lectin immobilization. After incubation, the slides were blocked with 1% BSA/PBS for 1 h and washed three times with PBST (0.1% Tween 20 in PBS).
A total of 10 μg of protein from each depleted serum sample were reduced by 5 mM TCEP for 30 min and labeled with EZ-link iodoacetyl-LC-biotin (Pierce) for 2 h. The reaction was stopped by adding 1 μL of 2-mercaptoethanol (Sigma). The labeled sample was diluted 100 times followed by incubation with each block on the slides for 1 h. After washing with PBST for 5 min, the slides were incubated with streptavidin-labeled fluorescent dye Alexa 555 (Invitrogen Biotechnology) for 1 h. The intensity from each spot was detected using fluorescent detection with a microarray scanner (GenePix 4000A; Axon).
2.4. TMT Labeling at the Protein-Level
Tandem mass tags (TMT) are chemical labels used to multiplex quantitation of proteins extracted from cells and tissues in a single MS analysis. TMT labeling at the protein-level was performed as described previously21 with some modifications. One hundred micrograms of depleted serum protein sample from each of the different disease groups plus one internal standard were labeled at the protein-level using TMT reagent. Serum samples were adjusted to 4 M urea using 8 M urea, reduced with 5 mM TCEP for 30 min at 37 °C, and alkylated with 25 mM iodoacetamide for 30 min in the dark. The buffer was exchanged to 50 mM TEAB in 4 M urea with a final volume of 100 μL. According to the manufacture’s instruction, TMT labeling reagents were dissolved in 30 μL DMSO (Fluka, St. Louis, MO), transferred to sample tubes, reacted for 2 h at room temperature, and quenched for 15 min with hydroxylamine (final concentration of 0.5%). Samples were combined, diluted to less than 5% DMSO using lectin binding buffer (see below), transferred to a YM-3 centrifugal filter, and exchanged into lectin binding buffer for glycoprotein enrichment.
2.5. Glycoprotein Enrichment
Glycoprotein enrichment was performed as described previously15 with some modifications. A column packed with 600 μL of agarose-bound AAL was washed with 3 mL binding buffer (20 mM Tris, 0.15 M NaCl, pH = 7.5, protease inhibitor 1:100). Samples in 1 mL of binding buffer were loaded onto the column and incubated for 15 min twice. Five column volumes of binding buffer were used to wash away unbound proteins. Bound glycoproteins were eluted with four volumes of elution buffer (200 mM fucose in binding buffer). The elution buffer was exchanged using a 4 mL YM-3 filter to 50 mM NH4HCO3 for digestion.
2.6. Enzymatic Digestion
For the label-free samples, glycoproteins were reduced with 5 mM TCEP for 30 min at 37 °C, then alkylated with 15 mM iodoacetamide in the dark at room temperature for 30 min. Trypsin (Promega, Madison, WI) was added to digest protein at 37 °C overnight with a ratio of enzyme to protein of 1:30. The TMT labeled glycoproteins were divided into two equal fractions and digested with trypsin or Asp-N (Promega, Madison, WI) at 37 °C overnight. Glycopeptides were deglycosylated using PNGase F (New England Biolabs, Ipswich, MA) at 37 °C for 16 h and dried using a SpeedVac concentrator (Thermo Savant, Milford, MA). The samples were desalted using C18 ZipTips (Millipore, Billerica, MA) before LC-MS/MS analysis.
2.7. LC-MS/MS Analysis of TMT Labeled Samples
TMT-labeled peptide mixtures were dissolved in 0.1% formic acid (FA) and loaded onto an Eksigent Nano 2D System (ABsciex) equipped with a commercial New Objective ProteoPepID trap column (150 um × 25 mm) and an analytical column (75 um × 100 mm, C18, 5 μm, 300A) coupled to an Orbitrap Velos mass spectrometer (Thermo Fisher Scientific). Peptides were separated with 0.1% FA in water (solvent A) and 0.1% FA in acetonitrile (solvent B) using a 100 min linear gradient from 2 to 32% solvent B at a flow rate of 300 nL/min. The mass spectrometer was operated by taking one full MS scan followed by ten HCD MS/MS scans on the ten most intense ions from the MS spectrum. Other mass spectrometer operating conditions included: 45% NCE; ± 1.5 Da isolation window; and dynamic exclusion enabled with a 10 ppm exclusion window. Exclusion settings were set with a repeat count of 2 using a repeat duration of 20 s and exclusion duration of 20 s. The resolution of full scans (m/z 400.0–1800.0) and HCD scans (fixed start from m/z 100.00) was set to 30 000 and 7 500, respectively. Ions with +1 or unassigned charge states were rejected for MS/MS analysis. The maximum injection time was 250 ms for the FTMS full scan and 200 ms for the FTMS MSn scan. The AGC target value was set as 100 000 for the FTMS scan and 40 000 for the FTMS MSn scan.
Acquired MS/MS spectra were searched against a forward-reverse database generated from the UniProt human database (released Nov. 2010) using SEQUEST in Proteome Discoverer 1.1 (Thermo). Searches were performed using the following settings: precursor ion m/z tolerance, ± 10 ppm; fragment ion m/z tolerance, ± 0.03 Da; two missed cleavages allowed; static modification, carbamidomethylation (+57.02146 Da, C) and TMT 6-plex (+219.163 Da) of lysines and protein N-termini; dynamic modifications: oxidation (+15.99492 Da, M) and deamidation (+0.98402 Da, N). Identified peptides were filtered using a 1% peptide-level false discovery rate (FDR) and quantification was performed using reporter ions. For quantification, reporter ion intensities were extracted using Proteome Discoverer with the following parameters: (1) reject all quantitative values if not all quantitative channels are present; (2) do not replace missing quantitative values with the minimum intensity; (3) consider only proteins from different protein groups for peptide uniqueness; (4) the tolerance for reporter ion extraction is 0.01 Da.
2.8. LC-MS/MS Analysis of Label-Free Samples
The tryptic peptides from the label-free samples were analyzed by LC-MS/MS using an LTQ mass spectrometer (Thermo Finnigan, San Jose, CA). Samples were loaded on a Paradigm MG4 micropump system (Michrom Biosciences, Inc., Auburn, CA) equipped with a Nano C18 trap column and C18 analytical column (0.1 mm × 150 mm, C18 AQ particles, 5 μm, 200 Å, Michrom Biosciences, Inc., Auburn, CA). A 90 min linear gradient from 2 to 32% solvent B (solvent A, 0.1% FA in HPLC water; solvent B, 0.1% FA in acetonitrile) was used to separate peptides at a flow rate of 400 nL/min. The MS instrument was operated in positive ion mode. The nano ESI spray voltage was set at 1.5 kV and the capillary voltage at 30 V. The ion activation was achieved by utilizing helium at normalized collision energy of 35%. The data were acquired in data-dependent mode using the Xcalibur software. For each cycle of one full mass scan (range of m/z 400–2000), the ten most intense ions in the spectrum were selected for tandem MS analysis, unless they appeared in the dynamic or mass exclusion lists.
All MS/MS spectra were searched against the UniProt human database (released Nov. 2010). The search parameters were as follows: (1) fixed modification, carbamidomethyl of C; (2) variable modification, oxidation of M; (3) allowing two missed cleavages; (4) peptide ion mass tolerance 1.50 Da (Average MW); (5) fragment ion mass tolerance 0.8 Da (Isotopic MW); (6) peptide charges +1, +2, and +3. Identified peptides were filtered using a 1% FDR.
2.9. ELISA Assay
All ELISAs of α-1-antichymotrypsin (Abcam), haptoglobin (GenWay), α-1-antitrypsin (Bethyl Laboratories), thrombospondin-1 (GenWay), leucine-rich α-2-glycoprotein (Immuno-Biological Laboratories Co., Ltd.), and CA19–9 (Abnova) were performed according to the manufacturer’s instructions. Calibration curves were prepared using purified standards for each protein assessed. Curves were fit by linear or 4-parameter logistic regression according to each manufacturer’s instructions.
2.10. Lectin ELISA Assay
In-plate lectin-ELISA assays were performed as described previously16 with some modifications. Briefly, monoclonal antibodies were coated to each well of a 96-well ELISA plate by adding 100 μL of 10 ng/μL antibody and incubated at 37 °C for 1 h. The coated antibodies were oxidized on the plates with 200 mM NaIO4 at 4 °C for 5 h and derivatized with 1 mM MPBH and 1 mM Cys–Gly overnight. To reduce nonspecific binding, the plates were then blocked with 3% BSA in PBST (0.1% Tween 20 in PBS) at 37 °C for 1 h. One hundred microliters of serum samples diluted 50 fold with 0.1% Brij in PBST were added to each well of a 96-well ELISA plate. After 1 h incubation, the plate was rinsed with 350 μL of PBST five times to remove unbound proteins. One hundred microliters of biotinylated AAL (1 μg/mL) was added to bind with fucosylated antigens. HRP-conjugated streptavidin was then applied to each well and incubated at 37 °C for 1 h. After washing three times with PBST buffer, 100 μL of TMB working solution was added and the reaction was stopped by adding 100 μL of stop solution. The absorbance of the plate was measured at 450 nm.
2.11. Statistical Analysis
All statistical analyses were performed using SPSS 16. Statistical differences were determined using the Student’s t test, one-way analysis of variance (ANOVA). For all statistical comparisons, p < 0.05 was taken as statistically significant. Receiver operating characteristic (ROC) curves were produced in terms of the sensitivity and specificity of markers at their specific cutoff values. Multivariate analysis was done by logistic regression to find the best-fitting multivariate model for each comparison group.
3. Results
3.1. Study Design
The study design is briefly shown in Figure 1. Serum samples were collected with informed consent from 179 patients with various conditions: pancreatic cancer, chronic pancreatitis, pancreatic cysts, obstructive jaundice, long-term (for 10 or more years) type II diabetes mellitus, and no related conditions (normals). The sera from the 30 chronic pancreatitis patients, 30 pancreatic cysts patients, 22 obstructive jaundice patients, 30 type II diabetes mellitus patients, and 30 healthy people were age- and sex-matched to the 37 pancreatic cancer patients. Detailed characteristics of the study patients are shown in Table 1. All of the samples were first randomized into 35 sets (Supporting Information Table S1). Each set included four to six samples from different disease groups with at least one cancer per set. Each set was processed and was analyzed at the same time to maintain consistency. Fourteen high-abundance proteins were removed using a depletion column and the protein amount was determined by Bradford assay. Serum samples were then interrogated using lectin microarrays against a panel of sixteen lectins to identify broad glycoprotein pattern changes. AAL lectin was then used to extract glycoproteins, which were further identified and quantified by protein-level TMT labeling and spectral counting label-free quantification methods. Protein identification and quantification was performed by LC/MS on a Orbitrap Velos and an LTQ linear ion trap. After statistical analysis, potential candidates were further validated by ELISA or lectin-ELISA.
Figure 1.
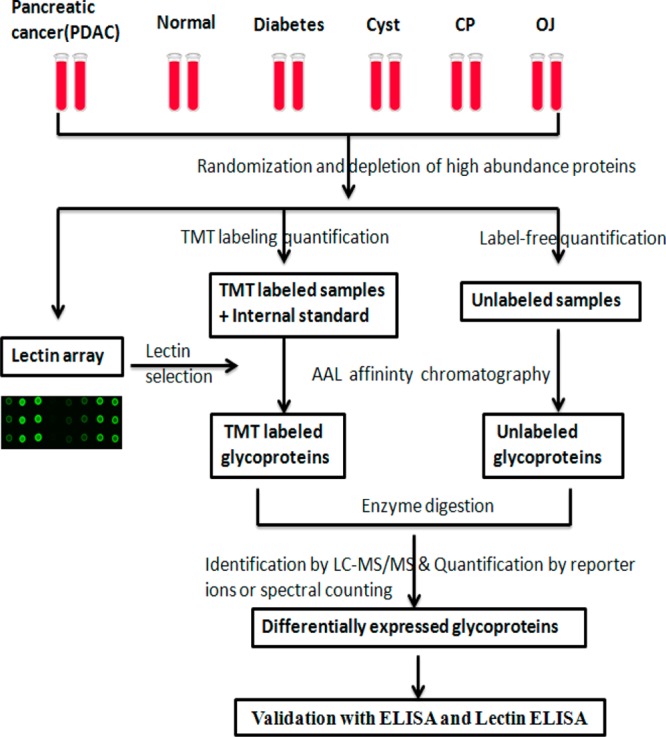
Study design for identification of serum glycoprotein markers for pancreatic cancer. Depleted sera from pancreatic cancer, diabetes, cyst, chronic pancreatitis, obstructive jaundice, and healthy controls were first applied to a lectin array. On the basis of the results of lectin array analysis, glycoproteins were extracted using AAL lectin, which were quantified by MS-based quantitative proteomics (TMT protein-level labeling and spectral counting methods). Potential candidates were validated by ELISA and lectin-ELISA.
3.2. Overall Glycosylation Changes Detected by Lectin Array
A lectin array consisting of 16 selected lectins was used to investigate overall glycosylation changes between pancreatic cancer and the other conditions. Carbohydrate specificities of the 16 lectins used for lectin microarray are shown in the Supporting Information Table S2. As shown in the Supporting Information Figure S1A, 16 lectins were analyzed across 6 different group samples. Each lectin was analyzed in triplicate in each block. The CV was less than 5% among different spots. Ten sets of samples amounting to 62 samples total were run in the experiments. The experimental reproducibility is also shown in Supporting Information Figure S1C (R2 = 0.99). The signal intensity of each lectin in all of the analyzed samples was normalized by the mean value of the total signal intensity in each block. The t-test method was used to analyze the differences between cancer samples with other controls. We found that AAL and DBA lectin showed a significant difference in the cancer samples compared to other controls (Supporting Information Figure S1B). Also the signal intensity resulting from AAL is much stronger than that of DAB. In addition, twice the number of proteins were identified in AAL column eluates compared to DBA column eluates using MS analysis. Previous reports have shown that abnormal fucosylation plays an important role in many pathological processes, such as pancreatic cancer23,24 and hepatocellular carcinoma (HCC).15,25 Therefore, AAL lectin was utilized to extract fucosylated glycoproteins, which was performed using a quantitative proteomics analysis to find potential biomarker candidates.
3.3. Discovery of Serum Glycoprotein Markers Using a Label-Free Quantitative Strategy
To discover glycoprotein markers, a spectral counting label-free method was first applied to identify differentially abundant glycoproteins. Two hundred micrograms of depleted serum proteins from each patient in the same set were incubated with the AAL column. The eluted glycoproteins from each sample were digested and analyzed by LC-MS/MS in triplicate. The data were searched and identified peptides were filtered at 1% FDR. To quantify different proteins by spectral counting, the following criteria were applied: each protein had to be identified in at least three patients in each disease group and there must be more than three spectral counts. To reduce variation across runs and samples, the total spectral counts of each protein were normalized against the total number of identified spectra per run. In total, 243 proteins were used for quantification analysis from 35 sample sets (Supporting Information Table S3). After statistical analysis, 19 proteins were considered as differentially abundant (p value <0.05); detailed information and p values are shown in Table 2. Some of the differentially abundant proteins were also found in previous reports, such as haptoglobin.26 Most of the differentially abundant proteins were identified for the first time in this study.
Table 2. Proteins with Significantly Differential Abundance Identified by Label-Free Quantitative Strategy.
| name | protein name | description | p value | mean difference | detected sample numberα |
|---|---|---|---|---|---|
| P55058 | PLTP | phospholipid transfer protein | <0.001 | 0.37 | 27 |
| P01011 | AACT | α-1-antichymotrypsin | <0.001 | 1.30 | 165 |
| Q99784-3 | NOE1 | isoform 3 of noelin | 0.001 | 0.44 | 53 |
| P00738 | HPT | haptoglobin | 0.010 | 1.60 | 95 |
| Q92878 | RAD50 | DNA repair protein RAD50 | 0.001 | 0.42 | 22 |
| P51884 | LUM | lumican | 0.003 | 0.63 | 167 |
| P27487 | DPP4 | dipeptidyl peptidase 4 | 0.003 | 0.50 | 115 |
| P14151 | LYAM1 | l-selectin | 0.005 | 0.70 | 164 |
| P12821-2 | ACE | isoform soluble of angiotensin-converting enzyme | 0.007 | 0.53 | 86 |
| Q9NPG3-2 | UBN1 | isoform 2 of ubinuclein-1 | 0.008 | 0.73 | 42 |
| P36955 | PEDF | pigment epithelium-derived factor | 0.009 | 0.44 | 26 |
| P02750 | LRG | leucine-rich α-2-glycoprotein | 0.012 | 1.53 | 170 |
| P54289-4 | CA2D1 | isoform α-2d of voltage-dependent calcium channel subunit α-2/δ-1 | 0.012 | 0.27 | 65 |
| Q96PD5 | PGRP2 | N-acetylmuramoyl-l-alanine amidase | 0.017 | 0.35 | 49 |
| P02766 | TTHY | transthyretin | 0.018 | 0.59 | 146 |
| P43652 | AFAM | afamin | 0.035 | 0.27 | 22 |
| Q9NQC1-3 | JADE2 | isoform 3 of protein jade-2 | 0.038 | 0.42 | 18 |
| P06396-2 | AGEL | isoform cytoplasmic of gelsolin | 0.042 | 0.39 | 39 |
| Q96IY4-2 | CBPB2 | isoform 2 of carboxypeptidase B2 | 0.048 | 0.56 | 49 |
Detected sample number means the proteins were identified in the number of different samples from all sets.
3.4. Discovery of Serum Glycoprotein Markers Using TMT Labeling at Protein-Level Quantitative Strategy
Protein-level isobaric labeling was also used as a quantitative strategy to discover serum glycoprotein markers for pancreatic cancer. In this quantitative strategy, 100 μg depleted serum proteins from each patient in the same set were labeled at protein-level using the TMT 6-plex reagent. One hundred micrograms of pooled depleted serum proteins from 30 healthy people were labeled with one channel (reporter ion: 126) of TMT 6-plex reagent and added into each set as an internal standard. LC-MS/MS analysis on an LTQ Orbitrap Velos was performed for each set in duplicate. After filtering with a 1% FDR, 90–148 glycoproteins were identified and quantified in each set according to the intensity of reporter ions. Ratios were obtained for each sample by comparing with the internal standard. In total, 354 quantified glycoproteins were obtained by combining all the data from 31 sample sets (Supporting Information Table S4). After statistical analysis, 25 proteins were considered as differentially expressed proteins (p value <0.05). Detailed information of differentially abundant proteins, including protein name, accession number and p value, is shown in Table 3. α-1-Antichymotrypsin, haptoglobin, isoform cytoplasmic of gelsolin, leucine-rich α-2-glycoprotein, l-selectin, lumican, and transthyretin were identified and quantified by both the spectral counting and protein-level TMT labeling method. The differentially expressed proteins were also analyzed by ANOVA based on disease group. All the p values between pancreatic cancers and others is less than 0.01. The 6 most significant proteins based on TMT labeling quantitation are presented in Figure 2. The p value of the 6 significant proteins is <0.001 between cancer and other controls as shown in Table 3.
Table 3. Proteins with Significantly Differential Abundance Identified by TMT Labeling Quantitative Strategy.
| accession | protein name | description | p value | mean difference | detected sample numberα |
|---|---|---|---|---|---|
| P01011 | AACT | α-1-antichymotrypsin | <0.001 | 1.15 | 158 |
| P02750 | LRG | leucine-rich α-2-glycoprotein | <0.001 | 1.23 | 158 |
| P01009 | A1AT | α-1-antitrypsin | <0.001 | 2.03 | 24 |
| P51884 | LUM | lumican | <0.001 | 1.02 | 158 |
| P19652 | A1AG2 | α-1-acid glycoprotein 2 | <0.001 | 1.37 | 158 |
| P01009-2 | A1AT | isoform 2 of α-1-antitrypsin | <0.001 | 1.70 | 120 |
| Q06033 | ITIH3 | inter-α-trypsin inhibitor heavy chain H3 | <0.001 | 1.17 | 158 |
| P06396 | AGEL | cytoplasmic of gelsolin | 0.001 | 1.02 | 153 |
| P02763 | A1AG1 | α-1-acid glycoprotein 1 | 0.002 | 1.55 | 121 |
| P05155 | C1NH | Plasma protease C1 inhibitor | 0.002 | 1.82 | 153 |
| P06727 | APOA4 | apolipoprotein A-IV | 0.003 | 1.40 | 158 |
| P03952 | KLKB1 | plasma kallikrein | 0.004 | 1.42 | 158 |
| P02748 | C9 | complement component C9 | 0.005 | 1.12 | 158 |
| P06681 | C2 | complement C2 | 0.014 | 1.13 | 153 |
| P00738 | HPT | haptoglobin | 0.015 | 2.38 | 118 |
| Q8NDM7-2 | WDR96 | isoform 2 of WD repeat-containing protein C10orf79 | 0.016 | 1.13 | 24 |
| Q9NYV6 | Q9NYV6 | RNA polymerase I-specific transcription initiation factor RRN3 | 0.021 | 1.06 | 34 |
| P14151 | LYAM1 | l-selectin | 0.021 | 1.04 | 105 |
| P07996 | TSP1 | thrombospondin-1 | 0.029 | 2.60 | 154 |
| Q14624-2 | ITIH4 | isoform 2 of inter-α-trypsin inhibitor heavy chain H4 | 0.034 | 1.20 | 158 |
| P02741 | CRP | isoform 2 of C-reactive protein | 0.038 | 2.09 | 53 |
| P02766 | TTHY | transthyretin | 0.040 | 1.12 | 153 |
| P01023 | A2MG | α-2-macroglobulin | 0.046 | 1.52 | 158 |
| P02765 | FETUA | α-2-HS-glycoprotein | 0.049 | 1.07 | 158 |
| Q96KN2 | CNDP1 | β-Ala–His dipeptidase | 0.049 | 1.06 | 158 |
Detected sample number means the proteins were identified in the number of different samples from all sets.
Figure 2.

Scatter plots of quantitative ratios from TMT labeling for the six most significant proteins in each of the studied groups: pancreatic cancer, normal, diabetes, cyst, CP, OJ. The p value of the 6 significant proteins are <0.001 between cancer and other controls.
3.5. Validation of Biomarker Candidates by ELISA and Lectin-ELISA Assay
These proteins were selected for further validation based on the following three rules: (1) These proteins were detected in more than two-thirds of total samples in TMT labeling quantitative analysis or label-free quantitative analysis. (2) The p value of these proteins is less than 0.001 or their mean difference is more than 2.0 in TMT labeling quantitative analysis or label-free quantitative analysis. (3) The availability of ELISA kit or antibody for lectin-ELISA. After being filtered by these strict criteria, the six proteins of α-1-antichymotrypsin (AACT), α-1-antitrypsin (A1AT), leucine-rich α-2 glycoprotein (LRG), lumican, thrombospondin-1 (THBS1), and haptoglobin (HPT) were selected for validation by ELISA or lectin-ELISA (Supporting Information Table S5). HPT was validated by both ELISA assay and lectin-ELISA assay. Lumican was only validated by lectin-ELISA array due to the absence of commercial ELISA kits. CA 19–9 was analyzed by ELISA for comparison with the candidates.
A total of 179 serum samples were used in the validation experiment, with detailed analytical results as presented in Table 4. All candidates showed a significant difference (p < 0.01) when distinguishing pancreatic cancer from normal. From the results, diabetes did not appear to have a significant influence on the potential pancreatic cancer biomarker candidates tested. A significant difference between cancer and cyst existed in AACT, A1AT, LRG, THBS1, and HPT (lectin-ELISA assay). THBS1 showed the best performance in distinguishing between cancer and CP when compared to other candidates. For the obstructive jaundice, only the p values of the HPT ELISA, HPT lectin-ELISA assay, and lumican lectin-ELISA assay were less than 0.05. Notably, CA 19–9 did not present a statistically significant difference. The scatter plots of AACT, A1AT, LRG, and THBS1 based on protein concentrations in different disease conditions are shown in Figure 3. When combining all other conditions and comparing to the cancer group, all of the candidates except the HPT (lectin-ELISA) showed a significant change. The p values of AACT, A1AT, and LRG are less than 0.0001.
Table 4. Validation Results of Marker Candidates by ELISA and Lectin-ELISA Assay.
| validation samples |
p value |
||||||||||||
|---|---|---|---|---|---|---|---|---|---|---|---|---|---|
| cancer | normal | diabetes | cyst | CP | OJ | cancer |
|||||||
| protein | units | mean (n = 34) | mean (n = 30) | mean (n = 30) | mean (n = 30) | mean (n = 30) | mean (n = 22) | vs normal | vs diabetes | vs cyst | vs CP | vs OJ | vs othersa |
| CA 19–9 | U/ml | 337.48 | 11.13 | 15.60 | 33.26 | 31.94 | 109.12 | <0.0001 | <0.0001 | <0.0001 | <0.0001 | ns | <0.0001 |
| AACT | μg/mL | 441.05 | 210.16 | 216.79 | 292.88 | 312.84 | 436.01 | <0.0001 | <0.0001 | <0.001 | <0.001 | ns | <0.0001 |
| A1AT | mg/mL | 2.80 | 1.48 | 1.45 | 2.14 | 2.33 | 2.67 | <0.0001 | <0.0001 | <0.001 | <0.05 | ns | <0.0001 |
| LRG | μg/mL | 34.96 | 18.34 | 18.26 | 22.64 | 27.24 | 33.72 | <0.0001 | <0.0001 | <0.01 | ns | ns | <0.0001 |
| THBS1 | μg/mL | 8.47 | 10.79 | 9.42 | 10.11 | 11.54 | 8.85 | <0.0001 | ns | <0.01 | <0.0001 | ns | <0.001 |
| HPT | mg/mL | 2.86 | 1.24 | 1.85 | 2.36 | 2.14 | 1.88 | <0.0001 | <0.01 | ns | <0.05 | <0.05 | <0.001 |
| HPT(AAL) | U/ml | 20.61 | 6.93 | 9.92 | 15.10 | 25.83 | 32.11 | <0.0001 | <0.001 | <0.05 | ns | <0.05 | ns |
| Lumican(AAL) | U/ml | 2.25 | 1.64 | 1.68 | 1.89 | 1.96 | 2.56 | <0.001 | <0.001 | ns | ns | <0.05 | <0.01 |
Others are the combination of normal, diabetes, cyst, CP, and OJ groups; ns means not significant.
Figure 3.

Serum concentration profiles of the four protein candidates (AACT, A1AT, LRG, THBS1) in each studied group: pancreatic cancer, normal, diabetes, cyst, CP, OJ based on ELISA assay.
In order to investigate the performance of individual candidate markers, AUC values were obtained by constructing an ROC curve for each candidate and CA 19–9. The results are presented in Table 5. The AUC value between cancer and normals for AACT and A1AT is greater than 0.95, which is much higher than that of CA 19–9 (AUC = 0.89). Between cancer and diabetes, AACT and A1AT have the best performance with AUC values of 0.93 and 0.95, respectively. For comparison, the AUC value for CA 19–9 is 0.85. In discriminating cancer from cyst, AACT has the best performance with an AUC value of 0.78, which is less than that of CA 19–9 (AUC = 0.81). THBS1 has the best performance in distinguishing cancer from CP (AUC = 0.83), which is higher than CA 19–9 (AUC = 0.81). Between cancer with OJ, HPT (AUC = 0.70) is better than others including CA 19–9 (AUC = 0.68). If the normal, diabetes, cyst, CP, and obstructive jaundice groups were combined as a comparison group, AACT had a comparable performance with CA 19–9 (AUC = 0.8) in distinguishing cancer from the others. Based on the validation results, AACT, A1AT, THBS1, HPT, and lumican all showed potential as pancreatic cancer markers.
Table 5. Performance of Individual Marker in Distinguishing Pancreatic Cancer from Other Individual Group or Combination with or without OJ.
| cancer (AUC) |
cancer vs controls |
cancer
vs controls (without OJ) |
|||||||||
|---|---|---|---|---|---|---|---|---|---|---|---|
| protein name | vs normal | vs diabetes | vs cyst | vs CP | vs OJ | AUC | sensitivity % | specificity % | AUC | sensitivity % | specificity % |
| CA19–9 | 0.89 | 0.85 | 0.81 | 0.79 | 0.68 | 0.81 | 90.1 | 62.9 | 0.83 | 82.5 | 77.1 |
| AACT | 0.96 | 0.93 | 0.78 | 0.74 | 0.51 | 0.80 | 68.6 | 80.0 | 0.85 | 75.6 | 80.0 |
| A1AT | 0.95 | 0.95 | 0.71 | 0.64 | 0.57 | 0.78 | 55.3 | 94.3 | 0.81 | 59.2 | 94.3 |
| THBS1 | 0.78 | 0.62 | 0.70 | 0.83 | 0.52 | 0.70 | 72.3 | 65.7 | 0.73 | 77.5 | 65.7 |
| LRG | 0.84 | 0.83 | 0.75 | 0.62 | 0.52 | 0.72 | 69.5 | 65.7 | 0.76 | 75.0 | 65.7 |
| HPT | 0.81 | 0.69 | 0.61 | 0.66 | 0.70 | 0.69 | 84.8 | 56.7 | 0.69 | 85.5 | 56.7 |
| Lumican(AAL) | 0.75 | 0.75 | 0.63 | 0.61 | 0.67 | 0.63 | 45.8 | 82.9 | 0.68 | 53.6 | 82.9 |
| HPT(AAL) | 0.87 | 0.77 | 0.65 | 0.53 | 0.67 | 0.64 | 64.5 | 62.9 | 0.69 | 72.5 | 62.9 |
3.6. Biomarker Panel Performance
Next, biomarker panel performance was investigated for diagnosing pancreatic cancer. Potential candidates were combined in various combinations of 2–4 proteins to serve as a panel. The top 10 biomarker panels for each comparison are shown in Supporting Information Table S6 along with the performance of CA 19–9 alone. Each of these optimized panels was found to outperform CA 19–9 alone. The best panel was composed of AACT, THBS1, and HPT (Figure 4). The panel revealed significantly better performance than CA 19–9 in distinguishing pancreatic cancer from normal (AUC = 0.95), diabetes (AUC = 0.89), cyst (AUC = 0.82), and CP (AUC = 0.90). The AUC value of this panel reached 0.85 in distinguishing pancreatic cancer with all other conditions. In addition, it was found that the correlation between CA 19–9 with the potential markers was very low (p value <0.001), demonstrating that this combination has high complementarity with CA 19–9. Thus, a biomarker panel combining AACT, THBS1, HPT, and CA 19–9 showed a high diagnostic potential in distinguishing pancreatic cancer from the other conditions with OJ (AUC = 0.92) or without OJ (AUC = 0.95) (Figure 4).
Figure 4.

Performance of biomarker panels based on ELISA results, the ROC curve, and AUC value of panel 1 and panel 2 were shown. Panel 1 includes AACT, THBS1, and HPT; panel 2 is the combination of AACT, THBS1, HPT, and CA 19–9.
4. Discussion
Even with recent improvements in mass spectrometry and separation methods, identifying potential biomarkers in human serum to assist with early cancer detection is a significant challenge owing to serum’s complexity and the wide dynamic range of proteins.27 Glycoproteins are becoming important targets for the development of biomarkers for disease diagnosis, prognosis, and therapeutic response to drugs. Focusing on the glycoproteome might be an alternative route in biomarker discovery.28 The findings here support the strategy of focusing on glycoprotein analysis using lectin-array assay and quantitative proteomics analysis as a powerful biomarker discovery platform.
4.1. Optimization of Serum Sample Preparation and Individual Variation in a Large Cohort for Biomarker Discovery
In this study, 179 serum samples were used to identify and validate potential markers. Fourteen high-abundance proteins were depleted using two IgY-14 LC10 columns before lectin-array and quantitative proteomics analysis. The high reproducibility and efficiency of serum high-abundance protein depletion has been demonstrated by other groups.29 To avoid quantification differences caused by variations in depletion efficiency across different samples, the percentage of IgG was monitored by measuring IgG protein concentration using an IgG ELISA kit. Initially, the percentage of IgG protein was less than 1%. The depletion experiments were stopped and a new depletion column was used when the percentage of IgG protein was more than 2%, suggesting compromised depletion performance. All of the serum samples were randomized into 35 sets with each set including four to six samples from the different disease groups. Each set was depleted in the same day so that all the samples had comparable depletion efficiencies.
4.2. TMT Protein-level Labeling and Label-free Quantitative Methods
To date, peptide-level labeling using isobaric tag reagents has been widely applied for serum biomarker discovery.30,31 However, several sample preparation steps, including glycoprotein enrichment, digestion, and labeling, are completed in parallel until mixing with each step adding to the overall method variance and sample preparation time. To minimize the influence of inconsistency during sample preparation, a quantitative proteomics method using isobaric labeling of intact proteins was developed.21 Because the samples were mixed prior to glycoprotein enrichment and digestion, variability from these steps is eliminated. Furthermore, the time required for protein level sample preparation steps (e.g., glycoprotein enrichment/buffer exchange) was reduced by up to the multiplexing factor of the isobaric reagent used. The results showed that isobaric protein-level labeling gave comparable identification levels and quantitative precision to peptide-level labeling by combining the results of Asp–N and trypsin digestions. In this study, 31 sets of samples were labeled on protein-level using the TMT reagent. A total of 354 glycoproteins were quantified with more than 80% of the identified proteins quantified. The variability of quantification was less than 15%. An internal standard was used to avoid normalizing to different samples across sets, which is essential for data analysis in large-scale serum sample analysis.
A label-free quantitative strategy using spectral counting was also used to quantify glycoproteins in different groups after AAL lectin enrichment. Although spectral counting quantification is a semiquantitative method, it has been shown to be a useful method.32 In this study, 243 glycoproteins were quantified after strict filtering. One hundred thirty seven glycoproteins (30%) were quantified in both methods together. There were 106 proteins quantified only in the label-free method. The overlapped data from both methods are shown in Supporting Information Figure S2. Seven significant proteins were quantified by both methods. These significant changes were further validated by ELISA and lectin-ELISA.
4.3. Influence of Related Disease on Biomarkers
Sialylated Lewis antigen CA 19–9 is a well-known molecular marker in pancreatic cancer. It has a reported sensitivity between 70 and 80% and specificity between 70 and 90%, respectively, for pancreatic cancer detection.6 However, the major drawback is that it can also be positive in several benign conditions, such as diabetes, chronic pancreatitis, and jaundice.33 The relationship between diabetes and pancreatic cancer is complex. Diabetes or impaired glucose tolerance is present in more than two-thirds of pancreatic cancer patients. Epidemiological studies have also consistently shown a modest but significant increase in the risk for pancreatic cancer in type 2 diabetes, with an inverse relationship to duration of disease. Subjects >50 years of age with new onset diabetes are at higher risk of having pancreatic cancer.34 Our analysis revealed that CA 19–9 is not sufficient to distinguish pancreatic cancer and type 2 diabetes (Table 5). However, type 2 diabetes was not found to influence the potential biomarkers AACT and A1AT identified in this study. Cyst and CP influenced the performance of all individual biomarkers, including CA 19–9. However, it was feasible to distinguish pancreatic cancer from cyst or CP for the biomarker panel combining AACT, THBS1, HTP, and CA 19–9. Because there is a low correlation between these individual markers, the performance should be increased significantly by combining them. In particular, the presence of jaundice was found to negatively impact the performance of biomarkers for pancreatic cancer diagnosis and this has implications for clinical translation of biomarkers.35 We found very few studies that included samples with patients presenting with obstructive jaundice. Our results showed no one individual marker, including CA 19–9, could efficiently distinguish pancreatic cancer from obstructive jaundice. As shown in Figure 4, the AUC value of the biomarker panel increased if the comparison was made between pancreatic cancer and the other conditions in the absence of obstructive jaundice. In addition, PC is more common in men than women and is predominantly a disease of elderly people.36 Aged-matched controls are also very important to discover potential markers.
A promising glycoprotein biomarker panel was found by combining lectin-array assay and serum quantitative proteomic analysis for early detection of pancreatic cancer. This is very relevant because there is a desperate need to obtain new blood-based markers to overcome the limitations of CA 19–9.6,37 Improvement in performance of biomarkers to detect pancreatic cancer early would be expected to influence outcome.
This study has several strengths including age-matched controls, a prospective collection of patients with no systematic bias for one or more disease group, and representative disease groups. However, the pancreatic cancer patients are predominantly advanced stage. This may limit our ability to find markers of early stage disease. The study population is predominantly white, which prevents us from knowing if these markers would be the same in other racial and ethnic groups. Finally, the different assays were all performed on the same set of samples. Thus, we have a risk of overfitting. We took several steps to minimize the effect of overfitting. First, the multimarker prediction rules that we used are not optimized regression fits. Instead, we simply linearly combined the markers with weights proportional to their marginal correlation coefficient with the outcome. Second, all performance metrics (sensitivity, specificity, AUC, etc.) are calculated using cross validation. Eventually, our results need to be validated in a larger, new set of samples, ideally in a blind manner.
The ultimate clinical goal of our work is to discover and validate biomarkers for pancreatic cancer. The ideal performance of the biomarker needed for clinical utility will be dependent on the target population prevalence of pancreatic cancer and the next step for a patient with a positive biomarker test. The prevalence of pancreatic cancer among the general population over age 50 years is so low that any screening biomarker will need perfect accuracy, which is not feasible. Among populations with first-degree relatives with pancreatic cancer, p16 germline mutations, mismatch repair gene mutations, hereditary pancreatitis, or other genetic mutations, the prevalence increases dramatically.38,39 The higher the prevalence, the less accurate the biomarker needs to be. If the next step for a biomarker-positive patient is not an invasive or risky procedure such as pancreatic dedicated computer tomography, then the accuracy need not be as high. However, if the next step is an invasive test such as upper endoscopy with ultrasound and fine needle aspiration of the pancreas, then the accuracy needs to be as high as possible. The clinical utility of our biomarker will depend on the ability to detect early pancreatic lesions.
5. Conclusions
Rigorous design and reliable quantitative strategies were applied to large-scale serum glycoprotein biomarker discovery for pancreatic cancer. It was found that focusing on serum glycoproteins was a reliable and powerful method for biomarker discovery. Seven significant glycoproteins were quantified by both spectral counting and TMT protein-level labeling methods. Our validation data produced a promising glycoprotein biomarker panel that was identified in this study. The performance of this biomarker panel warrants further investigation for its screening, diagnostic, or prognostic potential. We highly recommend other researchers focused on pancreatic cancer biomarkers use age-matched control groups and include disease groups similar to this study. Without such an approach, the value of potential markers identified may be quite limited.
Acknowledgments
We acknowledge support by the National Cancer Institute through SPORE Program Grant 1 P50CA130810 (S.N., D.M.L., M.T.R.), Grants 1 R01 CA154455 (D.M.L) and R01 GM49500 (D.M.L), and NIDDK Grant K23 DK082097 (M.A.A).
Glossary
Abbreviations
- AAL
Aleuria aurantia lectin
- CA 19–9
carbohydrate specific antigen 19–9
- ROC
receiver operating characteristic
- AUC
area under curve
- SN
sensitivity
- SP
specificity
- Cyst
cystic neoplasms of the pancreas
- IPMN
intraductal papillary mucinous neoplasm
- MCN
mucinous cystic neoplasm
- CP
chronic pancreatitis
- OJ
obstructive jaundice
- PC
pancreatic cancer
- AACT
α-1-antichymotrypsin
- A1AT
α-1-antitrypsin
- THBS1
thrombospondin-1
- HPT
haptoglobin
- LRG
leucine-rich α-2 glycoprotein
- HCD
higher-energy collisional dissociation
- TMT
tandem mass tags
Supporting Information Available
The randomization information of all samples (Supplementary Table S1), carbohydrate specificities of the 16 lectins used for lectin microarray (Supplementary Table S2), protein list identified and quantified by label-free method (Supplementary Table S3), protein list identified and quantified by TMT protein-level labeling method (Supplementary Table S4), the proteins selected for further validation based on three strict criteria (Supplementary Table S5), the performance of top 10 biomarker panels (Supplementary Table S6), experimental reproducibility of lectin array and overall glycosylation levels detected by lectin array (Supplementary Figure S1) and the overlapped data from label-free and TMT labeling method (Supplementary Figure S2).This material is available free of charge via the Internet at http://pubs.acs.org.
The authors declare no competing financial interest.
Funding Statement
National Institutes of Health, United States
Supplementary Material
References
- Jemal A.; Siegel R.; Ward E.; Hao Y.; Xu J.; Thun M. J. Cancer statistics, 2009. Ca–Cancer J. Clin. 2009, 594225–49. [DOI] [PubMed] [Google Scholar]
- Chu D.; Kohlmann W.; Adler D. G. Identification and screening of individuals at increased risk for pancreatic cancer with emphasis on known environmental and genetic factors and hereditary syndromes. JOP 2010, 113203–12. [PubMed] [Google Scholar]
- Abraham P.; Giannone R. J.; Adams R. M.; Kalluri U.; Tuskan G. A.; Hettich R. L. Putting the Pieces Together: High-performance LC-MS/MS Provides Network-, Pathway-, and Protein-level Perspectives in Populus. Mol. Cell. Proteomics 2012, 121106–19. [DOI] [PMC free article] [PubMed] [Google Scholar]
- Sohn T. A.; Lillemoe K. D.; Cameron J. L.; Huang J. J.; Pitt H. A.; Yeo C. J. Surgical palliation of unresectable periampullary adenocarcinoma in the 1990s. J. Am. Coll. Surg. 1999, 1886658–66discussion 666–9.. [DOI] [PubMed] [Google Scholar]
- Singh P.; Srinivasan R.; Wig J. D. Major molecular markers in pancreatic ductal adenocarcinoma and their roles in screening, diagnosis, prognosis, and treatment. Pancreas 2011, 405644–52. [DOI] [PubMed] [Google Scholar]
- Pleskow D. K.; Berger H. J.; Gyves J.; Allen E.; McLean A.; Podolsky D. K. Evaluation of a serologic marker, CA19–9, in the diagnosis of pancreatic cancer. Ann. Intern. Med. 1989, 1109704–9. [DOI] [PubMed] [Google Scholar]
- Partyka K.; Maupin K. A.; Brand R. E.; Haab B. B. Diverse monoclonal antibodies against the CA 19–9 antigen show variation in binding specificity with consequences for clinical interpretation. Proteomics 2012, 12132212–20. [DOI] [PMC free article] [PubMed] [Google Scholar]
- Wehr A. Y.; Hwang W. T.; Blair I. A.; Yu K. H. Relative quantification of serum proteins from pancreatic ductal adenocarcinoma patients by stable isotope dilution liquid chromatography-mass spectrometry. J. Proteome Res. 2012, 1131749–58. [DOI] [PMC free article] [PubMed] [Google Scholar]
- Faca V. M.; Song K. S.; Wang H.; Zhang Q.; Krasnoselsky A. L.; Newcomb L. F.; Plentz R. R.; Gurumurthy S.; Redston M. S.; Pitteri S. J.; Pereira-Faca S. R.; Ireton R. C.; Katayama H.; Glukhova V.; Phanstiel D.; Brenner D. E.; Anderson M. A.; Misek D.; Scholler N.; Urban N. D.; Barnett M. J.; Edelstein C.; Goodman G. E.; Thornquist M. D.; McIntosh M. W.; DePinho R. A.; Bardeesy N.; Hanash S. M. A mouse to human search for plasma proteome changes associated with pancreatic tumor development. PLoS Med. 2008, 56e123. [DOI] [PMC free article] [PubMed] [Google Scholar]
- Pan S.; Chen R.; Crispin D. A.; May D.; Stevens T.; McIntosh M. W.; Bronner M. P.; Ziogas A.; Anton-Culver H.; Brentnall T. A. Protein alterations associated with pancreatic cancer and chronic pancreatitis found in human plasma using global quantitative proteomics profiling. J. Proteome Res. 2011, 1052359–76. [DOI] [PMC free article] [PubMed] [Google Scholar]
- Bunger S.; Laubert T.; Roblick U. J.; Habermann J. K. Serum biomarkers for improved diagnostic of pancreatic cancer: a current overview. J. Cancer Res. Clin. Oncol. 2011, 1373375–389. [DOI] [PMC free article] [PubMed] [Google Scholar]
- Wingren C.; Sandstrom A.; Segersvard R.; Carlsson A.; Andersson R.; Lohr M.; Borrebaeck C. A. Identification of serum biomarker signatures associated with pancreatic cancer. Cancer Res. 2012, 72102481–90. [DOI] [PubMed] [Google Scholar]
- Schiess R.; Wollscheid B.; Aebersold R. Targeted proteomic strategy for clinical biomarker discovery. Mol. Oncol. 2009, 3133–44. [DOI] [PMC free article] [PubMed] [Google Scholar]
- Drake P. M.; Cho W.; Li B.; Prakobphol A.; Johansen E.; Anderson N. L.; Regnier F. E.; Gibson B. W.; Fisher S. J. Sweetening the pot: adding glycosylation to the biomarker discovery equation. Clin. Chem. 2010, 562223–36. [DOI] [PMC free article] [PubMed] [Google Scholar]
- Liu Y.; He J.; Li C.; Benitez R.; Fu S.; Marrero J.; Lubman D. M. Identification and confirmation of biomarkers using an integrated platform for quantitative analysis of glycoproteins and their glycosylations. J. Proteome Res. 2010, 92798–805. [DOI] [PMC free article] [PubMed] [Google Scholar]
- Wu J.; Xie X.; Liu Y.; He J.; Benitez R.; Buckanovich R. J.; Lubman D. M. Identification and confirmation of differentially expressed fucosylated glycoproteins in the serum of ovarian cancer patients using a lectin array and LC-MS/MS. J. Proteome Res. 2012, 1194541–52. [DOI] [PubMed] [Google Scholar]
- Kaur S.; Baine M. J.; Jain M.; Sasson A. R.; Batra S. K. Early diagnosis of pancreatic cancer: challenges and new developments. Biomarkers Med. 2012, 65597–612. [DOI] [PMC free article] [PubMed] [Google Scholar]
- McKay C. J.; Glen P.; McMillan D. C. Chronic inflammation and pancreatic cancer. Best Pract. Res., Clin. Gastroenterol. 2008, 22165–73. [DOI] [PubMed] [Google Scholar]
- Ben Q.; Xu M.; Ning X.; Liu J.; Hong S.; Huang W.; Zhang H.; Li Z. Diabetes mellitus and risk of pancreatic cancer: A meta-analysis of cohort studies. Eur. J. Cancer 2011, 47131928–37. [DOI] [PubMed] [Google Scholar]
- Sener S. F.; Fremgen A.; Menck H. R.; Winchester D. P. Pancreatic cancer: a report of treatment and survival trends for 100,313 patients diagnosed from 1985–1995, using the National Cancer Database. J. Am. Coll. Surg. 1999, 18911–7. [DOI] [PubMed] [Google Scholar]
- Nie S.; Lo A.; Zhu J.; Wu J.; Ruffin M. T.; Lubman D. M. Isobaric protein-level labeling strategy for serum glycoprotein quantification analysis by liquid chromatography-tandem mass spectrometry. Anal. Chem. 2013, 85115353–7. [DOI] [PMC free article] [PubMed] [Google Scholar]
- He J.; Liu Y.; Xie X.; Zhu T.; Soules M.; DiMeco F.; Vescovi A. L.; Fan X.; Lubman D. M. Identification of cell surface glycoprotein markers for glioblastoma-derived stem-like cells using a lectin microarray and LC-MS/MS approach. J. Proteome Res. 2010, 952565–72. [DOI] [PMC free article] [PubMed] [Google Scholar]
- Zhu J.; He J.; Liu Y.; Simeone D. M.; Lubman D. M. Identification of glycoprotein markers for pancreatic cancer CD24+CD44+ stem-like cells using nano-LC-MS/MS and tissue microarray. J. Proteome Res. 2012, 1142272–81. [DOI] [PMC free article] [PubMed] [Google Scholar]
- Lin Z.; Simeone D. M.; Anderson M. A.; Brand R. E.; Xie X.; Shedden K. A.; Ruffin M. T.; Lubman D. M. Mass spectrometric assay for analysis of haptoglobin fucosylation in pancreatic cancer. J. Proteome Res. 2011, 1052602–11. [DOI] [PMC free article] [PubMed] [Google Scholar]
- Comunale M. A.; Lowman M.; Long R. E.; Krakover J.; Philip R.; Seeholzer S.; Evans A. A.; Hann H. W.; Block T. M.; Mehta A. S. Proteomic analysis of serum associated fucosylated glycoproteins in the development of primary hepatocellular carcinoma. J. Proteome Res. 2006, 52308–15. [DOI] [PubMed] [Google Scholar]
- Matsumoto H.; Shinzaki S.; Narisada M.; Kawamoto S.; Kuwamoto K.; Moriwaki K.; Kanke F.; Satomura S.; Kumada T.; Miyoshi E. Clinical application of a lectin-antibody ELISA to measure fucosylated haptoglobin in sera of patients with pancreatic cancer. Clin. Chem. Lab. Med. 2010, 484505–12. [DOI] [PubMed] [Google Scholar]
- Fanayan S.; Hincapie M.; Hancock W. S. Using lectins to harvest the plasma/serum glycoproteome. Electrophoresis 2012, 33121746–54. [DOI] [PubMed] [Google Scholar]
- Pan S.; Chen R.; Aebersold R.; Brentnall T. A. Mass spectrometry based glycoproteomics--from a proteomics perspective. Mol. Cell. Proteomics 2011, 101R110 003251. [DOI] [PMC free article] [PubMed] [Google Scholar]
- Tu C.; Rudnick P. A.; Martinez M. Y.; Cheek K. L.; Stein S. E.; Slebos R. J.; Liebler D. C. Depletion of abundant plasma proteins and limitations of plasma proteomics. J. Proteome Res. 2010, 9104982–91. [DOI] [PMC free article] [PubMed] [Google Scholar]
- Ueda K.; Takami S.; Saichi N.; Daigo Y.; Ishikawa N.; Kohno N.; Katsumata M.; Yamane A.; Ota M.; Sato T. A.; Nakamura Y.; Nakagawa H. Development of serum glycoproteomic profiling technique; simultaneous identification of glycosylation sites and site-specific quantification of glycan structure changes. Mol. Cell. Proteomics 2010, 991819–28. [DOI] [PMC free article] [PubMed] [Google Scholar]
- Zhang X.; Yin X.; Yu H.; Liu X.; Yang F.; Yao J.; Jin H.; Yang P. Quantitative proteomic analysis of serum proteins in patients with Parkinson’s disease using an isobaric tag for relative and absolute quantification labeling, two-dimensional liquid chromatography, and tandem mass spectrometry. Analyst 2012, 1372490–5. [DOI] [PubMed] [Google Scholar]
- Collier T. S.; Randall S. M.; Sarkar P.; Rao B. M.; Dean R. A.; Muddiman D. C. Comparison of stable-isotope labeling with amino acids in cell culture and spectral counting for relative quantification of protein expression. Rapid Commun. Mass Spectrom. 2011, 25172524–32. [DOI] [PubMed] [Google Scholar]
- Buxbaum J. L.; Eloubeidi M. A. Molecular and clinical markers of pancreas cancer. JOP 2010, 116536–44. [PubMed] [Google Scholar]
- Muniraj T.; Chari S. T. Diabetes and pancreatic cancer. Minerva Dietol. Gastroenterol. 2012, 584331–45. [PMC free article] [PubMed] [Google Scholar]
- Tonack S.; Jenkinson C.; Cox T.; Elliott V.; Jenkins R. E.; Kitteringham N. R.; Greenhalf W.; Shaw V.; Michalski C. W.; Friess H.; Neoptolemos J. P.; Costello E. iTRAQ reveals candidate pancreatic cancer serum biomarkers: influence of obstructive jaundice on their performance. Br. J. Cancer 2013, 10891846–53. [DOI] [PMC free article] [PubMed] [Google Scholar]
- Lakatos G.; Tulassay Z. [The epidemiology of pancreatic cancer]. Orv Hetil 2010, 151441816–22. [DOI] [PubMed] [Google Scholar]
- Wasan H. S.; Springett G. M.; Chodkiewicz C.; Wong R.; Maurel J.; Barone C.; Rosbrook B.; Ricart A. D.; Kim S.; Spano J. P. CA 19–9 as a biomarker in advanced pancreatic cancer patients randomised to gemcitabine plus axitinib or gemcitabine alone. Br. J. Cancer 2009, 10171162–1167. [DOI] [PMC free article] [PubMed] [Google Scholar]
- Goh K. L.; Yoon B. K. Early detection of pancreatic cancer: a possibility in some cases but not a reality in most. J. Dig. Dis. 2012, 138389–92. [DOI] [PubMed] [Google Scholar]
- Brentnall T. A. Pancreatic cancer surveillance: learning as we go. Am. J. Gastroenterol. 2011, 1065955–6. [DOI] [PubMed] [Google Scholar]
Associated Data
This section collects any data citations, data availability statements, or supplementary materials included in this article.