

Abstract
Performing a comprehensive nonbiased proteome analysis is an extraordinary challenge due to sample complexity and wide dynamic range, especially in eukaryotic tissues. Thus, prefractionation steps conducted prior to mass spectrometric analysis are critically important to reduce complex biological matrices and allow in-depth analysis. Here we demonstrated the use of OFFGel prefractionation to identify more low abundant and hydrophobic proteins than in a nonfractionated sample. Moreover, OFFGel prefractionation of a kidney protein sample was able to unveil protein functional relevance by detecting PTMs, especially when prefractionation was augmented with a targeted enrichment strategy such as TiO2 phospho-enrichment. The OFFGel-TiO2 combination used in this study was comparable to other global phosphoproteomics approaches (SCX-TiO2, ERLIC-TiO2, or HILIC-TiO2). The detailed mouse kidney proteome with the phosphopeptide enrichment presented here serves as a useful platform for a better understanding of how the renal protein modification machinery works and, ultimately, will contribute to our understanding of pathological processes as well as normal physiological renal functions.
Keywords: OFFGel, kidney, proteomics, fractionation, phospho-enrichment
1. Introduction
Protein post-translational modifications (PTMs) control the activity and function of proteins, which in turn regulate a diverse set of biological processes and cell signaling mechanisms.1,2 Modern analytical tools such as mass spectrometry have made the detection of these chemical modifications possible through the accurate measurement of protein mass increases or loss and have allowed large scale, comprehensive PTM screening in order to gain deeper insight in the study of cell biology, as well as disease treatment and prevention.
So far, there are more than 300 known protein modifications,3 most notably phosphorylation, glycosylation, ubiquitination, methylation, and acetylation. These modifications covalently bind in a transient manner to a small fraction of proteins, estimated to be less than 1% of total cellular proteins.3−5 Therefore, detection of the presence of modified peptides in a substoichiometric ratio requires a high-resolution, sensitive, and accurate mass spectrometer.3
In many cases, peptide mass measurements are insufficient to determine the peptide modification. However, when these modified peptides are fragmented in a tandem mass spectrometer, detection of mass increments of representing modified amino acids is possible.3,6
PTMs participate in diverse cellular processes and signaling pathways in the kidney.7−12 Recent studies showed potential protein modification in the slit diaphragm, podocyte activities, ganglioside, and focal adhesion of the foot processes.8−11,13 These findings highlight the pivotal role of modified proteins not only in glomerular ultrafiltration function but also in the renal homeostatic regulatory process.
In order to obtain a comprehensive view of the mouse kidney proteome as well as possible modifications that might exist in the sample, the complex protein lysate from mouse kidneys was prefractionated based on isoelectric focusing using the 3100 OFFGel fractionator and subjected to analysis using 3 different ultra-high throughput liquid chromatography tandem mass spectrometers (LC–MS/MS). The OFFGel-based proteome data set generated in this study provides a deep, unbiased, normal kidney proteome analysis, encompassing PTMs (including phosphopeptides), that is valuable for a better understanding of protein-associated renal physiological processes.
2. Material and Methods
2.1. Animals
Male 8-week old C57BL/6J mice were used in this study, which was approved by the animal committee at Niigata University School of Medicine.
2.2. Preparation of Kidney Protein Lysate
The renal capsule was removed, and the right kidney was quickly rinsed with cold PBS supplied with protease and phosphatase inhibitor cocktail (Roche, Mannheim, Germany) to remove blood and inhibit protease activity. Protein extracts were obtained by placing dissected kidney tissues in the protein OFFGel prefractionation buffer supplied by the manufacturer [containing urea, thiourea, DTT, glycerol, and buffer with ampholytes pH (3–10)]. Complete ultra proteoases and phoSTOP (Roche) were added to the buffer. A Precellys 24 tissue homogenizer was used for protein extraction by adding 2.8 ceramic beads (zirconium oxide) to tubes and homogenizing at 6500 rpm at 4 °C for 20 s. (Precellys, Bertin Technologies).
2.3. OFFGel Prefractionation of Kidney Protein Lysate
Isoelectric point-based OFFGel prefractionation for protein extracts was carried out in 3 technical replicates as specified by the manufacturer. Briefly, 2 mg of renal protein extracts were used for OFFGel prefractionation using 3100 OFFGel fractionator (Agilent Technologies, Japan).14 Proteins were separated using IPG strips (pH 3–10, 13 cm, Agilent Technologies, Japan) focused for 20 kV h with a maximum current of 50 μA and maximum voltage set to 4500 V. Samples were shifted to hold step at a voltage (500 V), and current of 20 μA was sustained for 40 h. During the focusing, oil was added to the electrodes to prevent evaporation. After successful fractionation, 12 liquid fractions were recovered, and only the first 3 sequential wells were pooled (low protein yield) prior to in-solution digestion or filter-aided sample preparation (FASP).15
2.4. In-Solution Trypsin Digestion
Recovered fractionated proteins were precipitated with acetone and assayed using the BCA method (Pierce, Rockford, IL). Acetone-precipitated proteins (∼50 μg) were denatured in 8 M urea, 500 mM Tris-HCl, pH 8.5, with protease and phosphatase inhibitor cocktails (Roche, Mannheim) followed by reduction with 5 mM tris(2-carboxyethyl)phosphine (TCEP) for 30 min to confirm fully reduced protein sample before digestion. Cysteine residues were alkylated with 10 mM iodoacetamide for 20 min in the dark. To maintain trypsin activity, samples were diluted to a final concentration of 2 M urea in 100 mM Tris-HCl, pH 8.5, prior to digestion with trypsin. For endopeptidase digestion, modified trypsin (Promega, Madison, WI) was added at 50:1 (protein:protease mass ratio) along with 1 mM CaCl2 and incubated overnight in a thermo-shaker at 600 rpm at 37 °C. Digested peptide solution was acidified using 90% formic acid to a final pH of 3 and enriched using a stage tip.16
2.5. Filter-Aided Sample Preparation (FASP)
Aliquots of fractionated proteins corresponding to 200 μg were suspended in 8 M urea, 0.5 M Tris-HCl, pH 8.5, 5 mM TCEP, protease and phosphatase inhibitors, incubated for 30 min and spun in Vivacon 500 device (Sartorius Stedim biotech) supplied with a hydrosart nitrate filter membrane with a molecular weight cutoff (MWCO) value of 10 KDa (FASP reactor) at 14000g (4 °C). Subsequently, the reduced protein sample on the FASP reactor was alkylated by addition of 2.2 μL of 0.5 M iodoacetamide in the dark. After brief centrifugation, the concentrate was diluted twice with 100 μL of 2 M urea in 0.1 M Tris-HCl, pH 8.0, and washed again. The resulting protein concentrate on the FASP reactor was subjected to on-membrane endoprotease digestion by addition of Lys-C (protein:protease mass ratio, 25:1). The device was incubated in a wet chamber overnight. The use of Lys-C prior to trypsin digestion compensates for the trypsin inefficiency at lysine sites and improves digestion by eliminating the majority of missed cleavage. Trypsin solution was added at a ratio (75:1, protein:protease mass ratio) with 100 mM CaCl2 and incubated for an additional 6 h. Recovery of peptides was achieved by centrifugation of the reactor in a new collection tube at 14000g for 30 min followed by washing the reactor with 0.1 M Tris-HCl, pH 8.0. Proteolytic activity was inhibited by acidifying the peptide mixture to pH 3 using 90% formic acid.15
2.6. Phosphopeptide Enrichment and Cleanup
Peptide fractions purified from the OFFGel- FASP sample were enriched using titanium dioxide (TiO2) phosphopeptide enrichment and Clean-up Kit (Pierce) following the manufacturer protocol with some modifications.17 Briefly, spin tips were conditioned with 30 μL of buffer A then B. Peptide fractions were resuspended in 120 μL of buffer B, applied to the column, and centrifuged at 1000g for 10 min (repeated twice to ensure maximum binding). Following phosphopeptide binding, the column was washed with 30 μL of buffer A then buffer B and centrifuged at 3000g for 5 min. For the elution step, 75 μL of elution buffers A and B were each used to recover the phosphopeptides at 1000g for 5 min. Eluted fractions were acidified with ∼70 μL of 2.5% (v/v) TFA to a final pH 3.0. Finally, desalting and cleanup of the recovered phophopeptides was done using stage tip before MS analysis.18
2.7. Nano-LC–MS/MS analysis
Analysis of purified peptides was performed using 3 different mass spectrometers (Agilent 6320 ion trap XCT, Thermo Q- Exactive and LTQ Orbitrap Velos). Chromatographic separation was performed using a binary gradient with mobile phase either methanol or acetonitrile16 prior to introduction into the mass spectrometer where dynamic exclusion settings used were as follows: repeat count, 1; repeat duration, 30 s; exclusion list size, 450; and exclusion duration 60 s. All raw data (Thermo.RAW or Agilent.D) are available in the Peptide Atlas repository at ftp://PASS00311:YJ9542ry@ftp.peptideatlas.org/. Further LC–mass settings can be found in Table (1).
Table 1. Liquid Chromatography and Mass Spectrometric Setting for Instruments Used in the Current Study.
| mass spectrometry instrument | Agilent 6320 ion trap XCT | Thermo Q Exactive | LTQ Orbitrap Velos |
|---|---|---|---|
| HPLC | Agilent 1100 | Easy-nLC II | Easy-nLC II |
| analytical column | Zorbax 300SB-C18 3.5 μm, 150 mm × 0.075 mm | 12 cm homemade C18 250 μm Ø packed with Aqua 3 μm C18 125 Å (Phenomenex, CA) | 12 cm homemade C18 250 μm Ø packed with Aqua 3 μm C18 125 Å (Phenomenex, CA) |
| mobile phase | A: 2% CH3OH, 98% | A: 2% C3H6O, 98% | A: 2% C3H6O, 98% |
| H2O, 0.1% HCOOH | H2O, 0.1% HCOOH | H2O, 0.1% HCOOH | |
| B: 98% CH3OH, 2% | B: 98% C3H6O, 2% | B: 98% C3H6O, 2% | |
| H2O, 0.1% FA | H2O, 0.1% HCOOH | H2O, 0.1% HCOOH | |
| gradient time | 120 min | 210 min | 210 min |
| flow rate | 300 nL/min | 250 nL/min | 250 nL/min |
| peptide injection | 1 μg | 1 μg | 1 μg |
| mass analysis | Quadrupolar Ion trap (MS) | Orbitrap (MS) | Orbitrap (MS) and LTQ (MS/MS) |
| mass resolution [precursor ion-product ion] | 26.000–14.000 | 70.000–17.000 | 60.000–17.000 |
| mass range (m/z) | 200–1800 | 400–1600 | 300–2000 |
| mass window (m/z) | 3.0 | 2.0 | 2.0 |
| relative collision energy | 25% | 25% | 35% |
| excluded charge | unassigned and +1 | unassigned and +1 | unassigned and +1 |
| fragmentation technique | CID | HCD | CID |
| DDAa | top 3 | top 10 | top 12 |
DDA = Data-dependent acquisition.
2.8. Data Analysis
Protein and peptide identifications were made using the Agilent Spectrum Mill workbench (for Agilent data, http://spectrummill.edu/, version 03.03.084), or the Integrated Proteomics Pipeline, IP2 (for Thermo data, http://integratedproteomics.com/, version 1.01). Peak lists were generated from raw data using Spectrum Mill (Agilent) or RawExtract (version 1.9.9).19 Tandem mass spectra were searched against updated UniProtKB/TrEMBL (101.614 protein sequence) and IPI (119.961 protein sequence) mouse database concatenated with reversed sequences. The spectral search space included all fully and half tryptic peptide candidates within a 50 ppm window, surrounding the peptide candidate precursor mass. Carbamidomethylation (+57.02146) of cysteine was considered a static modification, and 4 PTMs were selected as variable modification: phosphorylation at S, T, and Y (+79.966), acetylation at K (+42.0106), ubiquitination at K (+114.04), or oxidation at M (+15.995). Peptide candidates were filtered to 0.1% FDR and protein candidates to 1% FDR using DTASelect19. Chromatographic peak areas and protein physicochemical properties were calculated using IP2. Phosphomotifs were analyzed by the De Novo Motif Finder of the PHOSIDA Mus musculus database using a minimum score of 15 and a minimum proportion of matching sites of 5%.20 GO annotation was illustrated using GOrilla;21 further GO settings can be found in Supplement 2b of the Supporting Information.
2.9. Two Dimensional Electrophoresis and Immunoblotting
Two dimensional gel electrophoresis was conducted on 7 cm polyacrylamide gel with settings described earlier, with some modifications.8,22,23 Briefly, a protein sample was separated on 12.5% SDS–PAGE gel, transferred onto a PVDF membrane, and incubated with 1:2000 diluted monoclonal antiphosphotyrosine antibody P-Tyr-100 (Cell Signaling, Danvers, MA) overnight at 4 °C, followed by the mouse IgG secondary antibody (dilution 1:1000). Immunoreactive proteins were visualized by an enhanced chemiluminescence detection system (ECL Plus, GE Healthcare, Chalfont, St. Giles, U.K.).
2.10. Statistical Analysis
Statistical analysis was performed using the two-sided student t test. P < 0.05 was considered a statistically significant threshold. Normalized spectral abundance factor, protein, peptide expression alteration (fold changes), log values, and confidence were calculated based on spectral peak intensities generated from the mass spectrometric analysis after extracting confident protein spectra with P < 0.01. Graph pad prism 5 and Microsoft spreadsheet formulas were used in statistical evaluation.
3. Results and Discussion
A major challenge in proteomics is the identification of low abundant proteins in highly complex samples with a wide dynamic range. The ubiquitous presence of tryptic peptides generated from abundant proteins results in oversampling of these peptides at the expense of less abundant ones. Here, we have shown that using OFFGel prefractionation of kidney proteins simplifies the complexity of protein mixtures, which improves the identification of low abundant proteins. OFFGel prefractionation was also compatible with other enrichment strategies to detect PTMs within a sample.
3.1. OFFGel Prefractionation Provides a Practical Approach for Reducing Sample Complexity in Tissues
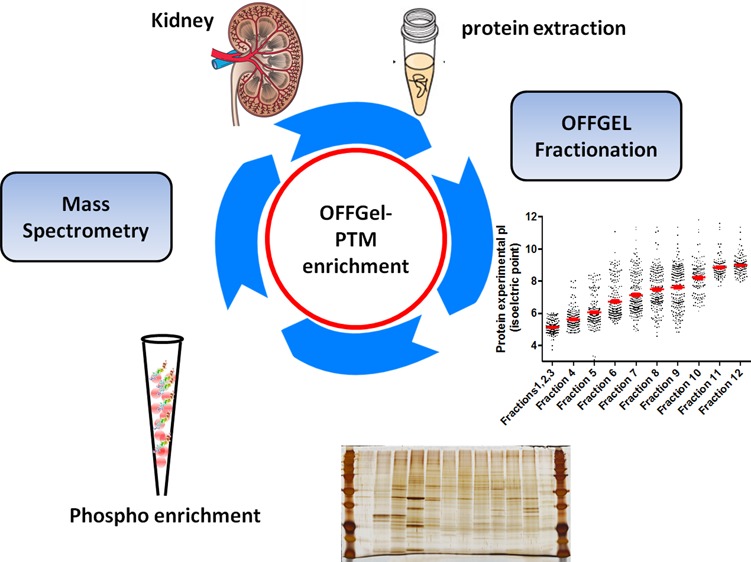
In the current study, we tested the efficiency of reducing sample complexity using OFFGel prefractionation of intact proteins derived from tissues, and its impact on proteome and PTMs identification with or without further enrichment of PTMs. The experimental platform is shown in Figure 1. Protein extract from whole mouse kidney tissue showed high similarity to our standard normal human kidney lysate (Figure 2A) when extracted using a urea-based buffer and fractionated by SDS-PAGE, demonstrating efficient protein extraction. The protein lysate was fractionated in a multiwell device by an isoelectric point (pI) and recovered in solution for subsequent analysis. As illustrated in Figure 2B, the 12 recovered fractions showed different separation patterns when visualized on a silver-stained gel. Such observation denotes efficient fractionation and successful reduction in sample complexity based on the orthogonal properties of isoelectric point and molecular weight. Recently, OFFGel-based prefractionation has been used with label-free platforms,24−26 isobaric labeling,27,28 lab-on-chip,29 and two-dimensional (2D) gel electrophoresis30 due to the ease of recovery of the fractionated mixture. Whether it is preferable to fractionate at the protein or peptide level is still an important question, especially for tissue samples.
Figure 1.

Experimental workflow for generating comprehensive mouse kidney proteome with possible post-translational modification (PTMs). OFFGel prefractionation was used to reduce sample complexity. Fractionated proteins were subjected to either in-solution digestion or FASP before nano LC–MS/MS analysis. Proteomes generated from 4 different paths were used for evaluation: P1, proteome analysis of nonfractionated, nonphospho- enriched sample; P2, fractionated, nonphospho-enriched sample; P3, fractionated, phospho-enrichment sample, and P4, nonfractionated, phosphoenriched sample.
Figure 2.
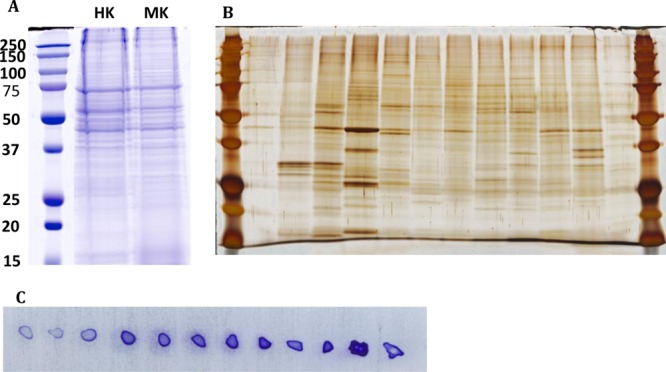
Protein extraction and prefractionation of mouse kidney. (A) Commassiee blue stained SDS-PAGE of mouse kidney lysate (MK) was compared to a human standard kidney lysate (HK), precision plus protein prestained standard was used (BioRad, Japan). (B) Silver-stained SDS-PAGE representing 12 OFFGel fractions. (C) After volume adjustment, 1 μL from each fraction was plotted on the PVDF membrane and stained with Commassiee blue stained.
3.2. Protein Purification Based on OFFGel Fractionation Showed High Recovery with Distinct Physicochemical Properties
The kidney protein lysate was assayed before and after OFFGel fractionation to verify the efficiency of protein extraction (before fractionation) and protein clean up and recovery (after fractionation). Using a modified BCA method, protein recovery was shown to be approximately 81% of the starting material and a total of 1.62 mg of protein was retrieved from all fractions, with the lowest concentration in the first 3 compartments as measured by a dot blot analysis (Figure 2C). Protein loss can occur during acetone precipitation,31 which is necessary to remove ampholytes and other impurities in the fractionated sample. Separating proteins based on the isoelectric point demonstrated the feasibility of this technique to improve the spatial resolution of the sample for subsequent mass spectrometry and PTM identification (Figure 3). Protein migration exhibited a slight deviation from predicted positions, particularly in the 6–9 pI range, with more accurate localization at the lower and higher pI values. This behavior could be explained by modifications or proteolytic processing of proteins, which alter their predicted pI. Most proteins fall into the pI range on either side of neutrality. An additional explanation is that protein complexes may be insufficiently denatured, causing the protein members of the complex to appear at unexpected pI’s.
Figure 3.
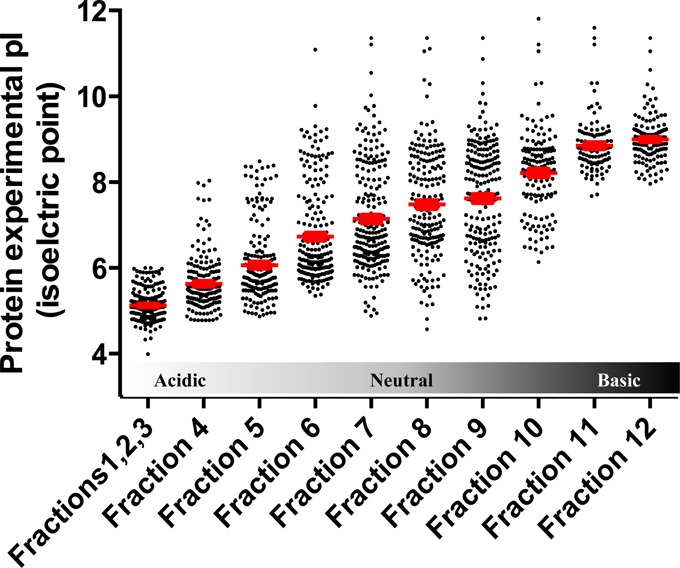
Distribution of experimental protein isoelectric point (pI) focusing for each OFFGel fraction, showing an averaged stepwise increase in protein pI. First 3 fractions were pooled.
3.3. OFFGel Prefractionation Enables Construction of the Comprehensive Core Mouse Proteome Database
We searched the OFFGel prefractionated sample using different software platform environments to obtain the maximum number of confident protein identifications of the mouse kidney proteome. As shown in Figure 4, searching against IPI or UniprotKB/TrEMBL Mus musculus databases resulted in a higher number of protein and peptide identifications in fractions 4–9 than in peripheral compartments (1–3 and 10–12). This finding was seen with data acquisition using the Q-Exactive and Velos Orbitrap but not the Agilent Q-TOF. HCD fragmentation using a Q-Exactive mass spectrometer produced a higher number of confident identifications for both sets of peptides compared with CID fragmentation (Figure 4, panels A–D). After merging replicates (showed 87% overlapping) and removing redundancy, the final mouse kidney proteome data set contained 3124 proteins (FDR < 1%), corresponding to 52 × 103 peptides (Figures 4, panels E and F). The final list of proteins can be found in Supplement 1 of the Supporting Information. The overlap between the proteins identified by three different mass spectrometry platforms provides added confidence to the proteome. As illustrated in Figure 5A, all protein hits, but not peptides, identified by the Agilent Q-TOF were also detected by both the Q-Exactive and Velos Orbitrap. The Q-Exactive analysis identified the same proteins as the Velos Orbitrap, except for 23 proteins representing 0.6% of the final mouse kidney proteome. The utility of the OFFGel prefractionation technique was obvious when we analyzed the same sample before and after fractionation using the same LC–Mass Spec method environment (p1 vs p2). Figure 5 (panels B and C) clearly concluded that prefractionation improved uncovering of 1105 additional protein candidates (mostly low abundance), representing 37% over a nonfractionated sample. Similarly, on the peptide level, the identification rose from 26.E2 (nonfractionated) to 41.9E2 (fractionated).
Figure 4.

Fractionwise distribution of identified proteins and peptides analyzed using 3 different nano-LC–MS/MS. Spectra were searched against mouse (A and C) IPI databases or (B and D) UniProtKB/TrEMBL. (E) Nonredundant protein and (F) peptide lists were generated from each mass spectrometric instrument. Error bars represent standard deviations.
Figure 5.

Venn diagram showing protein and peptide overlapping. (A) Protein overlapping between different mass spectrometric analysis for the same sample. Improvement in (B) protein and (C) peptide identification was confirmed by comparing the same sample analysis before and after OFFGel prefractionation.
3.4. Characteristics of Mouse Kidney Proteome
Evaluation of the merged mouse kidney proteome showed proteins identified with peptides representing a sequence coverage ranging from 0.2 to 95.2% (Figure 6A). Moreover, assuming that spectral count correlates with peptide abundance,32,33 our results (Figure 6B) revealed the existence of very low abundance proteins {3 (log10) fold magnitude lower than abundant proteins [<104 fold of original spectral count detected]}. These results illustrate the broad dynamic range of proteins that we were able to identify. We performed a Kyte–Dolittle analysis of proteins identified to confirm that our proteome analysis contains both hydrophilic and hydrophobic proteins. As shown in Figure 6C, the OFFGel prefractionated sample showed 74.3% globular (hydrophilic) proteins and 26.7% membranous (hydrophobic) proteins. In contrast, hydrophobic proteins were significantly lower (p < 0.05) in the nonfractionated sample (19.8%), as shown in Figure 6D. In order to give a complete biological overview, gene ontology (GO) annotation for the mouse proteome (biological processes, molecular function and cellular localization) was determined using GOrilla21 (Supplements 2a and 2b of the Supporting Information).
Figure 6.

Analysis of proteomic metrics from OFFGel prefractionated mouse kidney lysate generated from 3 different LC–MS/MS instruments (g, Agilent; v, Velos; and q, Q-Exactive). (A) Percentage of protein sequence coverage. (B) Peptide normalized spectral counts. (C and D) Peptide physicochemical properties (hydrophobicity score and peptide molecular weight Da) for prefractionated OFFGel and nonfractionated sample, respectively.
3.5. PTMs Uncovered by OFFGel Prefractionation
To demonstrate the feasibility of OFFGel prefractionation in detecting possible PTMs, we compared the proteomes of the same sample processed by different protocols [shown in Figure 1: P1 (nonfractionated, nonenriched sample), P2 (fractionated, nonenriched), P3 (fractionated, with phospho-enrichment), and P4 (nonfractionated, with phospho-enrichment)]. As illustrated in Figure 7A, modifications were identified in 404 out of 2019 proteins, when they were directly analyzed without the prefractionation process (Figure 7: A1), while 940 modified proteins were identified when the same sample was prefractionated (Figure 7: A2). We postulate that prefractionation allowed the identification of modified peptides from low-abundant proteins because it reduced the background of proteotypic peptides generated from highly abundant proteins. Modified peptides also rose from 3.125 to 10.541, when the sample was prefractionated (Figure 7D and Supplement 3 of the Supporting Information). Figure 7 (panels B and E) reveal a 2.3 fold increase in ubiquitinated peptides after prefractionation (compared to the nonfractionated sample). Similarly, peptides acetylated at Lysine rose modestly but significantly, (P < 0.05) 1.2 fold. This low identification could be explained by the fact that acetylated amines do not readily undergo derivatization in solution. Methionine oxidation was elevated by 1.4 fold, but it is unclear if this increase was due to biological consequences of oxidative stress or to the processing steps during fractionation. Fractionated sample without phospho-enrichment showed a slight but statistically insignificant increase in phosphorylated proteins (577 proteins) compared with the nonfractionated sample (433 proteins) (data not shown). Immunoblotting (Figure 9) shows that phosphopeptides are not lost because of sample handling or adsorption to plastic. Instead, the smaller than expected increase in phosphorylated protein identification could be attributed to the cleavage of the phosphoester bonds and neutral loss of H3PO4 in the mass spectrometer, which often inhibits peptide fragmentation and increases the difficulties of matching peptide sequences to the MS/MS spectra, even in fractionated sample mixtures.3 Interestingly, OFFGel prefractionation with phosphopeptides enrichment showed a dramatic increase (p < 0.01) in phosphopeptide identification (Figure 7G). Here we report the identification of 5525 peptides phosphorylated at serine, threonine, or tyrosine compared with 324 in a nonfractionated, nonenriched protein sample and 3129 phosphopeptides in nonfractionated, enriched sample (Figures 7G). This improvement might be due to lowering complexity, which led to better binding (at the enrichment step and/or) at the MS analysis level. Previous studies have shown that fractionation of phosphopeptides using SCX or ERLIC followed by IMAC or TiO2 purification could enrich more than 6000 phosphopeptides.34,35 On the other hand, phosphomotif enrichment analysis between nonfractionated-enriched and OFFGel-TiO2-enriched samples showed similar probability (∼0.72), while it revealed significant differences for both pS and pT motifs (Figure 7, panels H and I), most likely due to different phosphopeptide identifications between both samples. Our results show that the combination of OFFGel prefractionation with an enrichment strategy is a powerful method for the identification of protein modifications, but further investigations are required to test whether this method can be used for different PTMs.
Figure 7.

Exploration of post-translational modifications of mouse kidney proteome. (A) shows number of modified and nonmodified proteins (A1) before and (A2) after prefractionation. (D) shows the number of modified peptides (D1) before and (D2) after prefractionation. Peptides were sorted based on its spanned modification for both (B) prefractionated OFFGel sample and (E) nonfractionated sample. Phosphopeptides were sorted based on the modification of amino acid residue for (C) fractionated and (F) nonfractionated samples (pY, phosphotyrosine; pT, phosphothreonine; and pS, phosphoserine). (G) Phosphopeptides identification histogram using different combinations of fractionation and TiO2 phospho-enrichment [p1-p4; paths, as described in Figure 1]. Phosphomotif enrichment analysis and sequence logo illustration of phosphoserine and threonine sites identified from (H) fractionated and (I) nonfractionated enriched samples. Bars were plotted in comparison to the total number of modified peptides (B, C, E, and F), with ** indicating statistical significance (p < 0.01).
Figure 9.

Western blot analysis of kidney lysate using antiphosphotyrosine antibody, P-Tyr-100. The protein lysate (35 μg) was precipitated, resuspended in a urea-based buffer, separated on a 7 cm 2D gel electrophoresis (2-DE) gel, transferred to a PVDF membrane, and immunoblotted with P-Tyr-100. Image was subjected to long exposure to show the tyrosine-phosphorylated protein spots clearly. Horizontal axis represents isoelectric point (pI), ranging between 3–10, and the vertical axis represents 2D electrophoresis in KDa.
3.6. PTMs Involve in Pivotal Renal Proteins
In our study, several modified proteins were shown to be involved in regulating the activities of some crucial renal functions. As illustrated in Figure 8, phosphorylated proteins spectrin, ATP synthase, and cubilin revealed modification at S, Y, and T residues, respectively. Spectrin is a component of the nephrin multiprotein complex that regulates plasma membrane integrity and the cytoskeletal structure (Figure 8A),36 while ATP synthase is an important enzyme that provides energy for the cell through ATP synthesis (Figure 8B),37 and cubulin acts as a receptor for intrinsic factor-vitamin B12 complexes located within the kidney epithelia and renal proximal tubule (Figure 8C).38 These proteins were shown to be physiologically active when phosphorylated.36−38 Peptides acetylated and ubiquitinated on lysine were detected in fructose-1,6-biphosphatase (Figure 8D) and voltage-dependent anion-selective protein1 (Figure 8E), respectively. Recent reports showed the importance of acetylation on the functional activity of fructose-1,6-biphosphatase39,40 and ubiquitination on protein 1 stability and degradation.3,12 Methionine oxidation of the propionyl-CoA carboxylase enzyme has been examined in this study (Figure 8F). This enzyme plays an important role in the metabolic pathway by catalyzing the carboxylation reaction of propionyl CoA in the renal mitochondrial matrix. Oxidation of methionine has been shown in some proteins to lead to a significant change in their biological activity41,42 and development of some disorders.43 However, further investigation is required to clarify the biological significance of this modification. Finally, the existence of modified phosphoproteins has been visualized in a fractionated sample (Figure 9). Western blotting using antiphosphotyrosine antibody P-Tyr-100 was performed on a 7 cm polyacrylamide gel, which revealed the presence of 224 protein-representing spots (P < 0.05).
Figure 8.

Representative annotation of tandem mass spectrometric (MS/MS) spectra of the [M + 2H]2+ ion for some modified peptides reported in mouse kidney proteome. (A) Phosphoserine (+79.96), (B) phosphotyrosin (+79.96, (C) phosphothreonine (+79.96), (D) acetylated lysine (+42.01), (E) ubiquitinated lysine (+114.04), and (F) oxidized methionine (+15.99).
4. Concluding Remarks
Our study presents a proteomic pipeline for extensive characterization of the mouse kidney proteome. The data reported here shows that an OFFGel prefractionation system greatly enhanced the identification of low-abundant and hydrophobic proteins. We also demonstrated the feasibility of OFFGel prefractionation to unveil protein functional relevance by detecting PTMs, especially when the prefractionation was coupled with targeted enrichment such as phospho-enrichment. The OFFGel-TiO2 platform showed, for the first time, its capability to improve phosphopeptide identification. Finally, detailed mouse kidney proteome with phosphopeptide enrichment presented here serves as a useful model for better understanding how protein modifications work and will ultimately contribute to our understanding of disease etiology and normal physiological functions of the kidney.
Acknowledgments
Thanks are due to Claire Delahunty, James Moresco, and Jolene K. Diedrich from The Scripps Research Institute (TSRI) for their conceptual advice. This work was supported by JSPS (Japan Society for Promotion of Science) Grant-in-Aid for scientific research (B) to S.M. (23790933), Grant-in-Aid for scientific research (B) to T.Y. (21390262), Grant-in-Aid for publication of scientific research results (database) to T.Y. (228071), and Strategic young researcher overseas visits program for accelerating brain circulation (S2302). Partial support was provided by NIH Grants P41 GM103533, R01 MH067880, and V19 AI063603 to J.R.Y. The funding agencies had no role in study design, data collection and analysis, decision to publish, or preparation of the manuscript.
Supporting Information Available
Supplement 1: mouse kidney proteome database generated from OFFGel prefractionated sample. Supplement 2a: GO annotation network of constructed kidney proteome database. Supplement 2b: GO detailed term list. Supplement 3: list of peptide modifications generated from OFFGel prefractionated and enriched kidney sample. This material is available free of charge via the Internet at http://pubs.acs.org.
The authors declare no competing financial interest.
Funding Statement
National Institutes of Health, United States
Supplementary Material
References
- Mann M.; Jensen O. N. Proteomic analysis of post-translational modifications. Nat. Biotechnol. 2003, 213255–261. [DOI] [PubMed] [Google Scholar]
- Prabakaran S.; Lippens G.; Steen H.; Gunawardena J. Post-translational modification: Nature’s escape from genetic imprisonment and the basis for dynamic information encoding. Wiley Interdiscip. Rev.: Syst. Biol. Med. 2012, 46565–583. [DOI] [PMC free article] [PubMed] [Google Scholar]
- Witze E. S.; Old W. M.; Resing K. A.; Ahn N. G. Mapping protein post-translational modifications with mass spectrometry. Nat. Methods 2007, 410798–806. [DOI] [PubMed] [Google Scholar]
- Khoury G. A.; Baliban R. C.; Floudas C. A.. Proteome-wide post-translational modification statistics: Frequency analysis and curation of the Swiss-Prot database. Sci. Rep. 2011, 1, 1–5.. [DOI] [PMC free article] [PubMed] [Google Scholar]
- Silva A.; Vitorino R.; Domingues M. R.; Spickett C. M.; Domingues P. Post-translational modifications and mass spectrometry detection. Free Radical Biol. Med. 2013, 65, 925–941. [DOI] [PubMed] [Google Scholar]
- Walsh C. T.; Garneau-Tsodikova S.; Gatto G. J. Jr. Protein posttranslational modifications: The chemistry of proteome diversifications. Angew. Chem., Int. Ed. 2005, 44457342–7372. [DOI] [PubMed] [Google Scholar]
- Zha D.; Chen C.; Liang W.; Chen X.; Ma T.; Yang H.; Goor H.; Ding G. Nephrin phosphorylation regulates podocyte adhesion through the PINCH-1-ILK-alpha-parvin complex. BMB Rep. 2013, 464230–235. [DOI] [PMC free article] [PubMed] [Google Scholar]
- Zhang Y.; Yoshida Y.; Nameta M.; Xu B.; Taguchi I.; Ikeda T.; Fujinaka H.; Magdeldin S.; Tsukaguchi H.; Harita Y.; Yaoita E.; Yamamoto T. Glomerular proteins related to slit diaphragm and matrix adhesion in the foot processes are highly tyrosine phosphorylated in the normal rat kidney. Nephrol., Dial., Transplant. 2010, 2561785–1795. [DOI] [PubMed] [Google Scholar]
- Nicolaou N.; Margadant C.; Kevelam S. H.; Lilien M. R.; Oosterveld M. J.; Kreft M.; van Eerde A. M.; Pfundt R.; Terhal P. A.; van der Zwaag B.; Nikkels P. G.; Sachs N.; Goldschmeding R.; Knoers N. V.; Renkema K. Y.; Sonnenberg A. Gain of glycosylation in integrin alpha3 causes lung disease and nephrotic syndrome. J. Clin. Invest. 2012, 122124375–4387. [DOI] [PMC free article] [PubMed] [Google Scholar]
- Chuang P. Y.; Dai Y.; Liu R.; He H.; Kretzler M.; Jim B.; Cohen C. D.; He J. C. Alteration of forkhead box O (foxo4) acetylation mediates apoptosis of podocytes in diabetes mellitus. PLoS One 2011, 68e23566. [DOI] [PMC free article] [PubMed] [Google Scholar]
- Reivinen J.; Holthofer H.; Miettinen A. A cell-type specific ganglioside of glomerular podocytes in rat kidney: An O-acetylated GD3. Kidney Int. 1992, 423624–31. [DOI] [PubMed] [Google Scholar]
- Togawa A.; Yamamoto T.; Suzuki H.; Fukasawa H.; Ohashi N.; Fujigaki Y.; Kitagawa K.; Hattori T.; Kitagawa M.; Hishida A. Ubiquitin-dependent degradation of Smad2 is increased in the glomeruli of rats with anti-thymocyte serum nephritis. Am. J. Pathol. 2003, 16341645–1652. [DOI] [PMC free article] [PubMed] [Google Scholar]
- Yan K.; Khoshnoodi J.; Ruotsalainen V.; Tryggvason K. N-linked glycosylation is critical for the plasma membrane localization of nephrin. J. Am. Soc. Nephrol. 2002, 1351385–1389. [DOI] [PubMed] [Google Scholar]
- Michel P. E.; Reymond F.; Arnaud I. L.; Josserand J.; Girault H. H.; Rossier J. S. Protein fractionation in a multicompartment device using Off-Gel isoelectric focusing. Electrophoresis 2003, 241–23–11. [DOI] [PubMed] [Google Scholar]
- Wisniewski J. R.; Zougman A.; Nagaraj N.; Mann M. Universal sample preparation method for proteome analysis. Nat. Methods 2009, 65359–362. [DOI] [PubMed] [Google Scholar]
- Magdeldin S.; Li H.; Yoshida Y.; Satokata I.; Maeda Y.; Yokoyama M.; Enany S.; Zhang Y.; Xu B.; Fujinaka H.; Yaoita E.; Yamamoto T. Differential proteomic shotgun analysis elucidates involvement of water channel aquaporin 8 in presence of alpha-amylase in the colon. J. Proteome Res. 2010, 9126635–6646. [DOI] [PubMed] [Google Scholar]
- Larsen M. R.; Thingholm T. E.; Jensen O. N.; Roepstorff P.; Jorgensen T. J. Highly selective enrichment of phosphorylated peptides from peptide mixtures using titanium dioxide microcolumns. Mol. Cell. Proteomics 2005, 47873–886. [DOI] [PubMed] [Google Scholar]
- Rappsilber J.; Mann M.; Ishihama Y. Protocol for micro-purification, enrichment, pre-fractionation and storage of peptides for proteomics using StageTips. Nat. Protoc. 2007, 281896–1906. [DOI] [PubMed] [Google Scholar]
- McDonald W. H.; Tabb D. L.; Sadygov R. G.; MacCoss M. J.; Venable J.; Graumann J.; Johnson J. R.; Cociorva D.; Yates J. R. 3rd MS1, MS2, and SQT-three unified, compact, and easily parsed file formats for the storage of shotgun proteomic spectra and identifications. Rapid Commun. Mass Spectrom. 2004, 18182162–2168. [DOI] [PubMed] [Google Scholar]
- Gnad F.; Gunawardena J.; Mann M. PHOSIDA 2011: The posttranslational modification database. Nucleic Acids Res. 2011, 39database issueD253–260. [DOI] [PMC free article] [PubMed] [Google Scholar]
- Eden E.; Navon R.; Steinfeld I.; Lipson D.; Yakhini Z. GOrilla: A tool for discovery and visualization of enriched GO terms in ranked gene lists. BMC Bioinf. 2009, 10, 48. [DOI] [PMC free article] [PubMed] [Google Scholar]
- Enany S.; Yoshida Y.; Magdeldin S.; Bo X.; Zhang Y.; Enany M.; Yamamoto T. Two dimensional electrophoresis of the exo-proteome produced from community acquired methicillin resistant Staphylococcus aureus belonging to clonal complex 80. Microbiol. Res. 2013, 1688504–511. [DOI] [PubMed] [Google Scholar]
- Magdeldin S.; Li H.; Yoshida Y.; Enany S.; Zhang Y.; Xu B.; Fujinaka H.; Yaoita E.; Yamamoto T. Comparison of two dimensional electrophoresis mouse colon proteomes before and after knocking out Aquaporin 8. J. Proteomics 2010, 73102031–2040. [DOI] [PubMed] [Google Scholar]
- Tobolkina E.; Cortes-Salazar F.; Momotenko D.; Maillard J.; Girault H. H. Segmented field OFFGEL(R) electrophoresis. Electrophoresis 2012, 33223331–3338. [DOI] [PubMed] [Google Scholar]
- Krishnan S.; Gaspari M.; Della Corte A.; Bianchi P.; Crescente M.; Cerletti C.; Torella D.; Indolfi C.; de Gaetano G.; Donati M. B.; Rotilio D.; Cuda G. OFFgel-based multidimensional LC-MS/MS approach to the cataloguing of the human platelet proteome for an interactomic profile. Electrophoresis 2011, 326–7686–695. [DOI] [PubMed] [Google Scholar]
- Barbhuiya M. A.; Sahasrabuddhe N. A.; Pinto S. M.; Muthusamy B.; Singh T. D.; Nanjappa V.; Keerthikumar S.; Delanghe B.; Harsha H. C.; Chaerkady R.; Jalaj V.; Gupta S.; Shrivastav B. R.; Tiwari P. K.; Pandey A. Comprehensive proteomic analysis of human bile. Proteomics 2011, 11234443–4453. [DOI] [PubMed] [Google Scholar]
- Ho J. H.; Lee O. K.; Fu Y. J.; Shih H. T.; Tseng C. Y.; Chung C. C.; Han C. L.; Chen Y. J. An iTRAQ proteomic study reveals an association between diet-induced enhanced fatty acid metabolism and the development of glucose intolerance in prediabetic mice. J. Proteome Res. 2013, 1231120–1133. [DOI] [PubMed] [Google Scholar]
- Abdallah C.; Sergeant K.; Guillier C.; Dumas-Gaudot E.; Leclercq C. C.; Renaut J. Optimization of iTRAQ labelling coupled to OFFGEL fractionation as a proteomic workflow to the analysis of microsomal proteins of Medicago truncatula roots. Proteome Sci. 2012, 10137. [DOI] [PMC free article] [PubMed] [Google Scholar]
- García-Otero N.; Pena-Vazquez E.; Barciela-Alonso M. C.; Bermejo-Barrera P.; Moreda-Pineiro A. Two-dimensional isoelectric focusing OFFGEL and microfluidic lab-on-chip electrophoresis for assessing dissolved proteins in seawater. Anal. Chem. 2013, 85125909–5916. [DOI] [PubMed] [Google Scholar]
- Konečná H.; Muller L.; Dosoudilova H.; Potesil D.; Bursikova J.; Sedo O.; Marova I.; Zdrahal Z. Exploration of beer proteome using OFFGEL prefractionation in combination with two-dimensional gel electrophoresis with narrow pH range gradients. J. Agric. Food Chem. 2012, 60102418–2426. [DOI] [PubMed] [Google Scholar]
- Fic E.; Kedracka-Krok S.; Jankowska U.; Pirog A.; Dziedzicka-Wasylewska M. Comparison of protein precipitation methods for various rat brain structures prior to proteomic analysis. Electrophoresis 2010, 31213573–3579. [DOI] [PubMed] [Google Scholar]
- Vogel C.; Marcotte E. M. Label-free protein quantitation using weighted spectral counting. Methods Mol. Biol. 2012, 893, 321–341. [DOI] [PMC free article] [PubMed] [Google Scholar]
- Sudhir P. R.; Chen C. H.; Pavana Kumari M.; Wang M. J.; Tsou C. C.; Sung T. Y.; Chen J. Y. Label-free quantitative proteomics and N-glycoproteomics analysis of KRAS-activated human bronchial epithelial cells. Mol. Cell. Proteomics 2012, 1110901–915. [DOI] [PMC free article] [PubMed] [Google Scholar]
- Zarei M.; Sprenger A.; Metzger F.; Gretzmeier C.; Dengjel J. Comparison of ERLIC-TiO2, HILIC-TiO2, and SCX-TiO2 for global phosphoproteomics approaches. J. Proteome Res. 2011, 1083474–3483. [DOI] [PubMed] [Google Scholar]
- Olsen J. V.; Blagoev B.; Gnad F.; Macek B.; Kumar C.; Mortensen P.; Mann M. Global, in vivo, and site-specific phosphorylation dynamics in signaling networks. Cell 2006, 1273635–648. [DOI] [PubMed] [Google Scholar]
- Lehtonen S.; Ryan J. J.; Kudlicka K.; Iino N.; Zhou H.; Farquhar M. G. Cell junction-associated proteins IQGAP1, MAGI-2, CASK, spectrins, and alpha-actinin are components of the nephrin multiprotein complex. Proc Natl Acad Sci U.S.A. 2005, 102289814–9819. [DOI] [PMC free article] [PubMed] [Google Scholar]
- Jonckheere A. I.; Smeitink J. A.; Rodenburg R. J. Mitochondrial ATP synthase: Architecture, function and pathology. J. Inherited Metab. Dis. 2012, 352211–225. [DOI] [PMC free article] [PubMed] [Google Scholar]
- Christensen E. I.; Birn H. Megalin and cubilin: Synergistic endocytic receptors in renal proximal tubule. Am. J. Physiol.: Renal, Fluid Electrolyte Physiol. 2001, 2804F562–F573. [DOI] [PubMed] [Google Scholar]
- Choudhary C.; Kumar C.; Gnad F.; Nielsen M. L.; Rehman M.; Walther T. C.; Olsen J. V.; Mann M. Lysine acetylation targets protein complexes and co-regulates major cellular functions. Science 2009, 3255942834–840. [DOI] [PubMed] [Google Scholar]
- Lundby A.; Lage K.; Weinert B. T.; Bekker-Jensen D. B.; Secher A.; Skovgaard T.; Kelstrup C. D.; Dmytriyev A.; Choudhary C.; Lundby C.; Olsen J. V. Proteomic analysis of lysine acetylation sites in rat tissues reveals organ specificity and subcellular patterns. Cell Rep. 2012, 22419–431. [DOI] [PMC free article] [PubMed] [Google Scholar]
- Stadtman E. R.; Moskovitz J.; Levine R. L. Oxidation of methionine residues of proteins: Biological consequences. Antioxid. Redox Signaling 2003, 55577–582. [DOI] [PubMed] [Google Scholar]
- Vogt W. Oxidation of methionyl residues in proteins: Tools, targets, and reversal. Free Radical Biol. Med. 1995, 18193–105. [DOI] [PubMed] [Google Scholar]
- Berlett B. S.; Stadtman E. R. Protein oxidation in aging, disease, and oxidative stress. J. Biol. Chem. 1997, 2723320313–20316. [DOI] [PubMed] [Google Scholar]
Associated Data
This section collects any data citations, data availability statements, or supplementary materials included in this article.