

Abstract
Manganese enhanced MRI (MEMRI) with topical loading of MnCl2 provides comparable optic nerve enhancement as seen by intravitreal injection. However, the impact of this novel and noninvasive Mn2+ loading method on visual function requires further assessments. The objective of this study is to determine the optimal topical Mn2+ loading dosage for MEMRI and to assess visual function after MnCl2 loading. Intravitreal administration was performed to compare the two approaches of MnCl2 loading. Twenty-four hours after topical loading of 0, 0.5, 0.75, and 1M MnCl2, T1-weighted (T1W), T2-weighted (T2W), diffusion tensor image (DTI) and visual acuity were performed to determine the best topical loading dosage for MEMRI measurements and to assess the integrity of retina and optic nerves. Mice were perfusion fixed immediately after in vivo experiments for H&E and immunohistochemistry staining. Topical loading of 1 M MnCl2 damaged the retinal photoreceptor layer with no detectable damage to retina ganglion cell layers or prechiasmatic optic nerves. For the topical loading, 0.75-M MnCl2 was required to see sufficient enhancement of optic nerve. At this concentration the visual function was significantly affected, followed by a slow recovery. Intravitreal injection (0.25 μL of 0.2 M MnCl2) slightly affected visual acuity with full recovery a day later. To conclude, intravitreal MnCl2 injection provides more reproducible results with less adverse side effects than topical loading.
Introduction
Manganese (Mn2+), as a calcium (Ca2+) analog, enters cell through voltage-gated Ca2+ channels. After entry into the cell, Mn2+ is transported by fast axonal transport in vesicles and released into the synaptic cleft (1). Mn2+ produces a concentration-dependent shortening of tissue T1 due to its paramagnetic property. Therefore, Mn2+ can serve as both contrast agent and axonal transport tracer. T1-weighted (T1W) imaging is usually performed to monitor real-time Mn2+ transport reflected by the extent of enhancement in T1W MRI (2). Therefore, manganese-enhanced MRI (MEMRI) provides a potential approach to further explore the visual pathway from retinal ganglion cells, optic nerve, to contralateral optic tract and superior colliculus (3). Indeed, MEMRI has recently been used as a biomarker and tracer to investigate optic nerve axonal integrity (4–9), retinal projections to the superior colliculus through intravitreal injection of MnCl2 (10), layer-specific calcium-dependent retinal fMRI activation (11,12), or cortical response to stimulation (13). Recently, MEMRI has also been applied to assess retinal and callosal projections in early postnatal development and plasticity (14).
The cellular toxicity of Mn2+ has long been recognized as overexposure causes Parkinsonism (15). Therefore, it is important to determine optimal Mn2+ dosing, which is a tradeoff between maximizing MR detectability and minimizing toxicity (16). The toxicity of MnCl2 after intravitreal injection has been examined previously by histology and visual function measurements (7,17–20). In an attempt to remedy the invasive intraocular injection of MnCl2, Sun et al. proposed to deliver Mn2+ through topical loading (21). Topical loading is a simple, noninvasive approach for Mn2+ delivery, achieved by dropping MnCl2 solution directly onto the eye. The effect of repetitive topical MnCl2 loading was recently examined reporting RGC loss after three bi-weekly applications of 1 M MnCl2 while no RGC loss was observed after three monthly applications (22). Corneal thickening was also observed after seven bi-weekly applications (22). It appeared that increasing the time interval between repetitive topical applications reduced adverse effects seen in RGC and cornea. In this study, the effect of topical and intravitreal loading of MnCl2 was examined by assessing post-loading visual acuity and structural integrity of both retina (by high resolution in vivo T2-weighted MRI and histology) and prechiasmatic optic nerves ( by in vivo diffusion tensor imaging, i.e., DTI). Results suggest that intravitreal injection of MnCl2 is safe with limited adverse effects when administered in small volume and low doses, sufficient to monitor axonal transport.
Materials and Methods
All experimental procedures were approved by Washington University’s Animal Studies Committee and conformed to the NIH Policy on Responsibility for Care and Use of Animals and the ARVO Statement for the Use Animals in Ophthalmic and Vision Research.
Topical MnCl2 Loading
Thirty-five female C57BL/6 mice obtained from Jackson Laboratory (Bar Harbor, ME) at 8 weeks of age underwent topical loading of 0 (n=5), 0.5 (n=5), 0.75 (n=15), or 1 M (n=10) of MnCl2 in 0.9% saline. After anesthetized using 1.5–2% isoflurane/oxygen, a 30-μL drop of MnCl2 was introduced covering the entire right eye. An additional 10μL of MnCl2 was applied every 15 min to maintain the topical-fluid volume (total volume was 30 + 3 × 10 = 60μL), different from the original procedure reported by Sun et al.(21), assuring a consistent loading among various lab personnel.
Intravitreal MnCl2 Injection
An additional twenty 8-week old female C57BL/6 mice were employed to compare the “safe” injection volumes of 0.25 and 2 μL using saline (n = 5 each group), and the “safe” dose using 0.25 (n = 5) and 0.125 (n = 5) μL of 0.2-M MnCl2 in saline. Mice, under 1.5 – 2% isoflurane/oxygen anesthesia, were placed on a custom-made head holder for intravitreal injection at 3-μL/min using a 34-gauge needle connected to a micro-injection pump (WPI Instrument, FL). After infusion, the needle was left in place for an extra 1 minute before withdrawal. A drop of topical antibiotic was applied after removing the injection needle (23).
Visual Acuity Assessment
Visual acuity (VA) was assessed using the OptoMotry Virtual Optometry System, (Cerebral Mechanics, Inc., Canada). Mice were placed on the platform inside the chamber with virtual rotating columns projected on four LCD monitors surrounding it. The spatial frequency in cycle/degree (c/d) starting from 0.1 c/d was incremented in steps of 0.05 c/d until the mouse stopped responding to the projected visual patterns, which was recorded as the VA (24,25). Thirty normal C57BL/6 mice were measured to establish the baseline VA for naïve animals. VA was measured before MnCl2 loading and at days 1 through 7 after topical MnCl2 loading, and at 4, 24, and 48 hours after intravitreal injection.
MRI: DTI and T1-weighted imaging of the visual pathway
Twenty-four hours after topical or intravitreal MnCl2 loading, MRI measurements were performed on a 4.7T Agilent Diect Drive small-animal MRI system (Agilent Technologies, CA) equipped with a Magnex/Agilent HD gradient coil set (Magnex, Oxford, UK) with pulse gradient strength up to 58 G/cm and a gradient rise time ≤ 295 μs. Mice were anesthetized by isoflurane/oxygen (1.5%). Respiratory rate and body temperature were monitored during experiments using a MR compatible animal monitoring system (SA Instrument, Inc., NY). The body temperature was maintained at 37°C with a regulated circulating warm water pad placed underneath mouse body along with regulated warm air blown into the magnet bore. An actively-decoupled 1.7-cm receive coil was placed on top of the mouse head. The animal holder assembly, including the receive coil was placed in an 8-cm active-decoupled volume transmit coil (26,27).
T1-weighted Imaging
A 3D gradient echo sequence was employed to image mouse brain with the following parameters: TR= 15 ms, TE= 2.63 ms, flip angle 20º, number of averages 16, FOV 15×15×22 mm3, data matrix size 128×128×64 (zero-filled to 256×256×128). Regions of interest (ROI) were manually outlined according to a previously published protocol (21) on the extracted 2D images containing retina, optic nerve, and superior colliculus using ImageJ software (NIH, http://bigwww.epfl.ch/sage/soft/watershed/, US). The ROI of the Mn2+-loaded structures along the visual pathway was outlined and mean signal intensity was obtained using ImageJ. The signal intensity of the loaded ROI was normalized by the contralateral mean intensity to correct scan-to-scan sensitivity differences resulting from variable sample loading.
DTI of Prechiasmatic Optic Nerve
Optic nerve DTI was performed using a multi-echo spin-echo diffusion weighted imaging sequence (28) with the following parameters: TR = 1.5 s, TE = 34 ms (first echo time, including required time for diffusion-weighting gradients), inter-echo delay time 19 ms, FOV 22.5×22.5 mm2, matrix size 192×192 (zero-filled to 384×384); in-plane resolution 117×117 mm2 (prior to zero-filling), slice thickness 0.5 mm, two diffusion-sensitizing factors (b value) 0.0 and 1.0 ms/μm2 (with δ = 5 ms and Δ = 18 ms). The standard six-direction diffusion encoding scheme was used, with [Gx, Gy, Gz] = [1, 1, 0], [1, 0, 1], [0, 1, 1], [−1, 1, 0], [0, −1, 1], and [1, 0, −1]. A train of three echoes were co-added to generate the final MR images to increase signal-to-noise ratio. Total acquisition time was 1 hour and 40.8 minutes. We chose to image only the prechiasmatic optic nerves to minimize the potential partial volume effect. Specifically, in this region of optic nerves a straight segment of nerve is readily identifiable allowing an image plane to be as nearly perpendicular to optic nerves as possible to minimize partial volume effects. Fractional anisotropy (FA), axial (λ||) and radial (λ⊥) diffusivity maps were generated from the image data by programs written in Matlab (MathWorks, Natick, MA).
T2-weighted Imaging of Retina
For retinal imaging, mice were anesthetized by intraperitoneal injection of ketamine (87 mg/kg) and xylazine (13 mg/kg) followed by constant subcutaneous infusion of ketamine (54 mg/kg/h)/xylazine (4 mg/kg/h). The infusion rate was adjusted to maintain the respiratory rate between 150 – 210 breaths/min during imaging. Retina imaging was performed on an Agilent 11.74 T DirectDrive small-animal MRI system using a spin-echo sequence with the following parameters: TR = 2 s, TE = 34 ms, FOV 12×12 mm2, matrix size 256×256 (zero-filled to 512×512); in-plane resolution 47×47 μm2 (prior to zero-filling), slice thickness 0.4 mm. All images were acquired on a nasal-temporal slice bisecting the eye through the retina and optic nerve head.
Histology
Optic nerve
Following MR experiments, mice were perfused with 4 % paraformaldehyde in phosphate-buffered saline (PBS). Brains were excised and post-fixed in fixative for 24 hours then transferred to 1% PBS for storage at 4ºC until histological analysis. Mouse optic nerves were embedded in 2 % agar gel followed by paraffin embedding (29). Five-μm thick transverse slices were sectioned for immunohistochemical staining. All sectioned tissues were deparaffinized, rehydrated, and blocked in solution mixed with 1% bovine serum albumin (BSA) and 2% Triton-X100 for an hour at room temperature to prevent non-specific binding and to increase antibody permeability. Slides were incubated in monoclonal anti-phosphorylated neurofilament antibody (SMI-31; 1:2000, Covance) to stain non-injured axons, or in rabbit anti-myelin basic protein (MBP) antibody (1:1000 Sigma-Aldrich, MO) to stain myelin sheath at 4ºC overnight. After rinsing, goat anti-mouse IgG or goat anti-rabbit IgG conjugated Alexa 488 (1:800, Invitrogen, CA) were applied to visualize immunoreactivity of phosphorylated neurofilaments and MBP. Finally, slides were covered using Vectashield Mounting Medium with 4′, 6-diamidino-2-phenylindole (DAPI) (Vector Laboratory, Inc., Burlingame, CA). Histological slides were examined with Nikon Eclipse 80i fluorescence microscope. Images were captured with a black-and-white CCD camera using MetaMorph software (Universal Imaging Corporation, Sunnyvale, CA).
Retina
Mouse eyes were flash-frozen immediately after enucleation to avoid dehydration and fixation induced tissue distortion. Frozen-cut 8-μm-thick tissue sections were stained with hematoxylin and eosin (H&E) to assess the integrity of multiple retinal layers. Histological slices were scanned with Olympus NanoZoomer slide scanner (Hamamatsu Photonics, Hamamatsu, Japan). For quantitative analysis of H&E staining, scanned images were exported with NDP viewer software (Hamamatsu Photonics, Hamamatsu, Japan) with 20× objective. ROIs were selected to contain the retina segment with proximal and distal ends located at 250 and 800 μm away from the optic nerve head on both sides of the nerve head.(30) Within the ROIs, the retinal thickness was measured from nerve fiber layer to retina pigment epithelium every 55 μm (i.e., 10 measurements total). Ten measurements were averaged as the representative thickness for that side of retina.
Statistical analysis
Multiple comparisons for T1W enhancement in retina, optic nerve, and superior colliculus after Mn2+ loading were performed using a linear repeated measures model with adjustment for multiple testing using Tukey’s HSD (honest significant difference). A linear repeated measures model was used to estimate the mean difference in VA between loaded and contralateral control eyes by dosages and day of experiment (from baseline to day 7 ). The effect of Mn2+ loading on the mean retinal thickness was assessed using a linear model on a log scale in each of the five study groups. Each Mn2+ treated group was compared with the saline control. P-values for the difference in mean retinal thickness were adjusted for multiple tests using Tukey’s HSD.
Results
Topical MnCl2 Loading
Manganese Enhanced T1W MRI
T1-weighted images of 1-M MnCl2 loaded visual pathway including ipsilateral retina and optic nerve (ON), and contralateral lateral geniculate nucleus (LGN) and superior colliculus (SC) clearly demonstrated signal enhancement on these structures (Fig. 1A). The image of retina and optic nerve with 0.5, 0.75, and 1 M of MnCl2 loading (Fig. 1B) suggested that both 1 and 0.75 M of MnCl2 loading led to discernible signal enhancement in optic nerve while 0.5 M did not. Compared to the saline group, the group-averaged ROI analysis (Fig. 1C) demonstrated that 0.75 and 1 M of MnCl2 loading significantly enhanced all structures along the visual pathway.
Figure 1.

Representative T1W images with 1M topical MnCl2 loading acquired from a mouse brain at 24 hours after loading (A), ipsilateral retina and optic nerve (ON), and contralateral lateral geniculate nucleus (LGN) and superior colliculus (SC) are enhanced with topical loading (arrows). The oblique images (B) bisecting retina and optic nerve after topical loading of 1, 0.75, and 0.5M MnCl2 suggest that 0.75M MnCl2 was sufficient to produce discernible enhancement of optic nerve. Bar graphs (C, mean ± SD) demonstrate the signal intensity ratio between labeled and control retina, ON, and SC. With 1 and 0.75M MnCl2 loading, a significant enhancement of the structures along the visual system (retina, ON, LGN, SC) was clearly seen. In contrast, only slight retinal enhancement was seen with 0.5M MnCl2 loading. Therefore, 0.75M was the concentration selected for topical loading in this study.
* indicates that P < 0.005 compared to saline group via Tukey HSD test.
Visual Acuity
The VA of normal female C57BL/6 mice is 0.37 ± 0.03 c/d (mean ± SD; n=30). Topical loading of 1-M MnCl2 caused total blindness (VA ~ 0 c/d) at one day after loading without recovery up to 7 days after loading (open squares; Fig. 2). A significant VA decrease in eyes following 0.75-M MnCl2 loading was also observed (open circles; Fig. 2). However, the decreased VA gradually recovered to the normal range at day 5 (VA ≥ 0.3 c/d). Contralateral control eyes in animals treated without 1 and 0.75-M MnCl2 loading were not affected throughout the time course (filled symbols, Fig. 2). Mice topically loaded with 0.5M MnCl2 exhibited a slight VA decrease at one day after loading and recovered to normal at day 2; saline-loaded eyes exhibited normal VA throughout the time course (data not shown).
Figure 2.
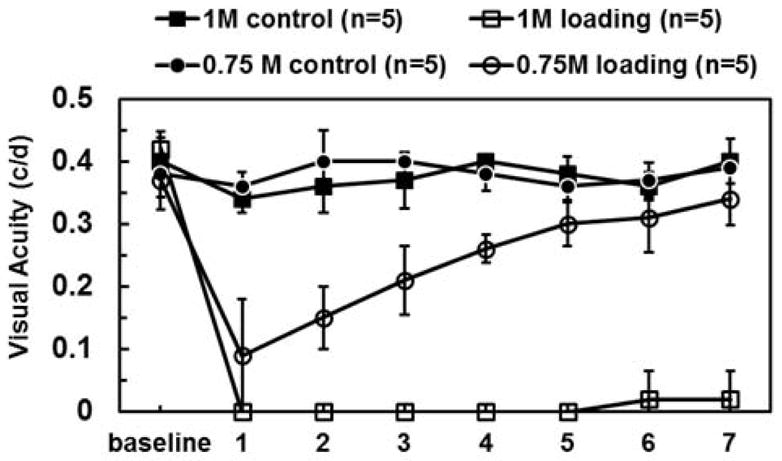
Visual acuity was measured daily in eyes after topical loading with 0.75 and 1M MnCl2 (open symbols), and in contralateral, control eyes (filled symbols). Tests for difference between the dose groups indicate that there is no difference at baseline or on the first day of treatment. Between days 2 and 7, however, the difference between loaded and control eyes is not the same in the two different dosage groups (p-values < 0.0001 at days 2–7). At one day after 1M of MnCl2 loading, the visual acuity decreased to zero (completely blind) and did not recover throughout the 7-day time course. In contrast, one day after 0.75M of MnCl2 loading visual acuity decreased to 0.1 c/d and recovered beginning on Day 2 (p < 0.05, compared to 1M loading eyes) until recovering back to the normal range by Day 6.
Note 1: mean VA of normal B6 mice (n=30) is 0.36 ± 0.03 (c/d; mean ± SD)
Note 2: c/d denotes units of cycles per degree
DTI and Immunohistochemistry of Optic Nerve
In vivo DTI of optic nerves was performed at days 1 and 7 after 1M MnCl2 loading (VA = 0 c/d). Color-coded FA, maps derived from DTI analysis clearly delineated the optic nerves (Fig. 3A). There was no statistically-significant difference in group-averaged λ|| and λ⊥ between the loaded and control optic nerves at days 1 and 7 after MnCl2 loading (Fig. 3B). These DTI findings suggested that there was no detectable axon or myelin injury at prechiasmatic optic nerves after topical MnCl2 loading (31), supported by the immunohistochemical staining of phosphorylated neurofilaments (SMI-31; green dots in Fig. 3C) and myelin basic protein (MBP; red rings in Fig. 3C) from the same nerves after in vivo DTI.
Figure 3.

Brain DTI maps, containing prechiasmatic optic nerves, from mice at one and seven days after topical loading of 1M MnCl2 were examined to assess the effect of Mn2+ on axonal integrity. The region-of-interest (ROI) based analysis was performed on diffusion metrics, including fractional anisotropy (FA), axial (λ||), and radial (λ⊥) diffusivity, from each optic nerve (A, outline in red). At one and seven days after 1M of MnCl2 loading, there was no difference in λ|| and λ⊥ between the optic nerves from the control (B, black bars) and loaded (white bars) eyes suggesting no axon or myelin injury upon Mn2+ loading. The matched immunohistochemical staining of phosphorylated neurofilament (SMI-31) and myelin basic protein (MBP) strongly support the axonal and myelin sheath integrity seen by in-vivo DTI (C).
T2W Images and H&E Staining of Retina
T2W images acquired from retinas in control and topical-loading mice at day 7 after 1M MnCl2 loading revealed the previously reported dark-bright-dark layer contrast of the control retinas(32,33) (Fig. 4A and B). Significant thinning of the retina was seen in the 1M MnCl2 loaded eyes (Fig. 4C and D). Retinal layers examined by H&E staining showed significant cell swelling (~26 % increased thickness) at day 1 (VA = 0 c/d; the time point of best T1W enhancement) and significant retinal thinning (~31 %) at day 7 (VA = 0 c/d) after 1M MnCl2 loading (Fig. 4E and F). A slight swelling of the retina was seen at day 1 after 0.75M MnCl2 loading with recovery to the normal thickness at day 5 (VA ≥ 0.3 c/d). Retina with saline loading exhibited the same thickness as that reported in the literature for normal mice (Fig. 4E and F).(23,30)
Figure 4.

In-vivo T2-weighted (T2W) imaging was performed to compare the retinal thickness between the saline sham) (A) and MnCl2-loaded (B) eyes. Zoom-in images of mouse retina (C and D) seven days after topical loading of 1M of MnCl2 exhibit typical T2W MRI features of a mouse retina wherein sclera appears dark (white stars), choroid is bright (black arrows), and retinal layers (white double-headed arrows) exhibit intensities between sclera and choroid. Clear thinning in Mn2+ loaded retina was seen 7 days after topical loading in T2W MRI. The hematoxylin and eosin (H&E) staining of the frozen-embedded retina confirmed the MRI detected retinal thinning (E). At 24 hours after 1 M MnCl2 loading, heterogeneous retinal swelling was observed. On day 7 after 1M MnCl2 loading, photoreceptor layers degeneration was visible. 0.75 M MnCl2 loading caused retina slightly swelling at day 1 but recovery at day 5 (E). To quantify the extent of retinal thickness change, H&E images were analyzed (F). A linear model was used to estimate mean retinal thickness on a log scale in each of the 5 study groups. Each of the MnCl2 treated groups was compared with the saline control. P-values for the difference in mean retinal thickness are adjusted for multiple testing using Tukey’s HSD test. One day after 1M MnCl2 loading, transient significant swelling of retina (p < 0.005, with blindness) was seen followed by significant retinal thinning at Day 7 (p < 0.005, with no recovery of visual function). At 0.75M of MnCl2 loading, mild retinal swelling was seen at 1 day (significantly-decreased VA without blindness), which returned to normal thickness 7 days after loading (visual acuity returned to normal by 5–6 days post-loading).
Diamond symbols: mean value
Effect of Intravitreal Injection
Volume Effect
There was no change in VA of eyes receiving intravitreal 0.25-μL saline injection (Fig. 5A). In contrast, VA impairment was seen in eyes at 4 and 24 hours after intravitreal 2-μL saline injection, which recovered at 48 hours (Fig. 5A). Histological examinations revealed significant retinal swelling (~17% increase in thickness) at 24 hours after 2μL-saline injection while no detectable difference was seen in eyes with 0.25-μL saline injection or topical saline loading (Fig. 5C and D).
Figure 5.

The effect of intravitreal Mn2+ injection on retinal integrity and visual function was examined on mouse eyes receiving 0.25 and 2 _L saline injection. The effect of injecting 0.25 and 2 _L on the visual acuity (VA) was examined where 2_L saline injection transiently impaired visual function at 4 hours and Day1 after injection, subsequently recovered (VA ≥ 0.3) at Day 2 (A). The injection of 0.25_L of saline did not impact VA (A). Representative T1W images (B) obtained at 24 hours post-injection with the working dosage (0.25_L and 0.2M MnCl2, 50 nmol) demonstrate the effect of Mn2+− induced intensity enhancement in the loaded visual pathway (left retina, left optic nerve, right LGN, and right SC). The VA was affected by the working dosage at 4 hours post-injection with nearly full recovery by 24 hours post-injection (A). Retinal thickness was examined with H&E staining of frozen-embedded mouse eyes (C and D). The previously reported safe intravitreal 2 _L saline injection caused retinal swelling at Day 2. In contrast, the other reported safe intravitreal saline injection (0.25 _L) indeed did not cause any retinal swelling of the injected eyes (C and D). MnCl2 injection caused slight retinal swelling at 4 hours that recovered at 24 hours post-injection. Histologically-revealed retinal thickening paralleled the decreased VA caused by injection volume and Mn2+ (A).
Diamond symbols: mean value
Dose Effect
Sufficient T1W enhancement in the visual pathway was seen 24 hours after intravitreal injection of 0.25-μL 0.2-M (50 nmol) MnCl2 (Fig. 5B) as previously reported (17). In contrast, we failed to see a detectable T1W enhancement in the visual pathway using the other reported dosage (17), 0.125-μL 0.2-M MnCl2, (25 nmol; data not shown). In the 50 nmol dosage group, histological analysis of retina using H&E staining showed slight cell swelling at 4 hours, which recovered at 24 hours post-injection (Fig. 5C and D).
Discussion
This study investigated the toxicity of noninvasive topical Mn2+ loading using functional (VA) and structural (MR) measurements followed by histological validation. Our findings show that topical MnCl2 loading caused photoreceptor layers degeneration without detectable damage to the optic nerve within the 7-day time course of this investigation. In addition, we also investigated the impact of literature-reported safe dose of intravitreal MnCl2 injection concluding that intravitreal injection causes insignificant visual impairment and is probably safer for MEMRI studies than the newly proposed topical loading.
Topical loading
The route of Mn2+ entry is believed to start from the conjunctiva passing through the ciliary body (34,35). Afterwards, Mn2+ may diffuse into the choroid vasculature passing through the blood-retinal barrier (36) to enter the retinal layers. In addition, Mn2+ may also pass through blood-aqueous barrier diffusing into vitreous space reaching the retina ganglion cell layer (34,37). In our hands, topical loading only resulted in anterior chamber and retina enhancement while the vitreous space was not enhanced. This is consistent with findings by Sun et al. reporting no intravitreal enhancement (21). Although a definitive conclusion may not be established from the current study, the observed lack of vitreous enhancement as well as the preferential photoreceptor layer injury after topical loading suggests that Mn2+ may enter the ocular space primarily through non-corneal permeation across the conjunctiva and sclera into the anterior uvea.
Visual acuity (VA) reflects the visual function and ocular integrity of retinal efferent pathways to subcortical visual structures (25). In the present study, VA was employed to assess the effect of Mn2+ loading since VA of normal mice has been measured consistently (24). Our VA measurements from thirty female C57BL/6 mice were in agreement with Prusky’s finding with less than 10% co-variance (0.37 ± 0.03 c/d; mean ± SD; n = 30). The acute 73% decrease in VA after 0.75 M MnCl2 loading followed by a slow recovery and the total loss of vision after 1 M MnCl2 loading without recovery (throughout the course of experiment) suggests that topical loading adversely affects visual function of the loaded eye as a result of Mn2+ toxicity since there was no VA change after topical saline loading.
With 1M MnCl2 topical loading, the retina thickened at 1 day followed by significant thinning at 7 days after loading [(~31%, p < 0.005); Fig. 4E and F]. Retinal thickening at 24 hours after 1M MnCl2 loading appears to result from cell swelling (23,38), while subsequently decreased retinal thickness is likely the result of may be related to retinal degeneration and tissue loss. There was a negligible retinal thickness change by 0.75M topical loading (Fig. 4F). The increased image intensity of choroid (Fig. 4D) probably resulted from manganese accumulation in endothelial cells (39).
Photoreceptor layer degeneration was seen in H & E staining (Fig. 4E), suggesting that the entry of excess calcium analog, Mn2+, could cause metabolic dysfunction and eventual photoreceptor cell loss (18). At day 1 with 1-M MnCl2 loading, retina thickened variably (Fig. 4E) due to differential uptake of topically loaded Mn2+ between mice. Our T2W images exhibited strong vitreous signal intensities (Fig. 3A – D), potentially confounding layer thickness estimation although retinal swelling and thinning was clearly visible in T2W images. A balanced steady state free precession (bSSFP) MR sequence has been demonstrated to be time-efficient to detect retinal layer and layer-specific responses to hypoxia in retinal and choroidal vasculature, which are separated by an avascular region (40). This approach could be used to overcome the shortcoming of T2W measurement employed herein to better assess retinal thickness. The optic nerve integrity was examined using in vivo DTI followed by immunohistochemistry (Fig. 3B, 3C). In order to minimize partial volume effect, DTI was performed at prechiasmatic optic nerves. Normal axial (λ||) and radial (λ⊥) diffusivities after MnCl2 loading suggest axonal integrity of the loaded prechiasmatic optic nerve (31). Postmortem immunohistochemistry findings supported the conclusions drawn from in vivo DTI measurements. There was no detectable injury in either RGC layer (Fig. 4E) or prechiasmatic optic nerve (Fig. 3B and C). The visual function impairment is more pronounced with increasing retinal morphological distortions—initially retinal swelling (Fig. 2, 4E, and 4F) and subsequently photoreceptor loss and thinning of the retina. Topical saline loading did not cause retinal thickness change, or VA impairment. The results suggest that Mn2+ was the primary cause of the decreased VA and reduced retinal thickness.
Intravitreal injection
Intravitreal injection of MnCl2 is a common practice for MEMRI studies. Published reports have examined toxicity of intravitreal injection of MnCl2 in mice and rats (17–19,41). Bearer et al. used visual evoke potential (VEP) to assess visual function (17) reporting that 0.5μL of saline injection affected VEP response. They suggested a 0.25μL injection of 200mM MnCl2 (equivalent of 50 nmol) to be the safe dose for MEMRI studies in C57BL/6 mice. Haenold et al. measured VA to determine visual function suggesting that 2μL of 0.0075M MnCl2 (equal to 15 nmol) as the safe dose for the same mouse strain (18). They found that 50 nmol caused photoreceptor degeneration with RGC injury observed at a dose over 50 nmol.
The volume of the vitreous space in C57BL/6 mice is approximately 5 μL. Chen et al. have previously reported that 0.5 μL of intravitreal saline injection was safe (23). Haenold et al. reported normal VA two days after 2 μL of saline injection (18). The current finding saw transient impairment of VA with 2 μL of saline injection (Fig. 5A). The recovery of VA 2 days after injecting 2 μL of saline was in agreement with that seen by Haenold et al. A significant retinal swelling was observed with 2 μL saline injection in the present study (Fig. 5C and D) while 0.25μL saline injection did not impact VA (Fig. 5A) or retinal thickness (Fig. 5C and D) at any time point. Our findings support the conclusion of Bearer et al. suggesting the optimum dose for intravitreal injection is 0.25 μL of 200 mM MnCl2. We failed to see enhancement using the dose proposed by Bearer et al., 0.125 μL of 200 mM MnCl2 (data not shown).
In conclusion, we found that both topical loading and intravitreal injection of MnCl2 provided similar T1W enhancement in the visual system for assessing anterograde axonal transport. Despite the non-invasive nature of MnCl2 loading, topical loading significantly impaired VA. The photoreceptor layer was significantly injured with retinal ganglion cells largely unaffected thus no detectable injury in the optic nerve. The working concentration of 0.75 M MnCl2 offers sufficient enhancement for assessing axonal transport. However, the visual function was still affected at this dose thus cautioning functional correlation studies using topical loading. In contrast, the previously reported safe dose for intravitreal injection proposed by Bearer et al. is ideal for axonal transport correlating with functional assessment in mouse visual system.
Acknowledgments
The authors would like to thank Dr. Junjie Chen for the invaluable discussions.
Grant
This study was supported in part by the grants from National Institute of Health R01-NS047592 (S.-K.S.), National Multiple Sclerosis Society (NMSS) RG 4549A4/1 (S.-K.S.), and Department of Defense Ideal Award W81XWH-12-1-0457.
References
- 1.Smith KD, Kallhoff V, Zheng H, Pautler RG. In vivo axonal transport rates decrease in a mouse model of Alzheimer’s disease. Neuroimage. 2007;35(4):1401–1408. doi: 10.1016/j.neuroimage.2007.01.046. [DOI] [PMC free article] [PubMed] [Google Scholar]
- 2.Silva AC, Lee JH, Aoki I, Koretsky AP. Manganese-enhanced magnetic resonance imaging (MEMRI): methodological and practical considerations. NMR Biomed. 2004;17(8):532–543. doi: 10.1002/nbm.945. [DOI] [PubMed] [Google Scholar]
- 3.Thuen M, Singstad TE, Pedersen TB, Haraldseth O, Berry M, Sandvig A, Brekken C. Manganese-enhanced MRI of the optic visual pathway and optic nerve injury in adult rats. Journal of magnetic resonance imaging : JMRI. 2005;22(4):492–500. doi: 10.1002/jmri.20400. [DOI] [PubMed] [Google Scholar]
- 4.Boretius S, Gadjanski I, Demmer I, Bahr M, Diem R, Michaelis T, Frahm J. MRI of optic neuritis in a rat model. Neuroimage. 2008;41(2):323–334. doi: 10.1016/j.neuroimage.2008.02.021. [DOI] [PubMed] [Google Scholar]
- 5.Gadjanski I, Boretius S, Williams SK, Lingor P, Knoferle J, Sattler MB, Fairless R, Hochmeister S, Suhs KW, Michaelis T, Frahm J, Storch MK, Bahr M, Diem R. Role of n-type voltage-dependent calcium channels in autoimmune optic neuritis. Annals of neurology. 2009;66(1):81–93. doi: 10.1002/ana.21668. [DOI] [PubMed] [Google Scholar]
- 6.Thuen M, Olsen O, Berry M, Pedersen TB, Kristoffersen A, Haraldseth O, Sandvig A, Brekken C. Combination of Mn(2+)-enhanced and diffusion tensor MR imaging gives complementary information about injury and regeneration in the adult rat optic nerve. Journal of magnetic resonance imaging : JMRI. 2009;29(1):39–51. doi: 10.1002/jmri.21606. [DOI] [PubMed] [Google Scholar]
- 7.Thuen M, Singstad TE, Pedersen TB, Haraldseth O, Berry M, Sandvig A, Brekken C. Manganese-enhanced MRI of the optic visual pathway and optic nerve injury in adult rats. Journal of magnetic resonance imaging : JMRI. 2005;22(4):492–500. doi: 10.1002/jmri.20400. [DOI] [PubMed] [Google Scholar]
- 8.Ryu S, Brown SL, Kolozsvary A, Ewing JR, Kim JH. Noninvasive detection of radiation-induced optic neuropathy by manganese-enhanced MRI. Radiation research. 2002;157(5):500–505. doi: 10.1667/0033-7587(2002)157[0500:ndorio]2.0.co;2. [DOI] [PubMed] [Google Scholar]
- 9.Chan KC, Fu QL, Hui ES, So KF, Wu EX. Evaluation of the retina and optic nerve in a rat model of chronic glaucoma using in vivo manganese-enhanced magnetic resonance imaging. Neuroimage. 2008;40(3):1166–1174. doi: 10.1016/j.neuroimage.2008.01.002. [DOI] [PubMed] [Google Scholar]
- 10.Chan KC, Li J, Kau P, Zhou IY, Cheung MM, Lau C, Yang J, So KF, Wu EX. In vivo retinotopic mapping of superior colliculus using manganese-enhanced magnetic resonance imaging. Neuroimage. 2011;54(1):389–395. doi: 10.1016/j.neuroimage.2010.07.015. [DOI] [PubMed] [Google Scholar]
- 11.De La Garza BH, Li G, Shih YY, Duong TQ. Layer-specific manganese-enhanced MRI of the retina in light and dark adaptation. Investigative ophthalmology & visual science. 2012;53(8):4352–4358. doi: 10.1167/iovs.11-8826. [DOI] [PMC free article] [PubMed] [Google Scholar]
- 12.Berkowitz BA, Roberts R, Goebel DJ, Luan H. Noninvasive and simultaneous imaging of layer-specific retinal functional adaptation by manganese-enhanced MRI. Investigative ophthalmology & visual science. 2006;47(6):2668–2674. doi: 10.1167/iovs.05-1588. [DOI] [PubMed] [Google Scholar]
- 13.Bissig D, Berkowitz BA. Manganese-enhanced MRI of layer-specific activity in the visual cortex from awake and free-moving rats. Neuroimage. 2009;44(3):627–635. doi: 10.1016/j.neuroimage.2008.10.013. [DOI] [PMC free article] [PubMed] [Google Scholar]
- 14.Chan KC, Cheng JS, Fan S, Zhou IY, Yang J, Wu EX. In vivo evaluation of retinal and callosal projections in early postnatal development and plasticity using manganese-enhanced MRI and diffusion tensor imaging. Neuroimage. 2012;59(3):2274–2283. doi: 10.1016/j.neuroimage.2011.09.055. [DOI] [PubMed] [Google Scholar]
- 15.Olanow CW. Manganese-induced parkinsonism and Parkinson’s disease. Annals of the New York Academy of Sciences. 2004;1012:209–223. doi: 10.1196/annals.1306.018. [DOI] [PubMed] [Google Scholar]
- 16.Silva AC, Bock NA. Manganese-enhanced MRI: an exceptional tool in translational neuroimaging. Schizophrenia bulletin. 2008;34(4):595–604. doi: 10.1093/schbul/sbn056. [DOI] [PMC free article] [PubMed] [Google Scholar]
- 17.Bearer EL, Falzone TL, Zhang X, Biris O, Rasin A, Jacobs RE. Role of neuronal activity and kinesin on tract tracing by manganese-enhanced MRI (MEMRI) NeuroImage. 2007;37 (Suppl 1):S37–46. doi: 10.1016/j.neuroimage.2007.04.053. [DOI] [PMC free article] [PubMed] [Google Scholar]
- 18.Haenold R, Herrmann KH, Schmidt S, Reichenbach JR, Schmidt KF, Lowel S, Witte OW, Weih F, Kretz A. Magnetic resonance imaging of the mouse visual pathway for in vivo studies of degeneration and regeneration in the CNS. NeuroImage. 2012;59(1):363–376. doi: 10.1016/j.neuroimage.2011.07.069. [DOI] [PubMed] [Google Scholar]
- 19.Luo L, Xu H, Li Y, Du Z, Sun X, Ma Z, Hu Y. Manganese-enhanced MRI optic nerve tracking: effect of intravitreal manganese dose on retinal toxicity. NMR Biomed. 2012 doi: 10.1002/nbm.2808. [DOI] [PubMed] [Google Scholar]
- 20.Lindsey JD, Grob SR, Scadeng M, Duong-Polk K, Weinreb RN. Ocular integrity following manganese labeling of the visual system for MRI. Magnetic resonance imaging. 2013 doi: 10.1016/j.mri.2012.11.012. [DOI] [PubMed] [Google Scholar]
- 21.Sun SW, Campbell B, Lunderville C, Won E, Liang HF. Noninvasive topical loading for manganese-enhanced MRI of the mouse visual system. Investigative ophthalmology & visual science. 2011;52(6):3914–3920. doi: 10.1167/iovs.10-6363. [DOI] [PMC free article] [PubMed] [Google Scholar]
- 22.Sun SW, Thiel T, Liang HF. Impact of repeated topical-loaded manganese-enhanced MRI on the mouse visual system. Investigative ophthalmology & visual science. 2012;53(8):4699–4709. doi: 10.1167/iovs.12-9715. [DOI] [PMC free article] [PubMed] [Google Scholar]
- 23.Chen J, Chiang CW, Zhang H, Song SK. Cell swelling contributes to thickening of low-dose N-methyl-D-aspartate-induced retinal edema. Investigative ophthalmology & visual science. 2012;53(6):2777–2785. doi: 10.1167/iovs.11-8827. [DOI] [PMC free article] [PubMed] [Google Scholar]
- 24.Prusky GT, Alam NM, Beekman S, Douglas RM. Rapid quantification of adult and developing mouse spatial vision using a virtual optomotor system. Investigative ophthalmology & visual science. 2004;45(12):4611–4616. doi: 10.1167/iovs.04-0541. [DOI] [PubMed] [Google Scholar]
- 25.Douglas RM, Alam NM, Silver BD, McGill TJ, Tschetter WW, Prusky GT. Independent visual threshold measurements in the two eyes of freely moving rats and mice using a virtual-reality optokinetic system. Vis Neurosci. 2005;22(5):677–684. doi: 10.1017/S0952523805225166. [DOI] [PubMed] [Google Scholar]
- 26.Garbow JR, Mcintosh C, Conradi MS. Actively decoupled transmit-receive coil-pair for mouse brain MRI. Concept Magn Reson B. 2008;33B(4):252–259. doi: 10.1002/cmr.b.20124. [DOI] [PMC free article] [PubMed] [Google Scholar]
- 27.Spees WM, Lin TH, Song SK. White-matter diffusion fMRI of mouse optic nerve. Neuroimage. 2013;65:209–215. doi: 10.1016/j.neuroimage.2012.10.021. [DOI] [PMC free article] [PubMed] [Google Scholar]
- 28.Tu TW, Budde MD, Quirk JD, Song SK. Using absorption-mode images to improve in vivo DTI quality. Proc Intl Soc Mag Reson Med. 2010;18:4001. [Google Scholar]
- 29.Blewitt ES, Pogmore T, Talbot IC. Double embedding in agar/paraffin wax as an aid to orientation of mucosal biopsies. J Clin Pathol. 1982;35(3):365. doi: 10.1136/jcp.35.3.365-b. [DOI] [PMC free article] [PubMed] [Google Scholar]
- 30.Chen J, Wang Q, Zhang H, Yang X, Wang J, Berkowitz BA, Wickline SA, Song SK. In vivo quantification of T1, T2, and apparent diffusion coefficient in the mouse retina at 11. 74T. Magn Reson Med. 2008;59(4):731–738. doi: 10.1002/mrm.21570. [DOI] [PubMed] [Google Scholar]
- 31.Song SK, Sun SW, Ju WK, Lin SJ, Cross AH, Neufeld AH. Diffusion tensor imaging detects and differentiates axon and myelin degeneration in mouse optic nerve after retinal ischemia. NeuroImage. 2003;20(3):1714–1722. doi: 10.1016/j.neuroimage.2003.07.005. [DOI] [PubMed] [Google Scholar]
- 32.Duong TQ, Pardue MT, Thule PM, Olson DE, Cheng H, Nair G, Li Y, Kim M, Zhang X, Shen Q. Layer-specific anatomical, physiological and functional MRI of the retina. NMR Biomed. 2008;21(9):978–996. doi: 10.1002/nbm.1311. [DOI] [PMC free article] [PubMed] [Google Scholar]
- 33.Wang Q, Song SK, Zhang H, Berkowitz BA, Chen S, Wickline SA, Chen J. Photoreceptor degeneration changes magnetic resonance imaging features in a mouse model of retinitis pigmentosa. Magn Reson Med. 2011;65(6):1793–1798. doi: 10.1002/mrm.22751. [DOI] [PMC free article] [PubMed] [Google Scholar]
- 34.Diebold Y, Calonge M. Applications of nanoparticles in ophthalmology. Prog Retin Eye Res. 2010;29(6):596–609. doi: 10.1016/j.preteyeres.2010.08.002. [DOI] [PubMed] [Google Scholar]
- 35.Molokhia SA, Jeong EK, Higuchi WI, Li SK. Examination of penetration routes and distribution of ionic permeants during and after transscleral iontophoresis with magnetic resonance imaging. International journal of pharmaceutics. 2007;335(1–2):46–53. doi: 10.1016/j.ijpharm.2006.11.001. [DOI] [PMC free article] [PubMed] [Google Scholar]
- 36.Morrison JC, Johnson EC, Cepurna WO, Funk RH. Microvasculature of the rat optic nerve head. Investigative ophthalmology & visual science. 1999;40(8):1702–1709. [PubMed] [Google Scholar]
- 37.Lindsey JD, Scadeng M, Dubowitz DJ, Crowston JG, Weinreb RN. Magnetic resonance imaging of the visual system in vivo: transsynaptic illumination of V1 and V2 visual cortex. NeuroImage. 2007;34(4):1619–1626. doi: 10.1016/j.neuroimage.2006.07.048. [DOI] [PubMed] [Google Scholar]
- 38.Berkowitz BA, Bissig D, Ye Y, Valsadia P, Kern TS, Roberts R. Evidence for diffuse central retinal edema in vivo in diabetic male Sprague Dawley rats. PloS one. 2012;7(1):e29619. doi: 10.1371/journal.pone.0029619. [DOI] [PMC free article] [PubMed] [Google Scholar]
- 39.Nair G, Pardue MT, Kim M, Duong TQ. Manganese-enhanced MRI reveals multiple cellular and vascular layers in normal and degenerated retinas. Journal of magnetic resonance imaging : JMRI. 2011;34(6):1422–1429. doi: 10.1002/jmri.22719. [DOI] [PMC free article] [PubMed] [Google Scholar]
- 40.Muir ER, Duong TQ. Layer-specific functional and anatomical MRI of the retina with passband balanced SSFP. Magn Reson Med. 2011;66(5):1416–1421. doi: 10.1002/mrm.22935. [DOI] [PMC free article] [PubMed] [Google Scholar]
- 41.Thuen M, Berry M, Pedersen TB, Goa PE, Summerfield M, Haraldseth O, Sandvig A, Brekken C. Manganese-enhanced MRI of the rat visual pathway: acute neural toxicity, contrast enhancement, axon resolution, axonal transport, and clearance of Mn(2+) Journal of magnetic resonance imaging : JMRI. 2008;28(4):855–865. doi: 10.1002/jmri.21504. [DOI] [PubMed] [Google Scholar]