

Abstract
Detecting blood vessels is a vital task in retinal image analysis. The task is more challenging with the presence of bright and dark lesions in retinal images. Here, a method is proposed to detect vessels in both normal and abnormal retinal fundus images based on their linear features. First, the negative impact of bright lesions is reduced by using K-means segmentation in a perceptive space. Then, a multi-scale line operator is utilized to detect vessels while ignoring some of the dark lesions, which have intensity structures different from the line-shaped vessels in the retina. The proposed algorithm is tested on two publicly available STARE and DRIVE databases. The performance of the method is measured by calculating the area under the receiver operating characteristic curve and the segmentation accuracy. The proposed method achieves 0.9483 and 0.9387 localization accuracy against STARE and DRIVE respectively.
Keywords: K-means segmentation, linear structure, perceptive transform, retina image, retinal vessel segmentation
INTRODUCTION
The blood vessels network is one of the most important features in the retina for detecting retinal vein occlusion, for grading the tortuosity for hypertension and for early diagnosis of glaucoma. There is also several vascular diseases, like diabetic retinopathy, have manifestations that require analysis of the vessels network. The segmentation of blood vessels is also an important pre-processing step for the detection of bright and dark lesions, the performance of automatic detection methods may be improved if regions containing vessels can be excluded from the analysis. Indeed, the position, size and shape of the vessels provide information which can be used to locate the optic disk and the fovea.[1,2] Figure 1 shows a normal retinal fundus image.
Figure 1.
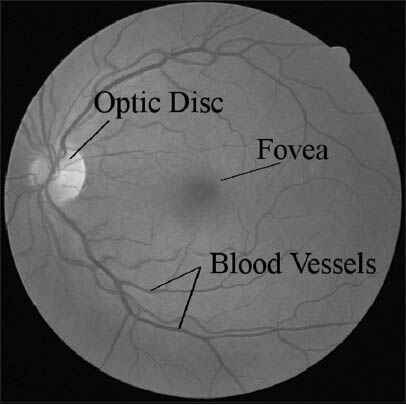
A normal retinal image from DRIVE database shows retina components
Most existing blood vessel segmentation algorithms assume that the input retina is healthy and free of bright and dark lesions. The presence of lesions can significantly degrade their performances and even make them useless.[2] In addition, it is important to have algorithms that do not critically depend on configuring many parameters so that untrained community health workers may utilize this technology.[1]
Previous works on blood vessel detection and segmentation can be mainly classified into three categories: Unsupervised, supervised learning and pathological retina based methods.
The approaches based on unsupervised classification attempt to find inherent patterns of blood vessels in retinal images that can then be used to determine that a particular pixel belongs to the vessel or not. The training data or hand labeled ground truths do not contribute directly to the design of the algorithm in these approaches.[3]
A template matching approach is proposed to approximate the gray-level profile of the cross section of a blood vessel with an inverse Gaussian shaped curve.[4] The above method is enhanced by applying effective noise removal techniques.[5] An adaptive thresholding technique is proposed which partitions the input image into a finite number of levels according to pixel intensities.[6] In each level, the vessels are extracted using the intensity, angle and length information based on a predefined elongated concave structure. The fitness of estimating vessel profiles with Gaussian function is evaluated and an amplitude-modified second-order Gaussian filter is proposed for the detection and measurement of vessels.[7] A vessel segmentation method which is based on the linear combination of line detectors at varying scales is proposed.[8] The method works well on healthy retinal images even in the presence of vessel central reflex. However, it tends to produce false vessel detection around the optic disk and pathological regions such as bright lesions.
In supervised methods, the rule for vessel extraction is learned by the algorithm on the basis of a training set of manually processed and segmented reference images often termed as the ground truth.[3] In a ridge based vessel segmentation methodology[9] 27 local features are extracted for every pixel. A K-nearest-neighbors classifier is used for classification. The method yields very good results on healthy retinal images. However, many of the features require a high degree of smoothness in the non-vessel region. If a bright lesion is present, the steep intensity transition pattern of the lesion will also be treated as vessels, producing a large number of artifacts. A Gabor feature based supervised learning method for vessel segmentation is used.[10] They adopted the Gabor features which consider the low frequency elongated structure in the intensity profile of the retinal vessels in the training process. The application of line operators as a feature vector and support vector machine (SVM) for pixel classification is proposed.[11] A line detector which is based on the evaluation of the average gray level along lines of fixed length passing through the target pixel at different orientations is applied to the green channel of an RGB image and the response is thresholded to obtain unsupervised pixel classification. Moreover, two orthogonal line detectors are also employed along with the gray level of the target pixel to construct a feature vector for supervised classification using a SVM.[3] These methods detect vessels in normal retina images well, but they don’t have any procedure to cope with lesions on images of abnormal retinas.
Pathological retina based methods are the only class in which pathology in retinas is considered during vessel detection procedure. There are few publications in this category. The authors adopted different color space for different retinal images and used the L*a*b color space to handle bright lesions.[12] Their method produces better results on the pathological retina than most of the existing algorithms. A divergence vector field approach is proposed to handle the bright lesions by measuring the smoothness of the non-vessel regions in different orientations.[13] Although the method can handle bright lesions, a thresholding technique is needed for artifacts removal. A large threshold leads to more artifacts removal near the bright lesions but also results in many normal vessels being incorrectly removed. The algorithm presented[2] is based on regularization based multi-concavity modeling and is able to handle bright and dark lesions in retinal images simultaneously. The steep intensity transition pattern of bright lesions is distinguished from vessels with differential concavity measures. A line shape concavity measure is used to distinguish the irregular shape intensity structure of dark lesions from the line shape intensity structure of the blood vessel. A locally normalized concavity measure is used to filter out the noise. Finally, the features obtained from these concavity measures are combined according to their statistical and geometrical properties and later a lifting technique is used for optimizing the regularized solution toward the ideal vessel shape.
In this paper, we propose an effective automated algorithm that is able to detect vessels in both normal and pathological retinal images.
Two different steps, i.e., a pre-processing step based on K-means segmentation (clustering) and a multi-scale line detection using line operator are involved. The first step reduces the negative impact of bright lesions and makes vessels more distinguishable from non-vessels. Then, a line operator in three scales is used to detect vessels. As dark lesions have an irregular shape intensity structure while blood vessels have a line-shape intensity structure, most of the dark lesions will be ignored in this step. A perceptive transform using Weber's law,[2] is also used to model human visual perception in retinal image analysis. Figure 2 summarizes the details of the proposed method.
Figure 2.
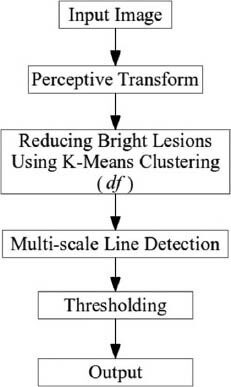
Details of the proposed method
The rest of the paper is organized as follows. Section II describes the properties of images that are used, the perceptive transform using Weber's law and the pre-processing steps including borders extending method and the proposed approach for reducing bright lesions using K-means algorithm. The multi-scale line operator algorithm for vessel segmentation is also presented in the last part of this section. The experimental results are presented in Section III followed by our discussion in Section IV. The paper is concluded in Section V.
METHODS
Image Databases
The effectiveness and robustness of the proposed method are evaluated on two publicly available databases (STARE and DRIVE) and are compared with the state-of-the-art methods. The STARE database contains 20 images with 10 pathological and 10 normal retinal images. The retinal images in DRIVE databases are mainly healthy with some of them containing a few mild lesions. Both databases provide two ground truths manually marked by two independent observers. All the results presented in this paper are obtained by using the first human observer in the database as ground truth.[2]
Green Channel of Image and Borders Extending
The green channel of the retinal fundus image is used as the input of the method as it provides a reasonable contrast between the vessels and the background.
To reduce the artifacts produced near the border of the camera aperture by a segmentation method, a border extension preprocessing technique[10] is utilized. The border extended images are used within the line detection process to reduce the similarity of the retina borders to linear structures. To have a neat presentation of the method results the final images are shown without the added regions and only the FOV of the images are shown. A typical sample of extended images is shown in Figure 3.
Figure 3.
The result of the border extending method
Perceptive Transform
A perceptive transform derived from Weber's law is proposed to map an input image into a perceptive space for robust vessel segmentation.[2] Their results show that system performance is consistently better in the perceptive space than in the image space, demonstrating the broader effectiveness of the proposed perceptive space method.
Weber examined the relationship between the physical intensity magnitude and its perceptive intensity. Study of contrast sensitivity of the human eye shows that human suprathreshold contrast sensitivity (perception) follows the Weber's Law and hence, increases proportionally with the increase in the mean local luminance.[14] To obtain a perceptive intensity, a transform on image based on Weber's law is formulated. The equation transforming the input image I0 to perceptive image v0 can be expressed as:[2]
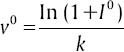
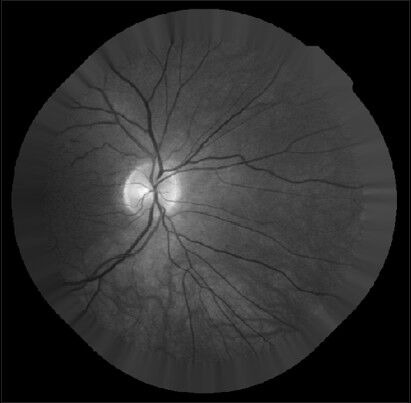
where k is a constant and is taken to be one in our experiments. Figure 4 shows a typical retina image and its corresponding transformation.
Figure 4.
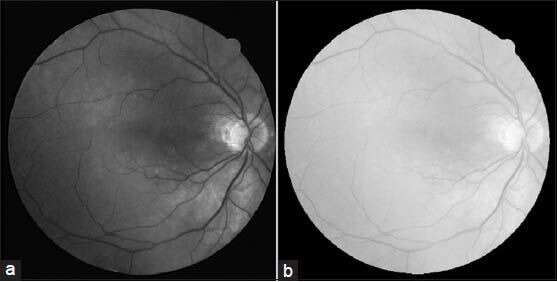
Transforming to weber space. (a) Green channel of the input image. (b) The result of weber transforms
Reducing Bright Lesions Based on K-means Clustering
The non-smooth bright lesions having a steep intensity transition pattern can be wrongly classified as vessels. Due to the steep intensity transition pattern of the bright lesions, the method falsely classifies the non-smooth pixels as vessels and a ringing effect is produced in the lesion regions.[2] The result of applying the multi-scale line detection method on an image with bright lesions is shown in Figure 5.
Figure 5.
Vessel segmentation result using the multi-scale line detection method without reducing bright lesions
In this step our purpose is to reduce the presence of the bright lesions based on the individual image information hence that the basic structures of the original image remain unchanged.
According to the intensities of different parts of a retinal image over the field of view (FOV), the pixels of the image can be categorized into three clusters, background, foreground and vessel. In retinal image analysis, FOV is defined as the circular retinal region located in the middle of a rectangular image. Here, background is defined as the regions whose pixels are not on vessels, lesions and the optic disc. These pixels are darker than the bright lesions and the optic disc and are brighter than normal vessels. In this categorization, optic disc and bright lesions are assumed as foreground regions. K-means algorithm is applied to partition the pixels into three clusters.
Here, we inspired from[15] and the steps involved in the K-means algorithm are as follows.
Step 1: Choose the number of clusters (three as discussed above) and find the initial value for each cluster centroid cv (0), cb (0) and cf (0), where cv, cb and cf are the centroids of the clusters associated with the blood vessels, background and foreground of the FOV of the retinal image respectively.

Here, m and σ are the mean and standard deviation of the intensity matrix, respectively.
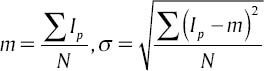
where Ip is the intensity of pixel p and N is the number of pixels in FOV.
Step 2: Calculate the distance of each pixel from the class centroid and group pixels into k (in our case k is 3) clusters based on the minimal distance from the centroid.
Step 3: Calculate the new centroid for each cluster using
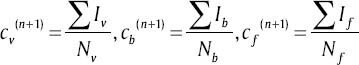
Where Iv, Ib and If are the three clusters (pixel groups) containing pixel values of the vessels, background and the foreground clusters, respectively. Nv, Nb and Nf are the size of the vessels, background and the foreground clusters.
Step 4: If any of the centroids change their value, put n = n + 1 and go back to step 2, otherwise go to step 5.
Step 5: End.
After the clustering process, we use the final cf (the centroid of foreground pixels) to reduce the effects of the bright lesions as follows:
dfp = cf − Ip
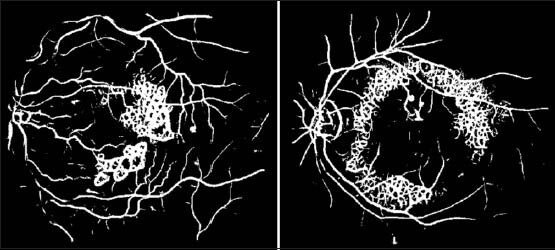
Here, Ip is the intensity of the pixel p in the perceptive image and dfp (difference from the centroid of the foreground cluster) is the value of p in the new plane df [Figure 6]. Since cf is the centroid for the cluster of the foregrounds, it is the best estimation for the intensity of the bright pixels. So, if p is a vessel pixel, which is usually darker than other parts, dfp will be almost a high value; otherwise if it is a background or bright pixel, this value will be lower. This also reduces the high difference between the intensities of the pixels of regions with bright lesions, which makes them similar to noise.
Figure 6.
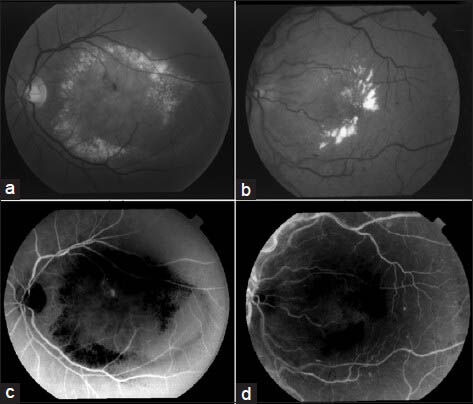
The result of the proposed method for reducing the bright lesions. (a and b) Two typical pathological images from STARE. (c and d) The plane df of (a) and (b) respectively
In the next section we discuss how line-shaped structures are detected in this new plane (df) using a multi-scale line operator.
Vessel Detection with Multi-scale Line Operator
Having removed the bright lesions now for detecting vessels, which have line-shaped structures, while ignoring some of the dark lesions having irregular structures, a line detection method using a line operator in three scales are used.
The performance of several different approaches to the detection of linear structures in mammographic images is compared.[16] Results obtained using synthetic data showed that the line operator produces the best S/N, localization, orientation and width results. Here, we utilized this method for detecting line-shaped vessels in retinal images. The principle of this method is illustrated in Figure 7.
Figure 7.
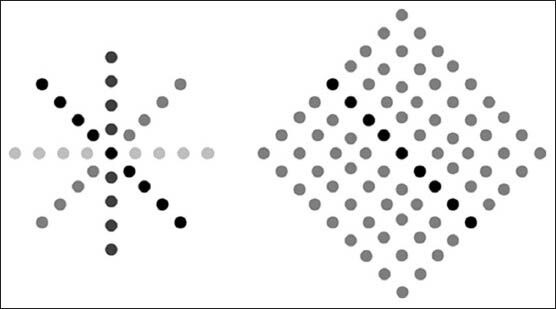
Operation of the line operator. (Left) Average intensity, L (indicated by the various shades of gray), is determined for a number of orientations. (Right) Line strength, S, is obtained as the difference between the maximum value of L (dark-gray shaded points) and the average intensity, N, of a square region aligned with the direction of maximum N (light-gray shaded points)
The average gray-level, L, of the pixels lying on a line passing through the target pixel is calculated for multiple orientations and the orientation giving the largest value, L, is chosen. The line-strength is given by S = L − N, where N is the average gray-level of a similarly oriented square neighborhood. Line and region averages at arbitrary orientations are obtained by convolution with kernels that compound the effects of bi-linear interpolation, sampling and averaging. Indeed, in the formula of the basic line operator, S = L − N, when the line is on a curveted structure S takes a high value; otherwise it takes a value close to zero.
Windows for detecting lines with angles 0 and 45° are illustrated in Figure 8.
Figure 8.

Lines of 15 pixels with orientation: (left) 0°, (right) 45°
Choosing one particular scale for the line operator to detect vessels is a parameter adjusting issue and with a small change in the scale of the image, a fixed size operator may be completely useless. If the size of the scale selected for the line is smaller than the width of the vessels, the whole block of the operator will be placed in the vessel boundaries and the values of L and N will be very close to each other which lead to a small line strength like in the background regions. Therefore, here we used the multi-scale approach, first, to avoid the parameter adjusting problem, second, to be assured that none of the blood vessel pixels is ignored.
In our multi-scale methodology, we applied three line operators with lines of lengths 5, 11 and 15 pixels at 12 different orientations. The final value for each pixel computed as the maximum among the three values have been assigned to that pixel by the line operator in each of the three scales. Final thresholding will be applied on these values.
For the final evaluation we need a binary image, in which 1's are vessel pixels and 0's are non-vessel pixels. The final segmentation is done by thresholding with a threshold value which is experimentally chosen from the resulting ROC curves in such a way that the average false positive rate (FPR) value becomes equal to 0.02.
RESULTS
Performance Measures
To evaluate the effectiveness of the proposed method receiver operating characteristics (ROC) curve and accuracy are measured. The accuracy is defined by the ratio of the total number of correctly classified pixels (sum of true positives and true negatives) to the number of pixels in the image FOV. A ROC curve plots the fraction of vessel pixels correctly classified as vessel, namely the true positive rate (TPR), versus the fraction of non-vessel pixels wrongly classified as vessel, namely the FPR. The closer the curve approaches the top left corner; the better is the performance of the system. The most frequently used performance measure extracted from the ROC curve is the value of the area under the curve (AUC) which is 1 for an optimal system. For retinal images, the TPR and FPR are computed considering only pixels inside the FOV.[2]
RESULTS
Figure 9 illustrates a qualitative result of applying the blood vessel segmentation method on pathological retina images from STARE databases. As it can be seen, in addition to detection of the blood vessels, the method has ignored most of the image's bright lesions with a good accuracy.
Figure 9.
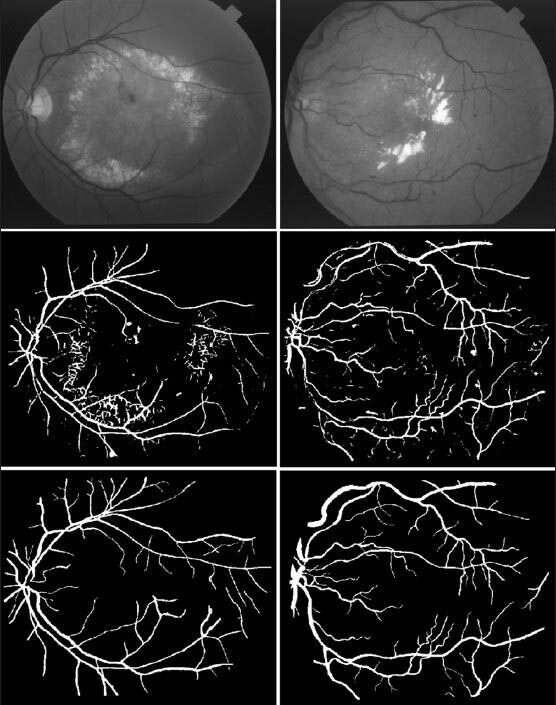
Segmentation results for pathological images from STARE database. (First row) Abnormal retina images with lesions. (Second row) Segmentation results. (Third row) Manual segmentation
Although the basic work carried out in this research was based on reducing the bright lesions, but as we said line operator can ignore some irregular shaped dark lesions. Figure 10 is also presented to show the performance of the proposed method on the retinal images with dark lesions. As it can be seen some of the dark lesions are partly removed. However, some of the isolated and fully connected false positive dark lesions remained.
Figure 10.
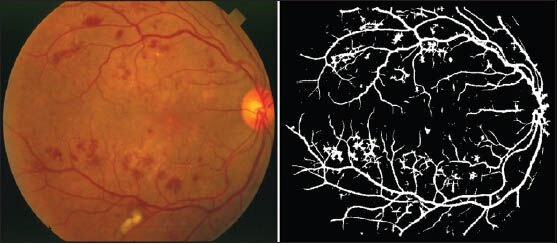
A sample of segmentation result for a pathological image from STARE database with dark lesions
Tables 1–3 present the results of the proposed method together with the state-of-the-art methods applied to the whole STARE database, the whole DRIVE database and the abnormal images in the STARE database. The results are in term of accuracy of the method and the area under the ROC curve (AUC). The works that their results are presented in the tables are introduced in Section I.
Table 1.
Results on the whole STARE database
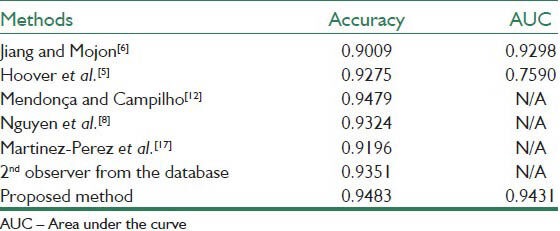
Table 3.
Results on the pathological images of STARE
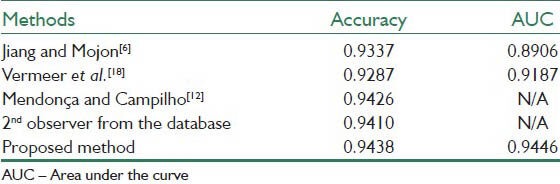
Table 1 demonstrates the results on the whole STARE database. As is evident, the AUC for our method reached a value 0.9431 with the accuracy of 0.9483, which are highly comparable to and sometimes higher than the previously reported values.
Table 2 shows the results on the whole DRIVE database. Here, the AUC and accuracy of the proposed method are 0.9303 and 0.9387 respectively.
Table 2.
Results on the whole DRIVE database
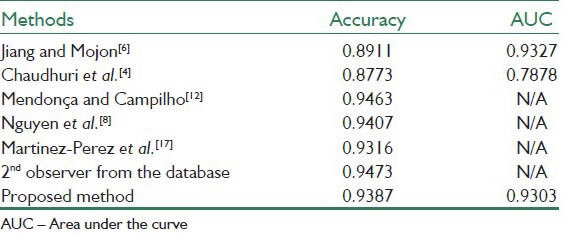
Table 3 shows the results of applying the proposed method only on the abnormal images of the STARE database. As it can be seen, the proposed method achieved high performance of AUC equal to 0.9438 and accuracy equal to 0.9446 which are significantly close to the best results of other methods.
Figures 11–13 shows the related ROC curve for each group of images.
Figure 11.
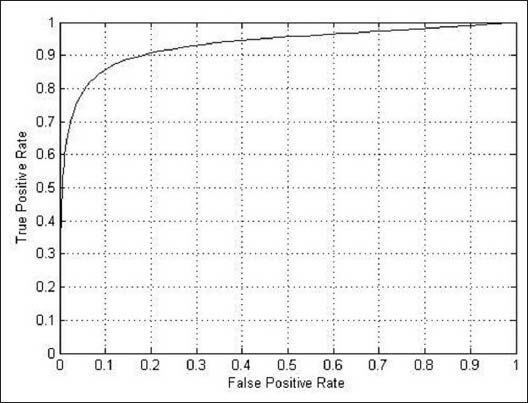
The receiver operating characteristic curve obtained by the proposed method on the whole STARE database
Figure 13.

The receiver operating characteristic curve obtained by the proposed method on the pathological retinal images in the STARE database
Figure 12.
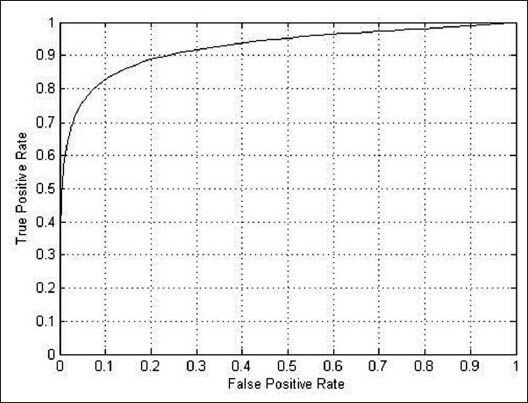
The receiver operating characteristic curve obtained by the proposed method on the whole DRIVE database
To summarize the results, it's evident that the performance of the proposed method, despite its simplicity, is comparable to or sometimes better than some of the existing segmentation methods considering both AUC and accuracy. In addition, it can be seen that the performances of the method for both databases and also normal and abnormal images are close to each other, which shows that the proposed unsupervised approach operates consistently in different situations.
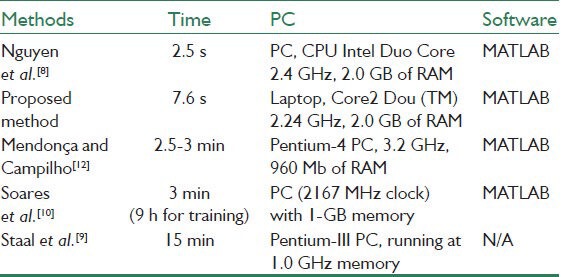
Table 4 represents the running time of our proposed method along with several already proposed methods. It is evident that our approach is efficient due to the fast segmentation time with an average of 7.6 s for all images in STARE and DRIVE datasets.
Table 4.
Running time for different methods
DISCUSSION
The proposed method is tested on both DRIVE and STARE image datasets and also on abnormal images of STARE. The results show that its performance is highly efficient in comparison with other methods in term of accuracy and the AUC.
In comparison with the work,[8] where also a multi-scale line detection approach is used, the accuracy of the proposed method is higher for STARE dataset and is slightly lower for DRIVE dataset (AUC is not reported in).[8] The running time of our method is also slightly more. But, the advantage of the proposed method is that, here we use the multi-scale line detection approach after reducing the bright lesions. This decreases the false vessel detection which may be produced around these regions. In our method we also applied the line operator only in three scales instead of seven scales used,[8] which makes the vessel detection procedure faster.
Another feature of the proposed method is the simplicity of implementation and the efficient time it needs to reduce bright lesions and to segment vessels simultaneously. It is also an unsupervised method which can be helpful when the manual segmentation of the images is not available.
The performance of the method is highly efficient in segmentation of pathological retinal images as it can be seen in Table 3.
Although, in the final segmentation, the majority of large and small vessels are detected, there is some erroneous false detection of noise and other artifacts. The major errors are due to background noise and non-uniform illumination across the retinal images, border of the optic disc and other types of pathologies. Another difficulty is the lack of precision to capture some of the thinnest vessels that are barely perceived by human observers. In fact, small retinal vessels usually have poor local contrast and they almost never have ideal solid linear structure.
Our proposed scheme does not require any user intervention and it has consistent performance for both normal and abnormal images and also on the two different datasets. The segmentation algorithm was applied to two databases and its performance has been analyzed. It achieved a competitive accuracy and the AUC compared with the other segmentation techniques and a human observer. The method was originally developed for fundus images, but it can be effective for other types of vascular images since its detection is based on the geometry of vessels. The proposed approach may provide a great benefit to ophthalmologists when monitoring, diagnosing and treating diabetic retinopathy and other ocular-related diseases.
BIOGRAPHIES

Vahid Mohammadi Saffarzadeh received B.Sc. in computer engineering from Shahid Chamran University in 2011 and M.Sc. in artificial intelligence from Shahid Chamran University in 2013. His research interest includes machine learning, image processing and HPC.
E-mail: v.saffarzadeh@mscstu.scu.ac.ir

Dr. Alireza Osareh got his Ph.D from Bristol University in 2004, and currently works as an associate professor in Computer Engineering Department of Shahid Chamran University. His research interest includes machine learning and data mining, medical and biomedical image processing, computational intelligence and pattern recognition.
E-mail: alireza.osareh@scu.ac.ir

Dr. Bita Shadgar is an assistant professor in the Computer Engineering Department at Shahid Chamran University. She has received her Phd from Bristol University at 2003, and her master degree from Ferdosi University at 1998 in the Software Engineering field. However her BSc is from Isfahan University of Iran at 1996.
E-mail: bita.shadgar@scu.ac.ir
Footnotes
Source of Support: Nil
Conflict of Interest: None declared
REFERENCES
- 1.Osareh A, Shadgar B. Automatic blood vessel segmentation in color images of retina. Iran J Sci Technol. 2009;33:191–206. [Google Scholar]
- 2.Lam BS, Gao Y, Liew AW. General retinal vessel segmentation using regularization-based multiconcavity modeling. IEEE Trans Med Imaging. 2010;29:1369–81. doi: 10.1109/TMI.2010.2043259. [DOI] [PubMed] [Google Scholar]
- 3.Fraz MM, Remagnino P, Hoppe A, Uyyanonvara B, Rudnicka AR, Owen CG, et al. Blood vessel segmentation methodologies in retinal images-A survey. Comput Methods Programs Biomed. 2012;108:407–33. doi: 10.1016/j.cmpb.2012.03.009. [DOI] [PubMed] [Google Scholar]
- 4.Chaudhuri S, Chatterjee S, Katz N, Nelson M, Goldbaum M. Detection of blood vessels in retinal images using two-dimensional matched filters. IEEE Trans Med Imaging. 1989;8:263–9. doi: 10.1109/42.34715. [DOI] [PubMed] [Google Scholar]
- 5.Hoover A, Kouznetsova V, Goldbaum M. Locating blood vessels in retinal images by piecewise threshold probing of a matched filter response. IEEE Trans Med Imaging. 2000;19:203–10. doi: 10.1109/42.845178. [DOI] [PubMed] [Google Scholar]
- 6.Jiang X, Mojon D. Adaptive local thresholding by verification-based multithreshold probing with application to vessel detection in retinal images. IEEE Trans Pattern Anal Mach Intell. 2003;25:131–7. [Google Scholar]
- 7.Gang L, Chutatape O, Krishnan SM. Detection and measurement of retinal vessels in fundus images using amplitude modified second-order Gaussian filter. IEEE Trans Biomed Eng. 2002;49:168–72. doi: 10.1109/10.979356. [DOI] [PubMed] [Google Scholar]
- 8.Nguyen UT, Bhuiyan A, Park LA, Ramamohanarao K. An effective retinal blood vessel segmentation method using multi-scale line detection. Pattern Recognit. 2012;46:703–15. [Google Scholar]
- 9.Staal J, Abràmoff MD, Niemeijer M, Viergever MA, van Ginneken B. Ridge-based vessel segmentation in color images of the retina. IEEE Trans Med Imaging. 2004;23:501–9. doi: 10.1109/TMI.2004.825627. [DOI] [PubMed] [Google Scholar]
- 10.Soares JV, Leandro JJ, Cesar RM, Júnior, Jelinek HF, Cree MJ. Retinal vessel segmentation using the 2-D Gabor wavelet and supervised classification. IEEE Trans Med Imaging. 2006;25:1214–22. doi: 10.1109/tmi.2006.879967. [DOI] [PubMed] [Google Scholar]
- 11.Ricci E, Perfetti R. Retinal blood vessel segmentation using line operators and support vector classification. IEEE Trans Med Imaging. 2007;26:1357–65. doi: 10.1109/TMI.2007.898551. [DOI] [PubMed] [Google Scholar]
- 12.Mendonça AM, Campilho A. Segmentation of retinal blood vessels by combining the detection of centerlines and morphological reconstruction. IEEE Trans Med Imaging. 2006;25:1200–13. doi: 10.1109/tmi.2006.879955. [DOI] [PubMed] [Google Scholar]
- 13.Lam BY, Yan H. A novel vessel segmentation algorithm for pathological retina images based on the divergence of vector fields. IEEE Trans Med Imaging. 2008;27:237–46. doi: 10.1109/TMI.2007.909827. [DOI] [PubMed] [Google Scholar]
- 14.Majumder A, Irani S. Perception-based contrast enhancement of images. ACM Trans Appl Percept. 2007;4:1–22. [Google Scholar]
- 15.Aibinu AM, Iqbal MI, Shafie AA, Salami MJ, Nilsson M. Vascular intersection detection in retina fundus images using a new hybrid approach. Comput Biol Med. 2010;40:81–9. doi: 10.1016/j.compbiomed.2009.11.004. [DOI] [PubMed] [Google Scholar]
- 16.Zwiggelaar R, Astley SM, Boggis CR, Taylor CJ. Linear structures in mammographic images: Detection and classification. IEEE Trans Med Imaging. 2004;23:1077–86. doi: 10.1109/TMI.2004.828675. [DOI] [PubMed] [Google Scholar]
- 17.Martinez-Perez ME, Hughes AD, Thom SA, Bharath AA, Parker KH. Segmentation of blood vessels from red-free and fluorescein retinal images. Med Image Anal. 2007;11:47–61. doi: 10.1016/j.media.2006.11.004. [DOI] [PubMed] [Google Scholar]
- 18.Vermeer KA, Vos FM, Lemij HG, Vossepoel AM. A model based method for retinal blood vessel detection. Comput Biol Med. 2004;34:209–19. doi: 10.1016/S0010-4825(03)00055-6. [DOI] [PubMed] [Google Scholar]