

Abstract
Background & objectives:
During 6 to 8 wk of gestation, human placental villi show a complex pattern of morphogenesis. There is however, no large scale gene expression study exploring the temporal pattern of the developmental molecular networks in placental villi during the early weeks of gestation. We evaluated the transcriptome profiling of humn placental villus samples obtained from fertile women with voluntarily terminated normal pregnancies between 6-8 wk of gestation.
Methods:
Transcriptomic profiles of individual human placental villous samples from 25 women with normal pregnancies during 6 to 8 wk of gestation were examined using human whole genome expression arrays. Quantitative RT-PCR validation of copy numbers of transcripts for selected 15 genes and exploratory analysis of the microarray data revealed a high degree of quality assurance supportive of further clustering and differential analyses. Immunoblot and immunohistochemical analysis of selected five candidate proteins (CAGE1, CD9, SLC6A2, TANK and VEGFC) based on transcript profiles were done to assess the pattern of down stream informational flow.
Results:
A large number (~9K) of genes with known functions were expressed in the experimental samples. The clustering analysis identified three major expression clusters with gestational age, and four co-expressional clusters. Differential analysis identified a highly discrete regulatory process involving only about 160 genes. Immunochemical analysis of selected candidate proteins based on transcript profiles revealed generally synchronous expression in human early placental villi.
Interpretation & conclusions:
Several signaling pathways linked to immunity (COL1, JAK2, JAK3, IL12, IL13, IL15, IL27, STAT3 and STAT5) were downregulated, while genes of the enriched category of antiviral immunity (ATF/AP1, IL10R and OAS) were clearly over-expressed. Transcriptional integration supportive of programmed development was observed in first trimester placental villi and it included regulation of apoptosis and cell cycle progression (ARRB1, ATR, BLM, CHRNA7, CHRNB1, FYN, KPNA4, and MTOR/FRAP), autophagy (ATG4B, ATG14, BAD, and BCL2), cell adhesion (CD9 and FN1) and epithelial-to-mesenchymal transition (CALD1, FN1, HEY1, MMP2, and WNT3A).
Keywords: Apoptosis, gene expression, immunohistochemistry, microarray, placental villi, Western blot
The human placenta is a complex organ serving tasks of multiple adult organs. It grows rapidly between 4 and 8 wk of gestation, and is accompanied by increased synthesis and secretion of several hormones. This time period is highly vulnerable to external and internal trauma that may often result in dysregulated early placental development associated with high incidence of pregnancy loss, increased risk of intrauterine growth retardation of the foetus and preeclampsia1,2. We have earlier reported that human placental villi during 6 to 8 wk of gestation display a complex pattern of homeodynamics involving proliferation, differentiation and apoptosis along with a categorical expression of genes involved in cellular proliferation, differentiation, apoptosis and inflammatory responses based on a small scale tailored cDNA array3,4. It appeared meaningful to undertake a large scale gene expression study of human first trimester placental villi. There are, however, only a couple of reports wherein large-scale transcriptomics of human first trimester placental villi have been examined. Chen et al5 examined the differential gene expression between human placental villi and decidua collected from eight volunteers between 6 and 8 wk of gestation using an indigenously tailored 9600 human PCR-amplified cDNA microarray; a set of 49 villous-specific genes were identified showing five-fold or more expression in villi compared with decidua. Using the Affymetrix GeneChip platform, Mikheev et al6 compared the whole genome expression profiles of human placental villi in four samples for each of first trimester, second trimester and Caesarean section term groups, and identified expression of 836 specific genes in first trimester samples as compared to term samples; of these genes, 147 overexpressed specific genes in first trimester placental villi clustered into three major enriched categories of genes associated with cell cycle, cell division and metabolism. However, in previous studies, the temporal pattern of the developmental molecular networks in placental villi during the early weeks of gestation remained largely unexplored. In the present study, we examined the whole-transcriptome profiling using NimbleGen135K human whole genome expression arrays of individual human placental villous samples obtained from 25 proven fertile women bearing normal pregnancies voluntarily terminated between 6 and 8 wk of gestation. Based on the present whole transcriptome data, we explored the transcriptomic networks, and assessed quantitative informational flow of a few key gene products showing differential expressional display in human first trimester placental villi.
Material & Methods
Sample collection: The study was conducted in the department of Physiology, All India Institute of Medical Sciences (AIIMS), New Delhi, India. The study protocol was approved by the Ethics Committee of AIIMS, and written informed consents was obtained from all women. First trimester human placental samples were obtained from 29 healthy proven fertile women (age group: 20-42 yr) undergoing elective surgical termination of singleton pregnancies between 6 and 8 wk of gestation (8 in 6 wk, 11 in 7 wk, 10 in 8 wk) without any prior medication. Gestational age was estimated from menstrual history, physical and ultrasonographic evaluation. No case of complicated pregnancy from infection, and other significant foetal and maternal clinical indications was included.
Placental samples were collected in sterile ice-cold phosphate buffered saline (PBS, pH 7.4) and transported on ice to the laboratory within 10 min after collection. Placental villi were quickly isolated and used for RNA extraction as described previously7. Briefly, tissue samples were quickly washed in ice-cold PBS to remove blood and debris, and separated from surrounding membranes. Villous portions were dissected from decidual and embryonic tissue under a dissecting microscope and further washed with sterile, cold PBS. Randomly selected pieces from each sample were immediately subjected to (i) RNA extraction, (ii) chemical fixation in neutral buffered paraformaldehyde (4%, w/v) and further processed for immunohistochemistry, and (iii) pulverization in liquid nitrogen for Western immunoblot experiments as described elsewhere3,8.
RNA extraction: The methodological details of RNA extraction have been given elsewhere4,7. Briefly, total RNA was extracted using Trizol (Agilent Technologies Singapore Pvt. Ltd., Shung Avenue, Singapore) and cleaned up with DNase I (Sigma Chemical Co., St. Louis, Missouri, USA) and subjected to re-extraction when it was necessary. The yield and purity of the extracted RNA was checked using standard spectrophotometric method and 1 per cent agarose gel electrophoresis. RNA integrity number (RIN) score of individual samples was determined using Bioanalyzer, RNA Chip kit and software from Agilent Technologies (Santa Clara, CA, USA). Since four samples failed to yield either sufficient amount of RNA or an acceptable RIN score (>8.0), only 25 samples were included in the present study.
Microarray experiment: Microarray experiments with individual samples were performed according to the standard guidelines9. Total RNA (10 μg/sample) was converted to cDNA, labelled with Cy3, and hybridized to the NimbelGen Human Gene Expression 12x135K (60-mer probes per target for latest 45K human genome builds) microarray in glass format (Catalogue no. 070925_HG18_expr_HX12) using the NimbleGen Expression protocol10.
Feature extraction of arrays and data normalization: Arrays were scanned with Agilent G2505B microarray scanner system (Santa Clara, CA, USA). The scanned images were processed to normalize the expression data using quantile normalization and Robust Multi-array analysis (RMA) algorithm using the NimbleScan2.5 software. The software filtered out the features that were significantly (P <0.05) higher than the mean background signal and the features that were saturated. The microarray data as Gene Calls RMA files containing normalized image analysis values for each detected probe along with accession number were imported into the GeneSpring11.5.0 software (Agilent Technologies, Santa Clara, CA, USA) for further analysis on log transformed data. All measurements per chip were normalized to the 50th percentile and expression values for each gene were normalized using the average expression score of glyceraldehyde 3-phosphate dehydrogenase GAPDH as the endogenous control, because it showed minimum dispersion among all samples in both array analysis and real time RT-PCR analysis. Pearson's correlation coefficients were done to assess the reliability of data obtained from two separate hybridization runs for the same RNA preparation samples. The normalized data were further used for analysis as described below.
Quality analyses of data: Prior to undertaking microarray expression data analysis, the following tests for the expression data were done for quality assurance using GeneSpring11.5.0 software (Agilent Technologies, Santa Clara, CA, USA):
-
(i)
Descriptive statistics for obtaining the measures of central tendencies and dispersions of data.
-
(ii)
Frequency distribution of probes for different groups of expression levels was analyzed in all 25 samples. In the present study, various levels of expression have been arbitrarily labelled as very high (>1.5), markedly high (1.5 to 1.2), high (<1.2 to >0.9), moderate (0.9 to 0.6), low (<0.6 to 0), markedly low (<0 to >-0.9), very low (-0.9 to >-1.2), and overtly low (-1.2 to -1.5) levels.
-
(iii)
Empirical Bayesian Prediction (EBP) analysis was performed using input values for the entire gene list from all the samples, and the confidence measures of the prediction analysis were assessed using the Naïve Bayesian Model7. EBP analysis revealed a very high degree of predictability with confidence measure of ~1 for all samples.
-
(iv)
Clustering analysis of annotated data was performed using a standardized Pearson's uncentered correlation vector with average linkage for distance and similarity measures between the gene expression patterns for each sample. Hierarchical clustering revealed that the three groups belonging to 6, 7 and 8 wk of gestation, respectively assorted with sufficient clustering distance (~0.4).
-
(v)
Lin's concordance correlation coefficients between values of transcript abundance obtained from arrays and quantitative RT-PCR for 15 selected genes were estimated to assess the reproducibility assurance of signal estimation from arrays11. The relative expressions of selected genes in all samples were performed on real time RT-PCR technology (iCyclerQTm Real time PCR detection system, BioRad, Hercules, CA, USA) using GAPDH as the house keeping internal control gene product. Of the selected genes, six genes (ATF7IP, CD9, FN1, PAQR8, SFPQ and WNT3A) displayed overall high expression, four genes (CAGE1, FGD2, SLC6A2 and ZNF395) displayed moderate expression and five genes (EFCAB3, STAT3, STAT5B, TANK and VEGFC) displayed overall low expression in array data analysis. Of these genes, four (CAGE1, CD9, FGD2 and SLC6A2) showed differential expression. All primers were designed on the Beacon Designer software7.0 (Labware Scientific Inc., Milipitas, CA, USA) based on SYBR green chemistry and obtained from Qiagen (Cologne, Germany). QuantiTech Reverse Transcription kit for cDNA synthesis and QuantiFast SYBR green PCR kit for PCR amplification from Qiagen were used according to the protocol given by the manufacturer. Briefly, cDNA was synthesized with Superscript II reverse transcriptase from same total RNA (5 μg) samples as were used for the array experiments and the levels of select transcripts were estimated for each cDNA sample. Cycle threshold (Ct) values were obtained and the ∆Ct values between experimental Ct and normalization Ct (GAPDH) were determined and the relative expression ratios between groups were calculated by using 2-∆∆Ct method as described previously7. Estimates of copy numbers for the target transcripts in complex RNA samples were obtained using standards from Clontech (Takara Bio Inc., Shiga, Japan) and pooled RNA as an internal control7.
Collectively, it appeared that transcriptomic expression data in the present study were of sufficiently high quality supportive of further downstream analysis.
Analysis for identifying differential expression: Normalized microarray data were subjected to one-way analysis of variance followed by pair-wise comparisons of expression values for each probe between 6 wk and 7 wk, 6 wk and 8 wk, and 7 wk and 8 wk of gestation, respectively. The resulting gene lists from each pair-wise comparison were filtered for the genes that showed >2-fold changes at P <0.05 by using a parametric Welch T-test with Benjamini-Hochberg multiple testing corrections for false discovery rate.
Networks and enrichment analysis: Networks and enrichment analyses were implemented upon K-mean clusters as described previously7 using the GeneSpring11.5.0 software. K-mean cluster analysis of hybridization signals for all probes in all samples of the three groups (6, 7 and 8 wk of gestation) identified four distinct clusters labelled as K1, K2, K3 and K4 (Fig. 1). Networks and different enrichment analyses were done using gene lists obtained from the above analyses and based on pre-fixed setting of a cut-off threshold of pFDR (P)≤ 0.05 with the help of the GeneSpring11.5.0 software and Metacore platform (GeneGo, St. Joseph, MI, USA) for accessing links to various genomic bioinformatics portals and platforms. Networks and different enrichment analyses were also done for genes classified according to the expression levels.
Fig. 1.
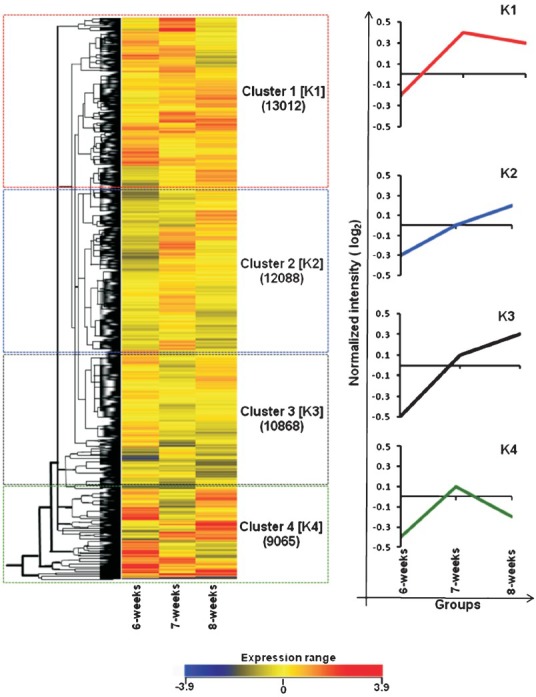
Summary of K-means analysis applied on normalized hybridized signals (in log2) for samples of 6, 7 and 8 wk of gestation (shown in X-axis). Dendogram shows four specific clusters [K1-K4] identified in K-means classification along with number of probes in each cluster (brackets) and expressional distance among expressed probes on Y-axis (A). Cohort average expression patterns for each group are shown in the right panel (B). Cluster 1 (K1) consisted of co-expressed 11280 genes (13012 probes) with increasing profiles between 6 and 7 wk with no obvious change between 7 and 8 wk. Cluster 2 (K2) consisted of co-expressed 10434 genes (12088 probes) with an overall rising profile between 6 and 8 wk with a linear gradient. Cluster 3 (K3) consisted of co-expressed 9404 genes (10868 probes) with an overall rising profile between 6 and 8 wk but with different gradients between 6 to 7 wk and 7 to 8 wk. Cluster 4 (K4) consisted of co-expressed 7827 genes (9065 probes) with increasing profiles between 6 and 7 wk followed by a fall in profile between 7 and 8 wk.
Immunochemical analysis: Five candidate proteins (CAGE1, CD9, SLC6A2, TANK, and VEGFC) were subjected to immunochemical analyses using specific antibodies (Table I) in Western immunoblot and immunohistochemistry experiments with 6-8 wk placental villi samples. Of these candidates, transcripts values were high for CD9, moderate for CAGE1 and SLC6A2, and low for TANK and VEGFC. Additionally, CAGE1, CD9 and SLC6A2 showed differential expression between any two-group analysis (Table II).
Table I.
Characteristics of target proteins and primary antibodies used in the study
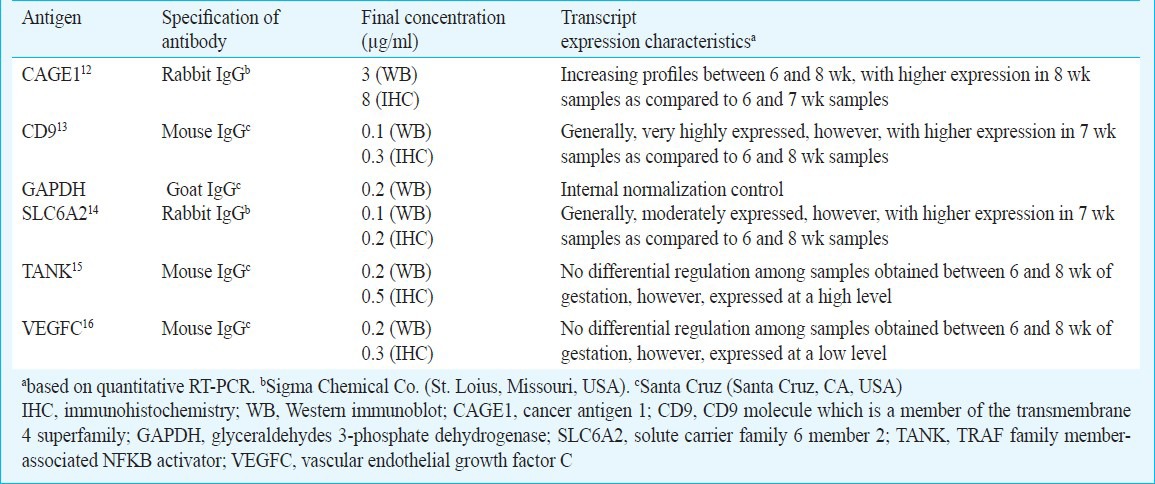
Table II.
List of common genes displaying differential+ expression between any-two-groups
Western immunoblots (WB): Profiles of five candidate proteins and GAPDH in homogenates of all samples were assessed in samples of 25 μg protein content along with pre-stained molecular weight markers based on SDS-PAGE/Western immunoblotting methods on nitrocellulose membrane using electrophoresis and trans-blot equipment, and chemicals obtained from Bio-Rad (Hercules, CA, USA) as described elsewhere8. Final visualization was achieved by using Vectastain ABC immunoperoxidase kits (Vector Laboratories, Burlingame, CA, USA). Respective primary antibody and secondary antibody controls were run simultaneously to examine the specificity of procedure. The molecular weights and semi-quantitative densitometric analysis of bands were determined using a densitometric equipment (Pharos FX Plus Molecular Imager, Bio-Rad, Hercules, CA, USA) and an optimized densitometric analysis software (PD Quest Advanced, Bio-Rad). The integrated measures of optical densities for individual antigens were calculated from log of transmittance for each of the target antigen and normalized with that of GAPDH.
Immunohistochemistry (IHC): IHC staining for five candidate proteins was performed on 5 μm paraffin sections from all samples in duplicates using a method described earlier3,8. Appropriate fluorochrome (Alexa 488 for green and Texas red for red)-conjugated secondary antibodies (Molecular Probes, Grand Island, NY, USA) were used for visualization. Specificity of antibody binding was assessed by omitting primary antibodies, immunoadsorption of primary antibodies with target antigens, replacing primary antibodies with unrelated IgG from same species and other species, omitting secondary antibodies, and replacing secondary antibodies with unrelated IgGs from same or other species in parallel sections. The nuclei were counterstained with diamidino-6-phenylindole (DAPI) (Molecular Probes, Grand Island, NY, USA). The procedural details of image analysis using a confocal laser scanning microscope (Leica Microsystems, Wetzlar GmbH, Germany) and image analysis software QWIN DC 200 (Leica, Cambridge, UK) have been described elsewhere3,8.
Statistical analysis: Statistical analyses of all array based data were done using the GeneSpring11.5.0 software. Statistical analyses of Q-PCR data and image analysis data were done using Kruskal-Wallis test followed by multiple comparison test based on rank sums Wilcoxon test using SPSS v.17 software (SPSS, Inc., Chicago, IL, USA).
Results
Robust multi-array analysis of gene expression profiles from 25 placental villi identified hybridization signals for ~39K target genes in NimbleGen arrays. The data are archived as a record with an accession number GSE37653 at http://www.ncbi.nlm.nih.gov/geo.
Enrichment analysis: Enhancement analysis of the genes in the four K-mean clusters (Fig. 1) revealed characteristic process identities specific to individual clusters. Six genes associated with caspase activation and regulation of cell cycle, four genes associated with platelet-derived growth factor (PDGF) and vascular endothelial growth factor (VEGF) signaling, and two genes associated with cholesterol metabolism and biosynthesis were co-expressed in K1. Fifteen genes associated with cell adhesion, ephrin receptor signaling, insulin signaling, notch signaling and PPAR signaling were co-expressed in K2. The genes in K3 and K4 were associated with developmental and apoptotic processes. Thirteen genes associated with cell cycle-p53 signaling, cell apoptosis and survival, and G-protein signaling were co-expressed in K3, while five co-expressed genes in K4 clustered into enriched categories of chemokine signaling, cytokine-cytokine receptor interaction, cysteine and methionine metabolism, and tight junction.
Enrichment analysis of genes with known functions expressed at different levels of expression (Appendix) identified two very highly (>1.5) expressed genes (FN1 and WNT3A) involved in two enriched categories (cytoskeletal remodelling and epithelial-mesenchymal transition); additionally, CD9 and FN1 were selected in the cell adhesion category. Another set of 59 probes (52 genes) showed markedly high levels of expression (between 1.2 and 1.5); of which seven genes appeared to be involved in four enriched categories: antiviral immunity (ATF2 and IL10RA), DNA-damage-induced apoptosis (ATR), cytoskeletal remodelling (MYL6) and epithelial-to-mesenchymal transition (CALD1, HEY1 and MMP2). A total of 295 probes (256 genes) showing high levels of expression (> 0.9) were seen to fall beyond mean + 3SD. Enrichment analysis of genes (190) that displayed expression levels between 0.9 and 1.2 identified additional genes (ARRB1, BLM and CHRNA7) associated with regulation of apoptosis and cell cycle. On the other hand, 925 probes which included 814 known genes showed moderate (between 0.9 and 0.6) expression levels that fell between mean + 2SD and mean + 3SD, and clustered into enriched categories associated with antiviral immunity (EIF2S2 and OAS1), apoptosis inhibition (CHRNB1, FYN and MTOR/FRAP1) and cell cycle progression (CHRNB1, FYN, KPNA4 and MTOR/FRAP1). A relatively large number of probes (9198) which included 7915 known genes showed low (between 0.6 and 0.0) expression levels involved in activin A signaling, development related hedgehog signaling and opioid receptor signaling systems, apoptosis, cell adhesion and cytoskeleton remodelling/epithelial-to-mesenchymal transition (Appendix).
Appendix.
Enriched categories of gene groups with different expression levels
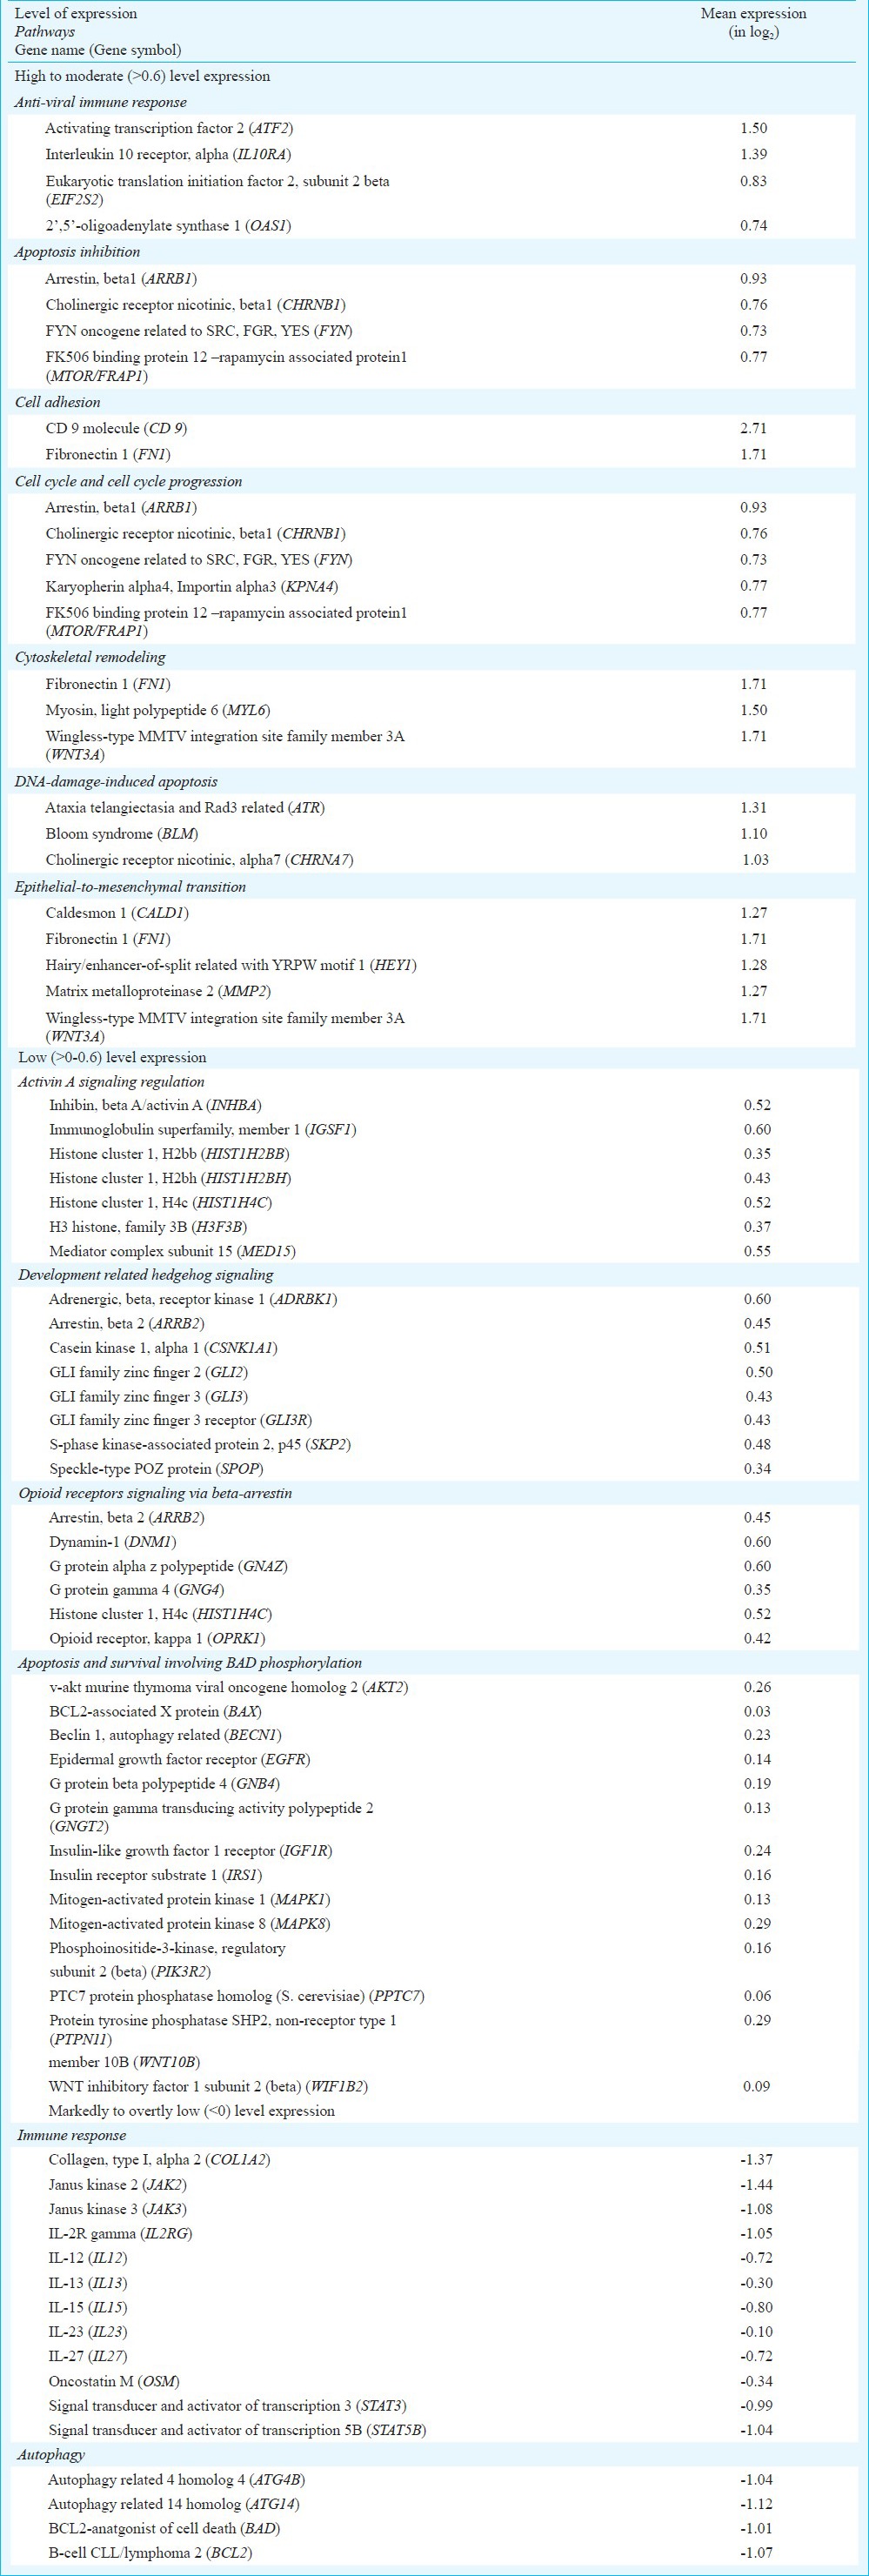
A large number of probes (34615) which included 29960 known genes, however, showed <0 level of expression. Of these, 13 probes/genes showed overtly low levels of expression (between -1.2 and -1.5) that fell beyond mean - 3SD; three of these genes (COL1A2, JAK2 and JAK3) were identified in the enrichment category of genes associated with immune responses. On the other hand, 1139 probes (983 genes) that showed very low levels of expression (between -0.9 and > -1.2) were seen to fall between mean -3SD and mean -2SD. Collectively, enrichment analysis of under-expressed (<0) genes identified specific genes that clustered into enriched categories associated with interleukin signaling involved in immunity and genes associated with autophagy (Appendix).
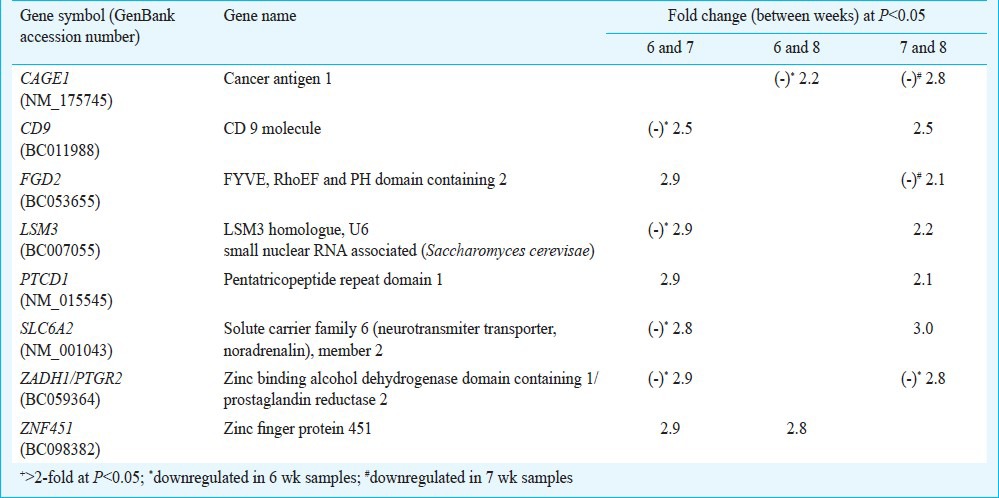
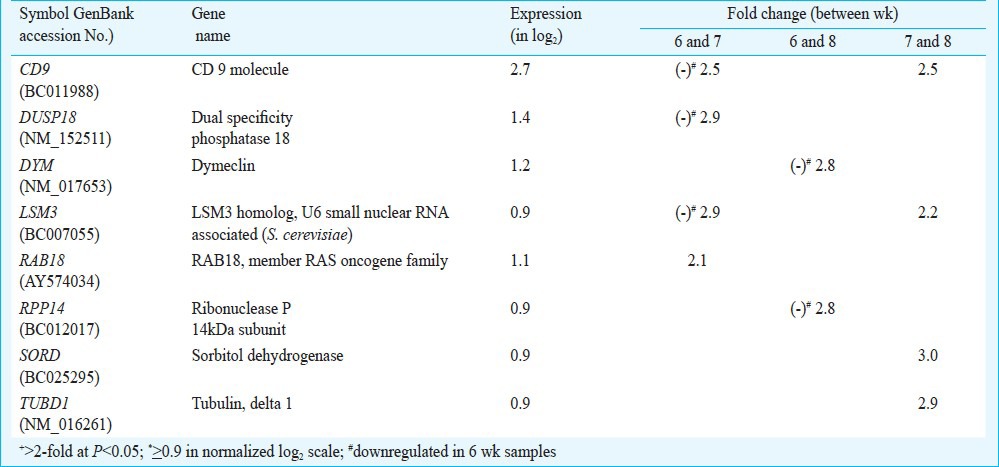
Differential transcriptomics of placental villi: Venn analysis of the genes showing differential display between any two groups in array experiments revealed eight common genes displaying differential expression (Table II). A comparison between any two groups revealed that expression of pentatricopeptide repeat domain-1 (PTCD1) and zinc finger protein 451 (ZNF451) showed relative upregulation, and zinc binding alcohol dehydrogenase domain containing 1 (ZADH1) showed relative downregulation categorically in 6 wk samples compared with 7 and 8 wk samples. On the other hand, three genes (CD9, LSM3 and SLC6A2) showed relative upregulation and FGD2 showed relative downregulation in 7 wk samples compared with 6 and 8 wk samples. The expression of CAGE1 showed relative upregulation categorically in 8 wk samples compared with 6 and 7 wk samples (Table II).
Table III shows the list of eight genes with known functions that showed differential expression and were highly represented with expression level of > 0.9. However, not a single gene in the under-represented (< -0.9) category falling in the 5 per cent of total area in the left tail of the frequency distribution graph showed differential expression.
Table III.
List of differentially+ regulated highly* represented genes in placenta villi at 6, 7 and 8 wk of gestation
Immunochemical analyses of target proteins: Image analysis of data of WBs and IHCs for five target proteins revealed overall high degree of concordance between estimated copy numbers from quantitative RT-PCR and immunochemical estimation from WB and IHC, except for the immunopositive area of CAGE1 and immunoblot quantitation for SLC6A2 in 7 wk samples. Representative images from WB and IHC experiments are shown in Figs 2 and 3, respectively.
Fig. 2.
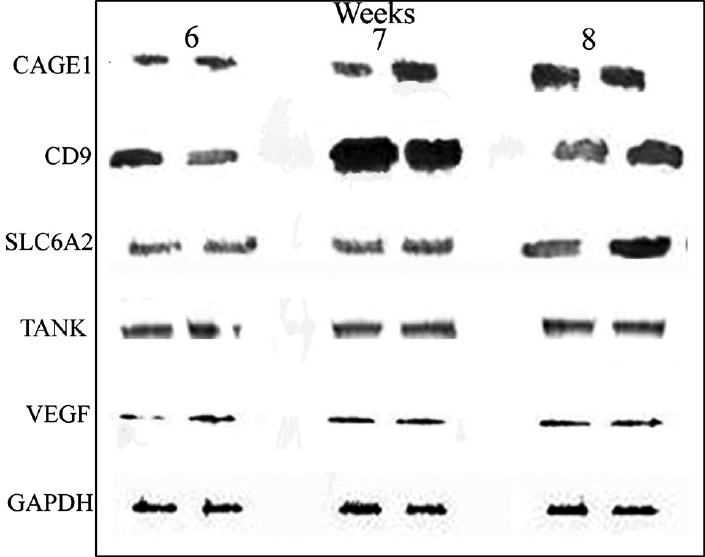
Representative Western blot analysis of immunopositive levels of cancer antigen 1 (CAGE), CD9, solute carrier family 6 member 2 (SLC6A2), TRAF family member-associated NFKB activator (TANK), and vascular endothelial growth factor C (VEGFC) in lysates of primary villi obtained from two individual placental samples collected during 6, 7 and 8 wk of gestation, respectively. Lysates containing 25 μg Bradford protein were electrophoretically separated and subjected to immunblot analysis using glyceraldehyde 3-phosphate dehydrogenase (GAPDH) from the same sample as the internal control.
Fig. 3.
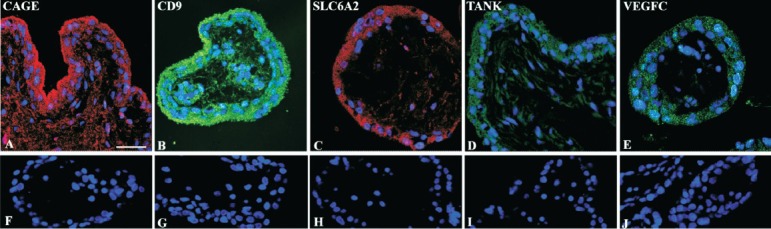
Immunohistochemical staining of serial sections of the human first trimester placental villi. Cancer antigen 1 (CAGE) antibody raised in rabbit showed red (Texas red) immunostaining of the antigen in syncytiotrophoblast, stromal matrix of 8 wk villous placenta (A); serial parallel section immunostained with control rabbit IgG (F). Antisera against CD9, a tetraspanin molecule (CD9) shows green (Alexa 488) immunostaining of the antigen in syncytiotrophoblast and in cells of villous stroma of 7 wk villous placenta (B); parallel section immunostained with CD9 antibody immunoadsorbed with the antigen fails to show any immunostaining (G). Antisera against neurotransmitter transporter for noradrenalin belonging to the solute carrier family 6 member 2 (SLC6A2) shows red immunostaining in syncytiotrophoblast of 7 wk villous sample (C) and its parallel section immunostained with primary antibody but without the secondary antibody (H). Antibody against TRAF family member-associated NFKB activator (TANK) shows weak immunostaining (green) in villous trophoblast and in a few scattered stromal cells (D), no positive immunostaining is detected in the serial parallel section immunostained without the primary antibody and with rabbit IgG (I). Vascular endothelial growth factor C (VEGFC) is immunolocalized primarily in villous trophoblast cells (E) while the parallel section immunostained with primary antibody against VEGFC that was immunoadsorbed with the antigen failed to show any specific staining (J). Nuclei were counterstained with DAPI (blue). Bar = 50 μm.
Networks analysis: The knowledge-based pathways network analysis revealed that downregulation of immune function without compromising antiviral immunity was a basic genetic expressional characteristic of human first trimester placental villi (Fig. 4). Further, it revealed the transcriptomic bias in first trimester placental villi towards high level of innate defense against microbial invasion; for example, the transcripts for defensins, cell surface mucin, soluble mucin, and tripartite motif (TRIM) proteins were markedly high. Further networks analysis of 22 genes involved in apoptosis and four genes involved in autophagy identified the transcriptional regulation process putatively operative in the first trimester placental villi for apoptosis and autophagy (Fig. 5).
Fig. 4.
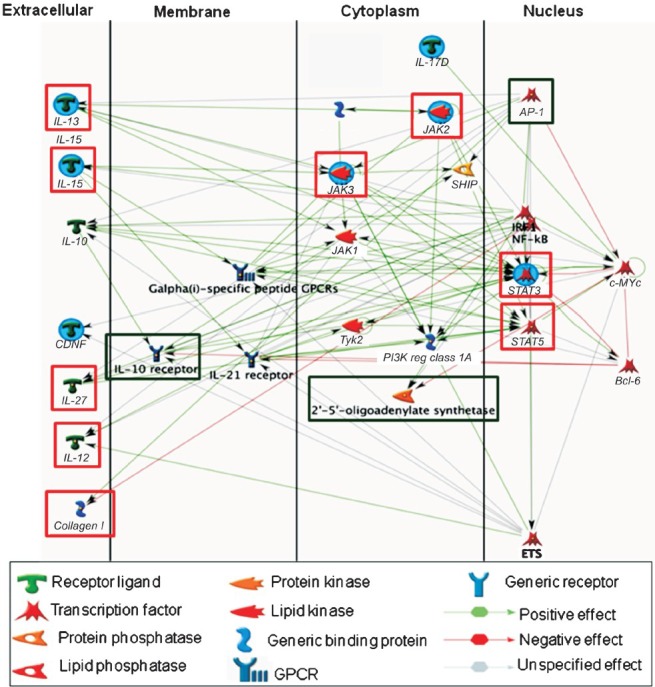
Knowledge-based construction of networks-pathways processes involving highly expressed (green box) three genes (ATF/AP1, IL10R and OAS) associated with antiviral immunity and nine underexpressed (red box) genes (COL1, JAK2, JAK3, IL12, IL13, IL15, IL27, STAT3 and STAT5) associated with immune response in enriched categories. It appears that integration of IL-10R, and OAS-Ap1-IRF/NF-kB plays a significant role in antiviral function. AP-1 and IRF/NF-kB appear to be minor and major functional hubs, respectively. On the other hand, the overall underexpression of several ILs (IL-12, IL-13, IL-15 and IL-27) and JAKs (JAK-2 and JAK-3) is suggestive of downregulation of immune responses. In this process, IL-13, IL-15, JAK-2, JAK-3 and STAT-3 appear to be seeding nodes (blue filled circle) in the pathway processes. The expression values and gene names are given in Appendix.
Fig. 5.
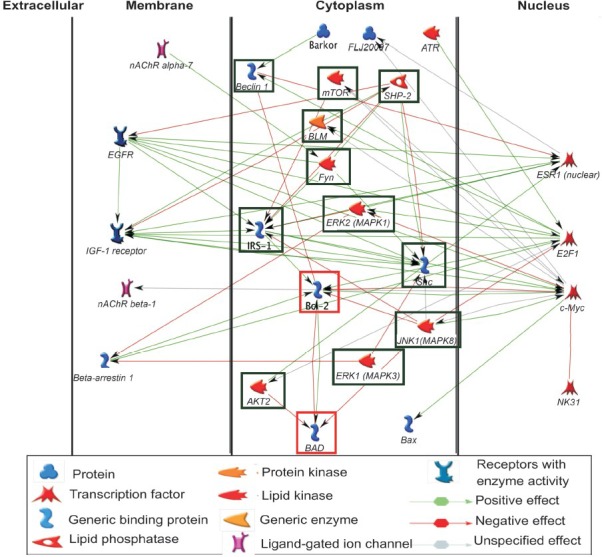
Knowledge-based construction of networks-pathways processes putatively involved in transcription regulation of apoptosis and autophagy in human first trimester placentas based on over-represented 22 genes integral to apoptosis and under represented four genes integral to autophagy. Interestingly, 11 nodes in cytoplasm involved in regulation of apoptosis (green box) were over-represented, while two nodes in cytoplasm involved in autophagy (red box) were under-represented. The expression values and gene names are given in Appendix.
Discussion
In the present study, human first trimester placental villi displayed transcript signals for a large number of genes (~39K), of which ~9K genes with known functions displayed marked expression. A large number (~12K) of genes were reportedly expressed in human first trimester placental villi in a previous study17. Placental villi are composed of a mesenchymal core surrounded by villous trophoblast, each population having pools of several cell types and these cells are transciptionally active in specific manners18. Collectively, it appears that first trimester placental villi are transcriptionally very active.
The present study further documented that downregulation of immune function without compromising antiviral immunity as evident from the involvement of AP1-IL10R-OAS network19,20,21,22. It was a basic genetic expressional characteristic of human first trimester placental villi. It is noteworthy in this regard that overt downregulation of genes associated with immune response may predispose the mother to preeclampsia23. It is anticipated that experiments to explore the transcriptomics of isolated trophoblast cells at different time points of gestation may yield better understanding in this regard.
Functional significance of specific candidate gene expression: Besides general functional characteristics, a knowledge-based analysis could identify additional functional clues in the present expression data sets, some of which potentially show high relevance to first trimester placental functions. Over-representation of CD9 (2.71), FN1 (1.71) and WNT3A (1.71) with only moderate level expression of vimentin, VIM (0.13) along with low expression levels of desmin, DES (-0.07) and smooth muscle type actins, alpha-actin 2 ACTA2 (-0.22) and actin gamma 1 (ACTG1) (-0.04) was seen in human placental villi during 6 to 8 wk of gestation. There are earlier reports indicating expression of CD9, FN1 and WNT in first trimester placental villi4,6,24,25,26. While CD9, FN1 and WNT3A have been implicated in epithelial-to-mesenchymal transition, cell adhesion and migration27,28, the expression of desmin and sm-actins has been implicated in the differentiation process of vimentin-positive mesenchymal cells into fibroblasts and myofibroblasts in the core matrix of villi29. Thus, our observation possibly indicates that during 6 to 8 wk of gestation, cytotrophoblast commitment to the population of extravillous trophoblast with mesenchymal phenotype is quantitatively more abundant in placental villi as compared to mesenchymal recruitment into fibroblasts and myofiboblasts in the villous core. At that stage of pregnancy myofibroblasts do not seem to be important, while these become an essential part of the villous core in the second trimester when the development of larger vessels in stem villi starts29. The present immunohistochemical evidence also substantiates the suggestion.
Involvement of the WNT-process appeared important in first trimester placental biology. Moderate representation of several WNT and firzzeled homolog FZD members associated with relatively low expression levels for beta-catenin (CTNNB, -0.09) and moderate expression of MTOR/FRAP1 (0.77) in the first trimester placentas was noted in the present study. Thus, it appeared that the transcriptional basis of WNT – FZD as a part of Wnt canonical pathway was available in the first trimester placentas, however, the entities downstream to FZD in canonical Wnt pathways were not selected. On the other hand, the non-canonical pathway involving mTOR/FRAP-1 appears to be adequately represented. mTOR/FRAP-1 pathways include several machineries involved in cell growth, inhibition of apoptosis, cell migration and invasion30,31 that are integral to the process of successful placentation and embryogenesis28,32,33. mTOR/Frap1 null mice showed failed pregnancy immediately after implantation with impaired embryogenesis and trophoblast growth34.
The other important aspect of functional significance of specific candidate gene expression was revealed by the immunochemical analysis of five candidate proteins (CAGE1, CD9, SLC6A2, TANK, and VEGFC). These gene products have been demonstrated to be present in the placenta12,13,14,15,16. Generally, marked concordance was observed at the level of both average expression and differential display among transcript values, immunopositive protein expression levels in lysates and immunopositive areas in tissue sections. This observation is suggestive of high degree of predictive information transfer from transcriptional expression to translational expression levels in the early placental villi.
In conclusion, it appears from the present study that only a limited number (167) of known genes of human early placental villi show differential transcriptomic expression on time scale between 6 and 8 wk of gestation, although a moderately large number (~ 1K) of genes are highly expressed. The genes linked with immune tolerance, antiviral immunity, developmental programming involving regulation of apoptosis, autophagy, cell cycle progression, epithelial-mesenchymal transition, as well as placental hormones and proteins related to transporter functions show consistent expression in early placental villi.
Acknowledgment
This work was supported by the Indian Council of Medical Research. The authors acknowledge all the volunteers who donated their biological samples and also the support of senior and junior residents, nurses of the Department of Obstetrics and Gynecology, All India Institute of Medical Sciences (AIIMS), New Delhi. The authors also acknowledge the technical support rendered by Shri Harpal Rana, Department of Physiology, AIIMS for Confocal Microscopy, and Professor Berthold Huppertz, Medical University of Graz, Graz, Austria, for his comments on the manuscript.
References
- 1.Pardi G, Marconi AM, Cetin I. Placental-fetal interrelationship in IUGR fetuses - a review. Placenta. 2002;23(Suppl A):S136–41. doi: 10.1053/plac.2002.0802. [DOI] [PubMed] [Google Scholar]
- 2.Burton GJ, Jauniaux E, Charnock-Jones DS. The influence of the intrauterine environment on human placental development. Intl J Dev Biol. 2010;54:303–11. doi: 10.1387/ijdb.082764gb. [DOI] [PubMed] [Google Scholar]
- 3.Kar M, Ghosh D, Sengupta J. Histochemical and morphological examination of proliferation and apoptosis in human first trimester villous trophoblast. Hum Reprod. 2007;22:2814–23. doi: 10.1093/humrep/dem284. [DOI] [PubMed] [Google Scholar]
- 4.Khan MA, Kar M, Mittal S, Kumar S, Bhargava VL, Sengupta J, et al. Small scale transcript expression profile of human first trimester placental villi analyzed by a custom-tailored cDNA array. Indian J Physiol Pharmacol. 2010;54:235–54. [PubMed] [Google Scholar]
- 5.Chen HW, Chen JJ, Tzeng CR, Li HN, Chang SJ, Cheng YF, et al. Global analysis of differentially expressed genes in early gestational decidua and chorionic villi using a 9600 human cDNA microarray. Mol Hum Reprod. 2002;8:475–84. doi: 10.1093/molehr/8.5.475. [DOI] [PubMed] [Google Scholar]
- 6.Mikheev AM, Nabekura T, Kaddoumi A, Bammler TK, Govindarajan R, Herbert MF, et al. Profiling gene expression in human placentae of different gestational ages: an OPRU Network and UW SCOR Study. Reprod Sci. 2008;15:866–77. doi: 10.1177/1933719108322425. [DOI] [PMC free article] [PubMed] [Google Scholar]
- 7.Khan MA, Sengupta J, Mittal S, Ghosh D. Genome-wide expressions in autologous eutopic and ectopic endometrium of fertile women with endometriosis. Reprod Biol Endocrinol. 2012;10:84. doi: 10.1186/1477-7827-10-84. [DOI] [PMC free article] [PubMed] [Google Scholar]
- 8.Sengupta J, Khan MA, Huppertz B, Ghosh D. In vitro effects of the antimicrobial peptide Ala8,13,18-magainin II amide on isolated human first trimester villous trophoblast cells. Reprod Biol Endocrinol. 2011;9:49. doi: 10.1186/1477-7827-9-49. [DOI] [PMC free article] [PubMed] [Google Scholar]
- 9.Brazma A, Hingamp P, Quackenbush J, Sherlock G, Spellman P, Stoeckert C, et al. Minimum information about a microarray experiment (MIAME)- towards standards for microarray data. Nature Genet. 2001;29:365–71. doi: 10.1038/ng1201-365. [DOI] [PubMed] [Google Scholar]
- 10.NimbleGen Expression Array. 2011. http://www.nimblegen.com/products/expression/eukarya/human/12x135k/inde.html .
- 11.Lin LI. A concordance correlation coefficient to evaluate reproducibility. Biometrics. 1989;45:255–68. [PubMed] [Google Scholar]
- 12.Jungbluth AA, Silva WA, Jr, Iversen K, Frosina D, Zaidi B, Coplan K, et al. Expression of cancer-testis (CT) antigens in placenta. Cancer Immun. 2007;7:15–27. [PMC free article] [PubMed] [Google Scholar]
- 13.James JL, Stone PR, Chamley LW. The isolation and characterization of a population of extravillous trophoblast progenitors from first trimester human placenta. Hum Reprod. 2007;22:2111–9. doi: 10.1093/humrep/dem144. [DOI] [PubMed] [Google Scholar]
- 14.Jayanthi LD, Vargas G, DeFelice LJ. Characterization of cocaine and anti-depressant-sensitive norepinephrine transporters in rat placental trophoblasts. Br J Pharmacol. 2002;135:1927–34. doi: 10.1038/sj.bjp.0704658. [DOI] [PMC free article] [PubMed] [Google Scholar]
- 15.Su AI, Wiltshire T, Batalov S, Lapp H, Ching KA, Block D, et al. A gene atlas of the mouse and human protein-encoding transcriptomes. Proc Natl Acad Sci USA. 2004;101:6062–7. doi: 10.1073/pnas.0400782101. [DOI] [PMC free article] [PubMed] [Google Scholar]
- 16.Lash GE, Schiessl B, Kirkley M, Innes BA, Cooper A, Searle RF, et al. Expression of angiogenic growth factors by uterine natural killer cells during pregnancy. J Leukoc Biol. 2006;80:572–80. doi: 10.1189/jlb.0406250. [DOI] [PubMed] [Google Scholar]
- 17.Dizon-Townson DS, Lu J, Morgan TK, Ward KJ. Genetic expression by fetal chorionic villi during the first trimester of human gestation. Am J Obstet Gynecol. 2000;183:706–11. doi: 10.1067/mob.2000.106583. [DOI] [PubMed] [Google Scholar]
- 18.Apps R, Sharkey A, Gardner L, Male V, Trotter M, Miller N, et al. Genome-wide expression profile of first trimester villous and extravillous human trophoblast cells. Placenta. 2011;32:33–43. doi: 10.1016/j.placenta.2010.10.010. [DOI] [PMC free article] [PubMed] [Google Scholar]
- 19.Bharti AC, Shukla S, Mahata S, Hedau S, Das BC. Anti-human papillomavirus therapeutics: facts & future. Indian J Med Res. 2009;130:296–310. [PubMed] [Google Scholar]
- 20.Mahata S, Bharti AC, Shukla S, Tyagi A, Husain SA, Das BC. Berberine modulates AP-1 activity to suppress HPV transcription and downstream signaling to induce growth arrest and apoptosis in cervical cancer cells. Mol Cancer. 2011;10-39:1–14. doi: 10.1186/1476-4598-10-39. [DOI] [PMC free article] [PubMed] [Google Scholar]
- 21.Lin RJ, Yu HP, Chang BL, Tang WC, Liao CL, Lin YL. Distinct antiviral roles for human 2’,5’-oligoadenylate synthetase family members against dengue virus infection. J Immunol. 2009;183:8035–43. doi: 10.4049/jimmunol.0902728. [DOI] [PubMed] [Google Scholar]
- 22.Rigopoulou EI, Abbott WG, Haigh P, Naoumov NV. Blocking of interleukin-10 receptor - a novel approach to stimulate T-helper cell type responses to hepatitis C virus. Clin Immunol. 2005;117:57–64. doi: 10.1016/j.clim.2005.06.003. [DOI] [PubMed] [Google Scholar]
- 23.Founds SA, Conley YP, Lyons-Weiler JF, Jeyabalan A, Hogge WA, Conrad KP. Altered global gene expression in first trimester placentas of women destined to develop preeclampsia. Placenta. 2009;30:15–24. doi: 10.1016/j.placenta.2008.09.015. [DOI] [PMC free article] [PubMed] [Google Scholar]
- 24.Aplin JD, Haigh T, Jones CJ, Church HJ, Viæovac L. Development of cytotrophoblast columns from explanted first-trimester human placental villi: role of fibronectin and integrin alpha5beta1. Biol Reprod. 1999;60:828–38. doi: 10.1095/biolreprod60.4.828. [DOI] [PubMed] [Google Scholar]
- 25.Hirano T, Higuchi T, Ueda M, Inoue T, Kataoka N, Maeda M, et al. CD9 is expressed in extravillous trophoblasts in association with integrin alpha3 and integrin alpha5. Mol Hum Reprod. 1999;5:162–7. doi: 10.1093/molehr/5.2.162. [DOI] [PubMed] [Google Scholar]
- 26.Nagamatsu T, Fujii T, Ishikawa T, Kanai T, Hyodo H, Yamashita T, et al. A primary cell culture system for human cytotrophoblasts of proximal cytotrophoblast cell columns enabling in vitro acquisition of the extra-villous phenotype. Placenta. 2004;25:153–65. doi: 10.1016/j.placenta.2003.08.015. [DOI] [PubMed] [Google Scholar]
- 27.Aplin JD, Jones CJ, Harris LK. Adhesion molecules in human trophoblast - a review. I. Villous trophoblast. Placenta. 2009;30:293–8. doi: 10.1016/j.placenta.2008.12.001. [DOI] [PubMed] [Google Scholar]
- 28.Knofler M. Critical growth factors and signalling pathways controlling human trophoblast invasion. Internatl J Develop Biol. 2010;54:269–89. doi: 10.1387/ijdb.082769mk. [DOI] [PMC free article] [PubMed] [Google Scholar]
- 29.Kohnen G, Kertschanska S, Demir R, Kaufmann P. Placental villous stroma as a model system for myofibroblast differentiation. Histochem Cell Biol. 1996;105:415–29. doi: 10.1007/BF01457655. [DOI] [PubMed] [Google Scholar]
- 30.Fingar DC, Richardson CJ, Tee AR, Cheatham L, Tsou C, Blenis J. mTOR controls cell cycle progression through its cell growth effectors S6K1 and 4E-BP1/eukaryotic translation initiation factor 4E. Mol Cell Biol. 2004;24:200–16. doi: 10.1128/MCB.24.1.200-216.2004. [DOI] [PMC free article] [PubMed] [Google Scholar]
- 31.Zhou H, Huang S. Role of mTOR signaling in tumor cell motility, invasion and metastasis. Curr Protein Peptide Sci. 2011;12:30–42. doi: 10.2174/138920311795659407. [DOI] [PMC free article] [PubMed] [Google Scholar]
- 32.Wen HY, Abbasi S, Kellems RE, Xia Y. mTOR: a placental growth signaling sensor. Placenta. 2005;26(Suppl A):S63–9. doi: 10.1016/j.placenta.2005.02.004. [DOI] [PubMed] [Google Scholar]
- 33.Roos S, Powell TL, Jansson T. Placental mTOR links maternal nutrient availability to fetal growth. Biochem Soc Transac. 2009;37:295–8. doi: 10.1042/BST0370295. [DOI] [PubMed] [Google Scholar]
- 34.Murakami M, Ichisaka T, Maeda M, Oshiro N, Hara K, Edenhofer F, et al. mTOR is essential for growth and proliferation in early mouse embryos and embryonic stem cells. Mol Cell Biol. 2004;24:6710–8. doi: 10.1128/MCB.24.15.6710-6718.2004. [DOI] [PMC free article] [PubMed] [Google Scholar]