Figure 6.
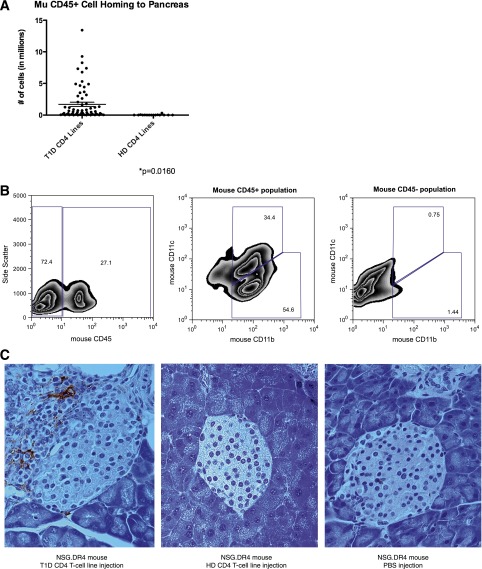
Mouse CD45 cells were recruited to the pancreas by CD4+ T cells from T1D donors. A: Recruitment of mouse leukocytes to the pancreas was determined by cell count in one-half a pancreas at the time of harvest in conjunction with mouse CD45 staining by FACS. The number of mouse CD45 cells (in millions) is shown along the y-axis. Recruitment of mouse leukocytes was significantly higher in mice injected with T1D CD4 lines (87 mice) than in mice injected with HD CD4 lines (21 mice, P = 0.0160). Each point represents one mouse. CD4+ T-cell line injections from donors HD003, HD004, T1D001, T1D029, and T1D584 are shown. B: Single-cell suspensions were isolated and pooled from mice injected with T1D001 PPI88S lines. Cells were stained for expression of mouse CD45 (left panel), the CD45+ (middle panel), and CD45− (right panel) populations further analyzed for CD11b and CD11c expression to better characterize the mouse cells recruited to the pancreas in this model. Of the cells staining mouse CD45+, 34% also stained CD11b+CD11c+, identifying them as dendritic cells (middle panel). The majority of the remaining CD45+ cells stained CD11b+ (middle panel). No CD11b or CD11c staining was detected in the population staining CD45– (right panel). C: F4/80 staining (left panel) shows large quantities of pancreas-infiltrating F4/80-positive macrophages and/or dendritic cells in a mouse injected with a CD4+ T-cell line from donor T1D001. An NSG.DR4 mouse injected with cells from HD004 (middle panel) shows little or no F4/80 staining, similar to an NSG.DR4 mouse injected with PBS only (right panel). All panels, 40× magnification. HD, healthy donor; T1D, type 1 diabetes.

