

Abstract
Type 2 deiodinase (D2) converts the prohormone thyroxine (T4) to the metabolically active molecule 3,5,3′-triiodothyronine (T3), but its global inactivation unexpectedly lowers the respiratory exchange rate (respiratory quotient [RQ]) and decreases food intake. Here we used FloxD2 mice to generate systemically euthyroid fat-specific (FAT), astrocyte-specific (ASTRO), or skeletal-muscle-specific (SKM) D2 knockout (D2KO) mice that were monitored continuously. The ASTRO-D2KO mice also exhibited lower diurnal RQ and greater contribution of fatty acid oxidation to energy expenditure, but no differences in food intake were observed. In contrast, the FAT-D2KO mouse exhibited sustained (24 h) increase in RQ values, increased food intake, tolerance to glucose, and sensitivity to insulin, all supporting greater contribution of carbohydrate oxidation to energy expenditure. Furthermore, FAT-D2KO animals that were kept on a high-fat diet for 8 weeks gained more body weight and fat, indicating impaired brown adipose tissue (BAT) thermogenesis and/or inability to oxidize the fat excess. Acclimatization of FAT-D2KO mice at thermoneutrality dissipated both features of this phenotype. Muscle D2 does not seem to play a significant metabolic role given that SKM-D2KO animals exhibited no phenotype. The present findings are unique in that they were obtained in systemically euthyroid animals, revealing that brain D2 plays a dominant albeit indirect role in fatty acid oxidation via its sympathetic control of BAT activity. D2-generated T3 in BAT accelerates fatty acid oxidation and protects against diet-induced obesity.
Introduction
Thyroid hormone signaling is initiated by entry of 3,5,3′-triiodothyronine (T3) into target cells and binding with nuclear T3 receptors, modulating the expression of T3-responsive genes (1). Signaling through this pathway is also affected by local events, with target cells playing a role through controlled expression of the activating or inactivating deiodinases (2). These enzymes are thyroredoxin fold-containing selenoproteins that can activate the prohormone thyroxine (T4) to its active form T3 (type 2 deiodinase [D2]) or inactivate both T4 and T3 and T3 to T2 (type 3 deiodinase [D3]) (3–5). As a result, cells that express D2 have higher T3 levels and thus exhibit an enhanced T3-dependent mRNA footprint, and the opposite is observed in type 3 deiodinase–expressing cells. Thus customizing thyroid hormone signaling via deiodinases is an important mechanism in energy homeostasis (2), brain (6), brown adipose tissue (BAT) (7), pancreatic β-cell (8), heart (9), and skeletal muscle (10,11).
Inactivation of the D2 gene (Dio2) affects the expression of T3-dependent genes in D2-expressing tissues such as BAT and brain, essentially dampening thyroid hormone signaling in a tissue-specific fashion (12). Accordingly, a mouse with global inactivation of the Dio2 gene (GLOB-D2KO) exhibits a significant metabolic phenotype characterized by decreased respiratory quotient (RQ), resistance to diet-induced obesity, and super tolerance to glucose, some of which is reversed upon acclimatization at thermoneutrality (13). A similar phenomenon was observed in the uncoupling protein 1 knockout mouse (14) and in systemically hypothyroid mice (15). These findings indicate that an increase in sympathetic activity at room temperature plays a role in defining the metabolic phenotype of animal models exhibiting a disruption in thyroid hormone signaling, either localized (GLOB-D2KO) or systemic (13,16).
D2-generated T3 has been shown to play a critical role in BAT uncoupling protein 1 expression (17,18) and BAT thermogenesis (19). Thus the metabolic phenotype displayed by the GLOB-D2KO mouse has been largely attributed to the lack of D2-generated T3 in BAT (13,20,21). In fact, BAT D2 is induced by sympathetic activity and rapidly increases thyroid hormone signaling during cold exposure (22,23). However, a number of other metabolically relevant tissues in the rodent express D2, e.g., brain (24), skeletal muscle (25), and bone (26), and could also play a role in defining the metabolic phenotype of the GLOB-D2KO mouse. For example, D2 is expressed in the mediobasal hypothalamus (27,28) where it has been implicated in the orexigenic response during refeeding (29) and in lowering thyrotropin-releasing hormone/thyroid-stimulating hormone (TSH) secretion in disease states (30). At this time, it is still not clear what, if any, metabolic roles D2 plays in skeletal muscle and bone.
The lower RQ observed in the GLOB-D2KO animals is unexpected because thyroid hormone administration is known for accelerating fatty acid oxidation (31) and lowering RQ values (32). However, given that the lower RQ values are dissipated once the GLOB-D2KO animals are acclimatized to thermoneutrality (13), it is likely that a compensatory increase in BAT sympathetic activity plays a role (13,16). Of note, a subsequent study did not find a lower RQ in the GLOB-D2KO mouse studied briefly by indirect calorimetry (33), despite reduced liver glycogen and elevated serum βOH-butyrate levels, which is commonly associated with increased sympathetic activity and fatty acid oxidation (34).
The present studies were performed to define the mechanism(s) and anatomical site(s) whereby D2-mediate T3 production affects fatty acid oxidation as reflected in the RQ. To this aim, we compared the metabolic phenotype of the GLOB-D2KO mouse with that of three other systemically euthyroid mouse strains that exhibit 1) astrocyte-specific (ASTRO-D2KO), 2) fat-specific (FAT-D2KO), or 3) skeletal-muscle-specific (SKM-D2KO) inactivation of Dio2 after they were admitted to a comprehensive laboratory animal monitoring system (CLAMS) and monitored continuously through indirect calorimetry. Our findings indicate that brain D2 indirectly inhibits BAT fatty acid oxidation via dampening of sympathetic activity in BAT. In contrast, D2-generated T3 in BAT accelerates fatty acid oxidation given that selective disruption of this pathway in BAT increases RQ and predisposes to diet-induced obesity. No significant metabolic phenotype resulting from D2 inactivation in skeletal muscle was identified. The evidence obtained through the use of these animal models is unique in its physiological relevance because it reflects the result of tissue-specific D2 inactivation in an otherwise systemically euthyroid animal.
Research Design and Methods
Animals
All experimental procedures were planned following the American Thyroid Association guide to investigating thyroid hormone economy and action in rodent and cell models (35) and approved by the local Institutional Animal Care and Use Committee. For the studies including the GLOB-D2KO mouse, ∼10-week-old C57BL/6J and GLOB-D2KO mice that had been backcrossed in the same background (21) were used from our established colonies, kept at room temperature (22°C) with a 12-h dark/light cycle starting at 0600 h, and housed in standard plastic cages with four male mice per cage.
For the tissue-specific deletion of dio2 in adipose tissue, astrocytes, and skeletal muscle cells, we establish an in vivo mouse model for cell-type–specific deletion of D2-generating floxed D2 (dio2flx) mice as described previously (36). The dio2flx mice were crossed with transgenic mice expressing Cre recombinase under the fatty acid binding protein 4 promoter (FABP4; B6.Cg-Tg[FABP4-Cre]1Rev/J; The Jackson Laboratory, Bar Harbor, ME) (37) or glial fibrillary acidic protein promoter (GFAP; FVB-Tg[GFAP-Cre]25Mes/J; The Jackson Laboratory) (38) or myosin light chain 1f (MLC) (39). This strategy was used in order to eliminate D2 activity in the FABP4-expressing adipocytes (FAT-D2KO mice), GFAP-expressing astrocytes (ASTRO-D2KO mice), and MLC-expressing myocytes (SKM-D2KO). In all experiments, only Cre littermates were used as controls. The generation of the ASTRO-D2KO mice was recently described (36). At the time of the studies, all mice were between 9 and 14 weeks of age.
Only male animals were used. Animals were kept on standard chow diet (3.1 kcal/g; 2918 Teklad Global Protein Rodent Diet; Harlan Laboratories, Madison, WI) or a high-fat diet (HFD; 4.5 kcal/g; TD 95121; Harlan Teklad, Indianapolis, IN) as indicated. In the experiments involving high-fat feeding, 3-month-old littermate controls and FAT-D2KO or SKM-D2KO mice (six per group) that had been fed chow diet were switched to a HFD for 8 weeks and kept at room temperature (22°C) or thermoneutrality (30°C) as indicated.
At the end of experimental period, the animals were killed by asphyxiation in a CO2 chamber. Blood was collected and serum levels of TSH, T4, and T3 measured using a MILLIPLEX rat thyroid hormone panel kit following the instructions of the manufacturer (Millipore Corp., Billerica, MA) and read on a BioPlex (Bio-Rad, Hercules, CA).
Body Composition
Lean body mass and fat mass were determined by dual-energy X-ray absorptiometry (DEXA; Lunar Pixi, Janesville, WI) as described previously (13).
Indirect Calorimetry
Animals were admitted to a CLAMS (OXYMAX System 4.93; Columbus Instruments, Columbus, OH) (13) with free access to food and water. Studies were performed at 22, 18, 15, 11, and 5°C for the indicated times. Animals were allowed to acclimatize in individual metabolic cages for 48 h before any measurements. Subsequently, metabolic profiles were generated as indicated and the data collected in the next 36 h. This system allows for continuous measurement of oxygen consumption (VO2; mL/kg BW/h) and carbon dioxide production (VCO2) in successive 14- or 26-min cycles, using a sensor calibrated against a standard gas mix containing defined quantities of O2 and CO2. These data were used to calculate the respiratory exchange ratio (RQ; VCO2/VO2) and the energy expenditure (EE) ([3.815 + 1.232 · RQ] · VO2). Contribution of fat acid oxidation to EE was calculated as described using the following equation: percentage of fat contribution = [468.6 · (1 − RQ)] / [5.047 · (RQ − 0.707) + 4.686 · (1 − RQ)] (40). The 24 h caloric intake was measured at the indicated times while the animals were admitted to the CLAMS.
Glucose and Insulin Tolerance Tests
For glucose tolerance tests, mice were fasted overnight and the glucose measurement was made as described previously (8). For insulin tolerance tests, mice with food ad libitum were injected with insulin, and the glucose measurement was made as described previously (8).
Deiodinase Assays
D2 activity assay was performed in BAT sonicates as described previously (41,42).
Statistical Analysis
All data are expressed as mean ± SEM and were analyzed using PRISM software (GraphPad Software, San Diego, CA). One-way ANOVA was used to compare more than two groups, followed by the Student–Newman–Keuls test to detect differences between groups. The Student t test was used only when two groups were part of the experiment. P < 0.05 was used to reject the null hypothesis.
Results
GLOB-D2KO Mice Exhibit Increased Diurnal Fatty Acid Oxidation
Under the mild thermal stress conditions of room temperature (22°C), all animals exhibited the expected circadian rhythmicity in VO2 and EE, with higher values observed nocturnally when animals are awake and eating as opposed to the day hours when the animals are resting and eating much less (Fig. 1A and Supplementary Fig. 1A). In this setting, no differences were observed between GLOB-D2KO and wild-type (WT) animals (Fig. 1A). The RQ profile also exhibited circadian rhythmicity with lower values observed diurnally (Fig. 1B). Notably, the diurnal decrease in RQ values was more pronounced in the GLOB-D2KO animals (Fig. 1B), resulting in greater contribution of fatty acid oxidation to the diurnal EE (∼50 vs. ∼35%) (Fig. 1C). This diurnal drop in RQ was associated with a ∼50% reduction in diurnal food intake in the GLOB-D2KO animals, with no differences observed nocturnally (Fig. 1D).
Figure 1.
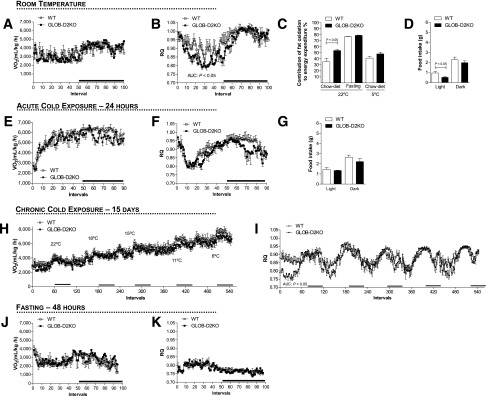
Metabolic phenotype of the GLOB-D2KO mouse. GLOB-D2KO and WT controls were acclimated to individual metabolic cages in the CLAMS for 48 h before measurements were recorded. (A) Oxygen consumption (VO2) during 12-h light and dark cycles recorded at the second day after acclimatization. (B) Same as in A, except that what is shown is RQ. (C) Contribution of fat oxidation to daily EE during the light cycle. (D) Food intake during light and dark cycles of animals kept on regular chow diet at room temperature (22°C). (E) VO2 during 12-h light and dark cycles recorded during acute cold (4°C) exposure. (F) Same as in E, except that what is shown is RQ. (G) Food intake during light and dark cycles of animals kept on regular chow diet during the period of cold (4°C) exposure. (H) VO2 register during chronically (15 days) cold exposed, where the environment temperature was gradually and progressively decreased every 3–4 days. (I) Same as in H, except that what is shown is RQ. (J) VO2 during 12-h light and dark cycles recorded on the first day of 48 h of fasting. (K) Same as in J, except that what is shown is RQ. Entries are mean ± SEM of 3–7 animals. Area under the curve was calculated during light and dark cycles for each individual animal. Statistical significance is shown in each graph and was set as P < 0.05. Student t test was used to compare WT and GLOB-D2KO groups within treatment conditions. Black horizontal bars denote the dark period of the day (12 h). AUC, area under the curve.
The association between reduced food intake and increased fatty acid oxidation in the GLOB-D2KO animals suggest an involvement of the central nervous system, presumably the hypothalamus. Thus we next tested whether the differences between GLOB-D2KO and WT animals would be dissipated in the setting of intense hypothalamic-driven fatty acid mobilization and oxidation, i.e., cold exposure. Housing for 24 h at 4°C resulted in dramatic increase in VO2 and EE in all animals that blurred circadian rhythmicity, similar in GLOB-D2KO and WT controls (Fig. 1E and Supplementary Fig. 1B). In contrast, the RQ profile exhibited the expected circadian rhythmicity in both groups of animals, but the diurnal RQ difference between GLOB-D2KO and WT controls was dissipated (Fig. 1F). This equalized the contribution of fatty acid oxidation to diurnal EE (Fig. 1C). In this setting, both diurnal and nocturnal food intake were similar in all animals (Fig. 1G). Similar findings were obtained when the environment temperature was gradually and progressively decreased every 3 days while the animals remained in the CLAMS for a 2-week period, except that in this case, the VO2 circadian rhythmicity was preserved throughout the experiment (Fig. 1H and I).
Decreasing BAT’s contribution to metabolism by acclimatization to thermoneutrality normalized the RQ in the GLOB-D2KO mouse (13). Thus, in the next set of experiments, we used an alternative strategy to decrease BAT’s contribution to metabolism, i.e., fasting. In fact, a 48 h fasting dramatically reduced VO2 and EE while it minimized their circadian rhythmicity (Fig. 1J and Supplementary Fig. 1C). Furthermore, fasted GLOB-D2KO and WT controls markedly lowered their RQ values, and the 24-profile lost circadian rhythmicity (Fig. 1K). These changes in RQ elevated the contribution of fatty acid oxidation to diurnal EE to almost 80% in all animals (Fig. 1C). More importantly, such as with cold exposure, fasting also dissipated the diurnal differences in RQ between GLOB-D2KO animals and WT controls (Fig. 1K).
ASTRO-D2KO Mice Partially Recapitulate the Metabolic Phenotype of the GLOB-D2KO Animals
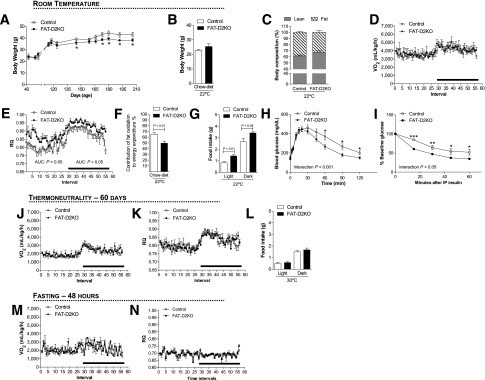
It has been proposed that D2-generated T3 in glial cells near the arcuate nucleus play an orexigenic role in mice (43,44). Thus, to test whether the lower diurnal RQ observed in GLOB-D2KO mouse is caused by D2 inactivation in the brain, we studied the ASTRO-D2KO mouse that lacks D2 activity in the glia but preserves D2 expression in other tissues/cells, including the ependymal tanycytes (36). These animals have normal serum levels of T4, T3, and TSH and are considered systemically euthyroid (36). The ASTRO-D2KO animals exhibit a normal growth curve (Fig. 2A) and, during adulthood, have similar body weight (Fig. 2B) and body composition (Fig. 2C) compared with WT littermate controls. The CLAMS studies revealed that ASTRO-D2KO animals have VO2 and EE profiles that were unremarkable (Fig. 2D and Supplementary Fig. 1D) but a RQ profile that resembled that of the GLOB-D2KO mouse, i.e., lower diurnal values (Fig. 2E), with greater contribution of fatty acid oxidation to the diurnal EE (Fig. 2F); food intake, however, was not different when compared with WT littermate controls (Fig. 2G).
Figure 2.

Metabolic phenotype of the ASTRO-D2KO mouse kept on regular chow diet at room temperature (22°C). (A) Body weight evolution during the 2-month period. (B) Body weight of the animals right before admission to CLAMS. (C) Body composition measured by DEXA 48 h before the animals were admitted to CLAMS. (D) VO2 during 12-h light and dark cycles. ASTRO-D2KO mouse and controls were acclimated to individual metabolic cages in the CLAMS for 48 h before measurements were recorded. Data shown are from the second day after acclimatization. (E) Same as in D, except that what is shown is RQ. (F) Contribution of fat oxidation to daily EE during the light cycle. (G) Food intake of the same animals during light and dark cycles. Entries are mean ± SEM of 4–5 animals. Area under the curve was calculated during light and dark cycles for each individual animal. Statistical significance is shown in each graph and was set as P < 0.05. Student t test was used to compare controls and ASTRO-D2KO groups within treatment conditions. Black horizontal bars denote the dark period of the day (12 h). AUC, area under the curve.
FAT-D2KO Mice Exhibit Around-the-Clock Reduction in Fatty Acid Oxidation
D2 is expressed in BAT, and D2-generated T3 has been shown to regulate local fatty acid synthesis (16,45,46). To test whether D2-generated T3 in BAT affects fatty acid oxidation, we next studied FAT-D2KO mice that lack BAT D2 expression (Supplementary Fig. 2A) and activity (Supplementary Fig. 2B) while expressing D2 normally in other tissues (Supplementary Fig. 2C). These animals have no gross abnormalities and develop and grow normally up until age 5 months, when they exhibit a slightly reduced rate of weight gain (Fig. 3A). These animals also exhibit normal serum levels of T4, T3, and TSH (Supplementary Fig. 2D–F) and are considered systemically euthyroid.
Figure 3.
Metabolic phenotype of the FAT-D2KO mouse kept on regular chow diet. (A) Body weight evolution during the 5-month period of animals kept at room temperature (22°C). The FAT-D2KO mouse and controls were acclimated to individual metabolic cages in the CLAMS for 48 h before measurements were recorded. (B) Body weight of the animals right before the animals were admitted to CLAMS. (C) Body composition measured by DEXA 48 h before the animals were admitted to CLAMS. (D) VO2 during 12-h light and dark cycles recorded the second day after acclimatization of animals kept on regular chow diet at room temperature (22°C). (E) Same as in D, except that what is shown is RQ. (F) Contribution of fat oxidation to daily EE during the light cycle in the same animals. (G) Food intake during light and dark cycles in the same animals. (H) Blood glucose concentrations at the indicated time points after intraperitoneal glucose injection (2 g/kg) in 2-month-old FAT-D2KO and control animals. (I) Blood glucose concentration at the indicated time points before and after intraperitoneal injection of regular human insulin (0.75 units/kg body weight) in 2-month-old FAT-D2KO and control animals. (J) VO2 during 12-h light and dark cycles recorded during chronic (15 days) exposure to thermoneutrality (30°C). (K) Same as in E, except that what is shown is RQ. (L) Food intake during light and dark cycles of animals kept at thermoneutrality. (M) VO2 during 12-h light and dark cycles recorded on the first day of 48 h of fasting. (N) Same as in J, except that what is shown is RQ. Entries are mean ± SEM of 5–12 animals. Area under the curve was calculated during light and dark cycles for each individual animal. Statistical significance is shown in each graph and was set as P < 0.05. Student t test was used to compare controls and FAT-D2KO groups within treatment conditions. Black horizontal bars denote the dark period of day (12 h). *, P < 0.05; **, P < 0.01; ***, P < 0.001 vs. control; AUC, area under the curve; IP, intraperitoneal.
Adult FAT-D2KO mice exhibit similar body weight (Fig. 3B) and body composition (Fig. 3C) when compared with littermate controls. Their VO2 and EE profiles showed no differences when compared with littermate controls (Fig. 3D and Supplementary Fig. 1E). However, RQ values were substantially higher in the FAT-D2KO mice across the 24 h cycle (Fig. 3E), indicating that the absence of D2 in BAT (and white adipose tissue) reduces the contribution of fatty acid oxidation to EE (Fig. 3F). It is notable that FAT-D2KO animals also exhibit greater food intake throughout the 24 h cycle (Fig. 3G), although their body weight (Fig. 3B) and body composition (Fig. 3C) are not different from WT littermate controls. The relatively greater contribution of glucose oxidation to EE was further documented through intraperitoneal glucose tolerance test and insulin tolerance test (Fig. 3H and I). FAT-D2KO animals were more tolerant to glucose (Fig. 3H) and exhibited a greater sensitivity to insulin administration (Fig. 3I) when compared with WT littermate controls.
Given that D2 activity in white adipose tissue is minimal, these differences in RQ are likely to reflect the absence of D2 in BAT. To test if this was the case, we used similar strategy as with the GLOB-D2KO animals, i.e., to minimize BAT contribution to EE by acclimatization at thermoneutrality (30°C for 8 weeks) or by fasting. Acclimatization at thermoneutrality resulted in significant reduction in VO2 and EE, with no differences between FAT-D2KO and control animals (Fig. 3J and Supplementary Fig. 1F). Notably, in this setting, the RQ values for the FAT-D2KO decreased and became indistinguishable from WT littermate controls (Fig. 3K), with similar observations for food intake (Fig. 3L). At the same time, fasting dramatically reduced VO2 and EE as well as their circadian rhythmicity (Fig. 3M and N and Supplementary Fig. 1G). More importantly, fasting also dissipated the differences in RQ between FAT-D2KO and WT littermate controls (Fig. 3N).
FAT-D2KO Mice Are More Susceptible to Diet-Induced Obesity
Given the relative reduction in fatty acid oxidation in the FAT-D2KO BAT, we hypothesized these animals would have impaired BAT thermogenesis and therefore be more susceptible to diet-induced obesity. To test if this was the case, FAT-D2KO animals were placed on an HFD for 8 weeks and notably gained significantly more body weight than WT littermate controls (Fig. 4A and B) while exhibiting similar food consumption (Fig. 4C). In addition, at the end of the experimental period, the FAT-D2KO animals had experienced a greater increase in body fat than WT littermate controls kept on the same diet (Fig. 4D and E), but the contribution of fatty acid oxidation to EE remained unaffected (Fig. 4F), and the VO2, EE, and RQ profiles were not different in these animals (Fig. 4G and H and Supplementary Fig. 1H). Next, to confirm that the greater gain in body weight and body fat in the FAT-D2KO animals were due to impaired BAT thermogenesis, we repeated the HFD for 8 weeks while the animals were kept continuously at thermoneutrality. While food intake remained largely unaffected, both groups of animals gained body weight and body fat in the same proportion once BAT’s contribution to EE was minimized (Fig. 4I–M). Furthermore, CLAMS studies indicated that VO2, EE, and RQ profiles as well as fatty acid contribution to EE were indistinguishable between both groups of animals (Fig. 4N–P and Supplementary Fig. 1I).
Figure 4.
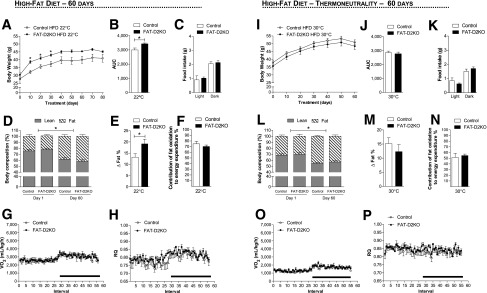
Effect of HFD in the FAT-D2KO mice at room temperature and thermoneutrality. The FAT-D2KO and controls were fed with HFD for 8 weeks. (A) Body weight evolution during 8 weeks of treatment of animals kept at room temperature (22°C). *P < 0.05 vs. control. (B) Area under the curve from the body weight shown in A was calculated from each individual animal. *P < 0.05 vs. control. (C) Food intake during light and dark cycles in the same animals. (D) Body composition measured by DEXA in the animals kept at room temperature before (day 1) and after (day 60) HFD. *P < 0.05 vs. day 1. (E) Δ% of fat measured by DEXA in D, calculated by the difference between days 1 and 60. *P < 0.05 vs. control. (F) Contribution of fat oxidation to daily EE during the light cycle in the same animals. (G) VO2 during 12-h light and dark cycles in the animals kept at room temperature after 8 weeks on HFD. The FAT-D2KO mouse and controls were acclimated to individual metabolic cages in the CLAMS for 48 h before measurements were recorded. Data shown are from the second day after acclimatization. (H) Same as in G, except that what is shown is RQ. (I) Body weight evolution during 8 weeks of treatment of animals kept at thermoneutrality (30°C). (J) Area under the curve from the body weight represented in I, calculated from each individual animal. (K) Food intake during light and dark cycles in the same animals. (L) Body composition measured by DEXA in the animals kept at thermoneutrality before (day 1) and after (day 60) HFD. *P < 0.05 vs. day 1. (M) Δ% of fat measured by DEXA in L, calculated by the difference between days 1 and 60. (N) Contribution of fat oxidation to daily EE during the light cycle in the same animals. (O) VO2 during 12-h light and dark cycles in the animals kept at thermoneutrality after 8 weeks on the HFD. (P) Same as in O, except that what is shown is RQ. Entries are mean ± SEM of 5–6 animals. Statistical significance is shown in each graph and was set as P < 0.05. Student t test was used to compare controls and FAT-D2KO groups within treatment conditions. Black horizontal bars denote the dark period of the day (12 h). AUC, area under the curve.
SKM-D2KO Mice Have Neutral Metabolic Phenotype
Skeletal muscle expresses low levels of D2 activity, but its relatively large mass suggests that D2-generated T3 in this organ may contribute significantly to the overall metabolism. We tested if this was the case by using a mouse model that lacks D2 in the skeletal muscle but preserves D2 activity in all other tissues, i.e., the SKM-D2KO mouse (47). These animals have normal serum levels of T4, T3, and TSH and are considered systemically euthyroid (47). SKM-D2KO mice exhibit a similar growth curve as littermate controls (Fig. 5A) and, during adulthood, also exhibit similar body weight (Fig. 5B) and body composition (Fig. 5C). The VO2 (Fig. 5D), EE (Supplementary Fig. 1J), and RQ (Fig. 5E) profiles as well as the contribution of fatty acid oxidation to EE (Fig. 5F) showed no differences when compared with WT littermate controls; food intake was also similar between groups (Fig. 5G). Next, SKM-D2KO animals were placed on an HFD for 8 weeks to test their ability to handle an excess of calories. Remarkably, these animals exhibited similar gain of body weight (Fig. 5H and I) and fat (Fig. 5J and K) as compared with WT littermate controls, with no differences observed in the VO2 (Fig. 5L), EE (Supplementary Fig. 1L), and RQ (Fig. 5M) profiles.
Figure 5.
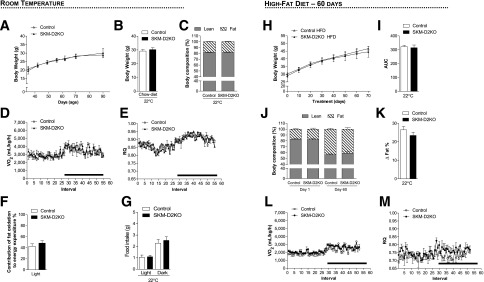
Metabolic phenotype of the SKM-D2KO mouse kept on regular chow diet and HFD at room temperature (22°C). (A) Body weight evolution during the 2-month period. (B) Body weight of the animals right before admission to CLAMS. (C) Body composition measured by DEXA 48 h before the animals were admitted to CLAMS. (D) VO2 during 12-h light and dark cycles. SKM-D2KO mouse and controls were acclimated to individual metabolic cages in the CLAMS for 48 h before measurements were recorded. Data shown are from the second day after acclimatization. (E) Same as in D, except that what is shown is RQ. (F) Contribution of fat oxidation to daily EE during the light cycle. (G) Food intake of the same animals during light and dark cycles. (H) Body weight evolution during 8 weeks of treatment with HFD in animals kept at room temperature (22°C). (I) Area under the curve from the body weight represented in H, calculated from each individual animal. (J) Body composition measured by DEXA in the animals kept at room temperature before (day 1) and after (day 60) HFD. (K) Δ% of fat measured by DEXA in J, calculated by the difference between days 1 and 60. (L) VO2 during 12-h light and dark cycles in the animals kept at room temperature after 8 weeks on HFD. The SKM-D2KO mouse and controls were acclimated to individual metabolic cages in the CLAMS for 48 h before measurements were recorded. Data shown are from the second day after acclimatization. (M) Same as in E, except that what is shown is RQ. Entries are mean ± SEM of 3–6 animals. Statistical significance is shown in each graph and was set as P < 0.05. Student t test was used to compare controls and SKM-D2KO groups within treatment conditions. Black horizontal bars denote the dark period of the day (12 h). AUC, area under the curve.
Discussion
The utilization of systemically hypothyroid or hyperthyroid animals has been the traditional approach to study thyroid hormone action (35). However, almost all tissues and cells respond to thyroid hormone and set off waves of secondary and tertiary effects that are not directly regulated by thyroid hormone. Furthermore, that thyroid hormone membrane transporters, deiodinases, and T3-receptor subtypes can customize thyroid hormone effects on target tissues makes the systemic approach unsuitable for the study of cell-specific thyroid hormone actions. The present studies used a series of systemically euthyroid animal models that exhibit tissue-specific disruption of the D2 pathway and identified a multilevel physiological control of fatty acid oxidation by thyroid hormone. The present findings are unique in that the animal models used remained systemically euthyroid throughout the experiments, revealing the physiological multilevel roles played by D2-generated T3 in fatty acid oxidation.
Selective inactivation of the D2 pathway in glial cells (ASTRO-D2KO) accelerates the diurnal rate of fatty acid oxidation in the BAT (Fig. 2E). These findings are in line with the concept that localized thyroid hormone signaling in the hypothalamus and other brain areas (e.g., brain stem) regulate appetite, BAT sympathetic activity (48,49), and downstream metabolic and cardiovascular targets (50). In contrast, inactivation of D2 in a peripheral tissue, i.e., BAT (FAT-D2KO), led to the opposite metabolic phenotype, including a slower rate of fatty acid oxidation (Fig. 3E), and increased the contribution of carbohydrate oxidation to the overall EE (Fig. 3F). FAT-D2KO mice were also susceptible to diet-induced obesity and gained more weight and body fat on a HFD (Fig. 4C and D). Notably, disruption of the D2 pathway in a second peripheral tissue, i.e., skeletal muscle, was metabolically neutral (Fig. 5A–I), an indication that D2 activity in this tissue is unlikely to play any significant metabolic role.
The RQ reflects the relative contribution of fatty acid, glucose, and protein oxidation to daily EE. Given that VO2 (Fig. 1A) and total daily EE (Supplementary Fig. 1A) remained stable in the GLOB-D2KO animals, the lower diurnal RQ values (Fig. 1B) indicate an acceleration of fatty acid oxidation (Fig. 1C). Liver, heart, skeletal muscle, and BAT all exhibit high rates of fatty acid oxidation and could play a role in this process (51). That the difference in RQ is dissipated by BAT inactivation, i.e., thermoneutrality (13) or fasting (Fig. 1J and K), identifies BAT as the most likely tissue underlying this phenotype. However, is D2-generated T3 playing a direct role in BAT by controlling local fatty acid oxidation or playing an indirect role in BAT via the central nervous system and sympathetic activity or both?
The fact that a diurnal reduction in food intake is part of this phenotype (Fig. 1D) suggests an involvement of the central nervous system. In addition, the fact that the difference in RQ is diurnal and not across the 24 h cycle does not support a “defect” in BAT but rather an adjustment made by the sympathetic nervous system with the possible involvement of higher control areas in the brain. Accordingly, maximal sympathetic stimulation of BAT during cold exposure also dissipated the differences in RQ between GLOB-D2KO and WT controls (Fig. 1F and I).
That the mechanism leading to lower RQ values in the GLOB-D2KO mouse is centrally mediated is supported by the previous observation that BAT norepinephrine turnover is accelerated in GLOB-D2KO mice maintained at room temperature (21). For example, it has been proposed that D2-generated T3 in the glial cells surrounding the arcuate nucleus is important for the orexigenic response during fasting by increasing appetite and decreasing BAT activity in order to preserve energy (29). It is conceivable that a similar mechanism in the hypothalamus or another brain area is taking place as illustrated with the ASTRO-D2KO mouse that lacks D2 in glial cells. Notably, the disruption of the glia D2 pathway partially recapitulated the phenotype of the GLOB-D2KO mouse, including a lower diurnal RQ (Fig. 2E) but not a reduced food intake (Fig. 2G).
As it becomes apparent that D2 plays an important metabolic role in multiple tissues, the development of the FAT-D2KO allowed for a unique insight into the direct role played by D2-generated T3 in BAT physiology. The findings of increased RQ values in these animals indicate a relative state of BAT hypothyroidism despite normal serum T3 levels and provide clear evidence that D2-generated T3 in BAT accelerates fatty acid oxidation. Notably, T3 accelerates fatty acid oxidation by stimulating the expression of rate-limiting elements in this process (31,52,53), lowering RQ values (32). However, these experiments frequently involve systemically hypothyroid animals treated with large doses of T3. The evidence obtained in the current study is unique in its physiological context, reflecting the result of D2 inactivation in BAT cells in an otherwise systemically euthyroid animal. Only through this strategy the physiological role played by D2-generated T3 inside BAT cells could be appreciated.
The faster clearance of glucose from the circulation and the increased insulin sensitivity (Fig. 3H and I) suggest that an increased oxidation of glucose compensates for the impaired fatty acid oxidation in BAT. Whereas this seems to provide sufficient compensation under standard conditions, placing the FAT-D2KO animals on a HFD revealed greater susceptibility to diet-induced obesity (Fig. 4A–D), suggestive of impaired adaptive thermogenesis. This is supported by the observation that at thermoneutrality this phenotype was neutralized (Fig. 4I–L), indicating that the sympathetic nervous system and BAT play an underlying role in this process.
Skeletal muscle expresses very low levels of D2, about two orders of magnitude lower than BAT (25,54). However, given its large size, it is conceivable that D2 contributes significantly to metabolism, similarly to the D2-generated T3 in BAT. The present studies demonstrate that D2 inactivation in skeletal muscle is metabolically neutral, not affecting any of the parameters analyzed, including VO2 and RQ and body weight and composition. In addition, we also increased the metabolic demand by placing these animals on a HFD, and their susceptibility to diet-induced obesity was not affect by disruption of D2 activity in skeletal muscle (Fig. 5F–I). Thus D2-generated T3 in skeletal muscle is not sufficient to play any significant metabolic role.
The analysis of the multiple metabolic parameters and the subsequent adjustments that follow disruption of the D2 pathway—under adverse conditions of environmental temperature and caloric intake—prompt us to speculate what the physiological imperative is, around which all other parameters adjust. In the present studies, VO2 and EE remained stable in all animal models of global or tissue-specific disruption of the D2-generated T3 mechanism. The present data, and also previously published studies, indicate that localized disruption in thyroid hormone signaling is well neutralized by adjustments in the sympathetic activity while maintaining a stable rate of EE and thermogenesis. Even in systemically hypothyroid mice, an increase in sympathetic activity neutralizes much of the expected metabolic phenotype (15). Thus, given the relatively high surface-to-volume ratio in mice, EE and thermoregulation seem to be key physiological imperatives determining the direction and intensity of the adjustments observed in the present investigation.
D2 is expressed in the human brain, including the hypothalamus (55), as well as BAT that is present in adult individuals (51,56,57). This indicates that the present findings are potentially applicable to humans. In fact, a common Dio2 gene polymorphism has been associated with a number of metabolic conditions, including increased BMI and resistance to insulin (51), supporting the idea that D2 could play a role regulating fatty acid utilization in humans.
In conclusion, the present studies deconstructed the metabolic phenotype exhibited by a mouse with global inactivation of D2, explaining the unexpected finding of diurnal acceleration of fatty acid oxidation. The findings in the ASTRO-D2KO mouse indicate that D2-generated T3 in the brain plays a dominant albeit indirect role, inhibiting BAT activity and thus slowing down fatty acid oxidation. The findings in the FAT-D2KO mouse, on the contrary, indicate that D2-generated T3 in BAT accelerate fatty acid oxidation, a mechanism that when absent, is partially compensated for by an increase in glucose utilization. However, the FAT-D2KO mouse remains susceptible to diet-induce obesity, illustrating how critical this mechanism is. In contrast, the D2 pathway in skeletal muscle is unlikely to play any significant metabolic role. The metabolic characterization of these animal models provides a unique insight into how deiodinase-mediated thyroid hormone signaling is critical for energy homeostasis.
Supplementary Material
Article Information
Acknowledgments. The authors are grateful to Carlos Moraes for kindly providing the Cre-MLC mouse used in this study.
Funding. This work was supported by National Institute of Diabetes and Digestive and Kidney Diseases R01 65055, the European Community's Seventh Framework Programme (FP7/2007–2013, no. 259772), Brazilian National Research Council, and American Thyroid Association.
Duality of Interest. No potential conflicts of interest relevant to this article were reported.
Author Contributions. T.L.F., J.P.W.-D.-C., and M.C. conducted experiments, data analyses, and manuscript preparation. B.M.L.C.B., G.W.F., E.A.M., D.L.I., C.C.S.M., and A.F. conducted experiments and data analyses. B.G. created the FloxD2 mouse and reviewed the manuscript. A.C.B. conducted data analyses and manuscript preparation. T.L.F. is the guarantor of this work and, as such, had full access to all the data in the study and takes responsibility for the integrity of the data and the accuracy of the data analysis.
Footnotes
This article contains Supplementary Data online at http://diabetes.diabetesjournals.org/lookup/suppl/doi:10.2337/db13-1768/-/DC1.
References
- 1.Brent GA. Mechanisms of thyroid hormone action. J Clin Invest 2012;122:3035–3043 [DOI] [PMC free article] [PubMed] [Google Scholar]
- 2.Gereben B, Zeöld A, Dentice M, Salvatore D, Bianco AC. Activation and inactivation of thyroid hormone by deiodinases: local action with general consequences. Cell Mol Life Sci 2008;65:570–590 [DOI] [PMC free article] [PubMed] [Google Scholar]
- 3.Callebaut I, Curcio-Morelli C, Mornon JP, et al. The iodothyronine selenodeiodinases are thioredoxin-fold family proteins containing a glycoside hydrolase clan GH-A-like structure. J Biol Chem 2003;278:36887–36896 [DOI] [PubMed] [Google Scholar]
- 4.Bianco AC, Salvatore D, Gereben B, Berry MJ, Larsen PR. Biochemistry, cellular and molecular biology, and physiological roles of the iodothyronine selenodeiodinases. Endocr Rev 2002;23:38–89 [DOI] [PubMed] [Google Scholar]
- 5.Hernandez A, St Germain DL. Thyroid hormone deiodinases: physiology and clinical disorders. Curr Opin Pediatr 2003;15:416–420 [DOI] [PubMed] [Google Scholar]
- 6.Lechan RM. Neuroendocrinology of pituitary hormone regulation. Endocrinol Metab Clin North Am 1987;16:475–501 [PubMed] [Google Scholar]
- 7.Hall JA, Ribich S, Christoffolete MA, et al. Absence of thyroid hormone activation during development underlies a permanent defect in adaptive thermogenesis. Endocrinology 2010;151:4573–4582 [DOI] [PMC free article] [PubMed] [Google Scholar]
- 8.Medina MC, Molina J, Gadea Y, et al. The thyroid hormone-inactivating type III deiodinase is expressed in mouse and human beta-cells and its targeted inactivation impairs insulin secretion. Endocrinology 2011;152:3717–3727 [DOI] [PMC free article] [PubMed] [Google Scholar]
- 9.Ueta CB, Oskouei BN, Olivares EL, et al. Absence of myocardial thyroid hormone inactivating deiodinase results in restrictive cardiomyopathy in mice. Mol Endocrinol 2012;26:809–818 [DOI] [PMC free article] [PubMed] [Google Scholar]
- 10.Dentice M, Marsili A, Ambrosio R, et al. The FoxO3/type 2 deiodinase pathway is required for normal mouse myogenesis and muscle regeneration. J Clin Invest 2010;120:4021–4030 [DOI] [PMC free article] [PubMed] [Google Scholar]
- 11.Gereben B, Zavacki AM, Ribich S, et al. Cellular and molecular basis of deiodinase-regulated thyroid hormone signaling. Endocr Rev 2008;29:898–938 [DOI] [PMC free article] [PubMed] [Google Scholar]
- 12.Hernandez A, Morte B, Belinchón MM, Ceballos A, Bernal J. Critical role of types 2 and 3 deiodinases in the negative regulation of gene expression by T₃in the mouse cerebral cortex. Endocrinology 2012;153:2919–2928 [DOI] [PMC free article] [PubMed] [Google Scholar]
- 13.Castillo M, Hall JA, Correa-Medina M, et al. Disruption of thyroid hormone activation in type 2 deiodinase knockout mice causes obesity with glucose intolerance and liver steatosis only at thermoneutrality. Diabetes 2011;60:1082–1089 [DOI] [PMC free article] [PubMed] [Google Scholar]
- 14.Feldmann HM, Golozoubova V, Cannon B, Nedergaard J. UCP1 ablation induces obesity and abolishes diet-induced thermogenesis in mice exempt from thermal stress by living at thermoneutrality. Cell Metab 2009;9:203–209 [DOI] [PubMed] [Google Scholar]
- 15.Ueta CB, Olivares EL, Bianco AC. Responsiveness to thyroid hormone and to ambient temperature underlies differences between brown adipose tissue and skeletal muscle thermogenesis in a mouse model of diet-induced obesity. Endocrinology 2011;152:3571–3581 [DOI] [PMC free article] [PubMed] [Google Scholar]
- 16.Bianco AC, Carvalho SD, Carvalho CR, Rabelo R, Moriscot AS. Thyroxine 5′-deiodination mediates norepinephrine-induced lipogenesis in dispersed brown adipocytes. Endocrinology 1998;139:571–578 [DOI] [PubMed] [Google Scholar]
- 17.Bianco AC, Kieffer JD, Silva JE. Adenosine 3′,5′-monophosphate and thyroid hormone control of uncoupling protein messenger ribonucleic acid in freshly dispersed brown adipocytes. Endocrinology 1992;130:2625–2633 [DOI] [PubMed] [Google Scholar]
- 18.Bianco AC, Sheng XY, Silva JE. Triiodothyronine amplifies norepinephrine stimulation of uncoupling protein gene transcription by a mechanism not requiring protein synthesis. J Biol Chem 1988;263:18168–18175 [PubMed] [Google Scholar]
- 19.Branco M, Ribeiro M, Negrão N, Bianco AC. 3,5,3′-Triiodothyronine actively stimulates UCP in brown fat under minimal sympathetic activity. Am J Physiol 1999;276:E179–E187 [DOI] [PubMed] [Google Scholar]
- 20.de Jesus LA, Carvalho SD, Ribeiro MO, et al. The type 2 iodothyronine deiodinase is essential for adaptive thermogenesis in brown adipose tissue. J Clin Invest 2001;108:1379–1385 [DOI] [PMC free article] [PubMed] [Google Scholar]
- 21.Christoffolete MA, Linardi CC, de Jesus L, et al. Mice with targeted disruption of the Dio2 gene have cold-induced overexpression of the uncoupling protein 1 gene but fail to increase brown adipose tissue lipogenesis and adaptive thermogenesis. Diabetes 2004;53:577–584 [DOI] [PubMed] [Google Scholar]
- 22.Bianco AC, Silva JE. Cold exposure rapidly induces virtual saturation of brown adipose tissue nuclear T3 receptors. Am J Physiol 1988;255:E496–E503 [DOI] [PubMed] [Google Scholar]
- 23.Carvalho SD, Kimura ET, Bianco AC, Silva JE. Central role of brown adipose tissue thyroxine 5′-deiodinase on thyroid hormone-dependent thermogenic response to cold. Endocrinology 1991;128:2149–2159 [DOI] [PubMed] [Google Scholar]
- 24.Crantz FR, Larsen PR. Rapid thyroxine to 3,5,3′-triiodothyronine conversion and nuclear 3,5,3′-triiodothyronine binding in rat cerebral cortex and cerebellum. J Clin Invest 1980;65:935–938 [DOI] [PMC free article] [PubMed] [Google Scholar]
- 25.Grozovsky R, Ribich S, Rosene ML, et al. Type 2 deiodinase expression is induced by peroxisomal proliferator-activated receptor-gamma agonists in skeletal myocytes. Endocrinology 2009;150:1976–1983 [DOI] [PMC free article] [PubMed] [Google Scholar]
- 26.Gouveia CH, Christoffolete MA, Zaitune CR, et al. Type 2 iodothyronine selenodeiodinase is expressed throughout the mouse skeleton and in the MC3T3-E1 mouse osteoblastic cell line during differentiation. Endocrinology 2005;146:195–200 [DOI] [PubMed] [Google Scholar]
- 27.Guadaño-Ferraz A, Obregón MJ, St Germain DL, Bernal J. The type 2 iodothyronine deiodinase is expressed primarily in glial cells in the neonatal rat brain. Proc Natl Acad Sci U S A 1997;94:10391–10396 [DOI] [PMC free article] [PubMed] [Google Scholar]
- 28.Tu HM, Kim SW, Salvatore D, et al. Regional distribution of type 2 thyroxine deiodinase messenger ribonucleic acid in rat hypothalamus and pituitary and its regulation by thyroid hormone. Endocrinology 1997;138:3359–3368 [DOI] [PubMed] [Google Scholar]
- 29.Coppola A, Liu ZW, Andrews ZB, et al. A central thermogenic-like mechanism in feeding regulation: an interplay between arcuate nucleus T3 and UCP2. Cell Metab 2007;5:21–33 [DOI] [PMC free article] [PubMed] [Google Scholar]
- 30.Fekete C, Gereben B, Doleschall M, et al. Lipopolysaccharide induces type 2 iodothyronine deiodinase in the mediobasal hypothalamus: implications for the nonthyroidal illness syndrome. Endocrinology 2004;145:1649–1655 [DOI] [PubMed] [Google Scholar]
- 31.Fatty acid metabolism in rats treated with triiodothyronine. Nutr Rev 1972;30:234–236 [DOI] [PubMed] [Google Scholar]
- 32.Smith DC, Brown FC. The effect of parrot fish thyroid extract on the respiratory metabolism of the white rat. Biol Bull 1952;102:278–286 [Google Scholar]
- 33.Marsili A, Aguayo-Mazzucato C, Chen T, et al. Mice with a targeted deletion of the type 2 deiodinase are insulin resistant and susceptible to diet induced obesity. PLoS ONE 2011;6:e20832. [DOI] [PMC free article] [PubMed] [Google Scholar]
- 34.Cryer PE. Glucose homeostasis and hypoglycemia. In Williams Textbook of Endocrinology Kronenberg HM, Melmed S, Polonsky KS, Larsen PR, Eds. Philadelphia, Saunders, 2008, p. 1503–1533 [Google Scholar]
- 35.Bianco AC, Anderson G, Forrest D, et al. American thyroid association guide to investigating thyroid hormone economy and action in rodent and cell models. Thyroid 2014;24:88–168 [DOI] [PMC free article] [PubMed] [Google Scholar]
- 36.Fonseca TL, Correa-Medina M, Campos MP, et al. Coordination of hypothalamic and pituitary T3 production regulates TSH expression. J Clin Invest 2013;123:1492–1500 [DOI] [PMC free article] [PubMed] [Google Scholar]
- 37.He W, Barak Y, Hevener A, et al. Adipose-specific peroxisome proliferator-activated receptor gamma knockout causes insulin resistance in fat and liver but not in muscle. Proc Natl Acad Sci USA 2003;100:15712–15717 [DOI] [PMC free article] [PubMed] [Google Scholar]
- 38.Zhuo L, Theis M, Alvarez-Maya I, Brenner M, Willecke K, Messing A. hGFAP-cre transgenic mice for manipulation of glial and neuronal function in vivo. Genesis 2001;31:85–94 [DOI] [PubMed] [Google Scholar]
- 39.Bothe GW, Haspel JA, Smith CL, Wiener HH, Burden SJ. Selective expression of Cre recombinase in skeletal muscle fibers. Genesis 2000;26:165–166 [PubMed] [Google Scholar]
- 40.Lusk G. Animal calorimetry: analysis of the oxidation of mixtures of carbohydrates and fat. J Biol Chem 1926;59:41–42 [Google Scholar]
- 41.Christoffolete MA, Ribeiro R, Singru P, et al. Atypical expression of type 2 iodothyronine deiodinase in thyrotrophs explains the thyroxine-mediated pituitary thyrotropin feedback mechanism. Endocrinology 2006;147:1735–1743 [DOI] [PubMed] [Google Scholar]
- 42.Curcio-Morelli C, Gereben B, Zavacki AM, et al. In vivo dimerization of types 1, 2, and 3 iodothyronine selenodeiodinases. Endocrinology 2003;144:937–946 [DOI] [PubMed] [Google Scholar]
- 43.Diano S, Naftolin F, Goglia F, Horvath TL. Fasting-induced increase in type II iodothyronine deiodinase activity and messenger ribonucleic acid levels is not reversed by thyroxine in the rat hypothalamus. Endocrinology 1998;139:2879–2884 [DOI] [PubMed] [Google Scholar]
- 44.Fekete C, Singru PS, Sanchez E, et al. Differential effects of central leptin, insulin, or glucose administration during fasting on the hypothalamic-pituitary-thyroid axis and feeding-related neurons in the arcuate nucleus. Endocrinology 2006;147:520–529 [DOI] [PubMed] [Google Scholar]
- 45.Bianco AC, Silva JE. Optimal response of key enzymes and uncoupling protein to cold in BAT depends on local T3 generation. Am J Physiol 1987;253:E255–E263 [DOI] [PubMed] [Google Scholar]
- 46.Carvalho SD, Negrão N, Bianco AC. Hormonal regulation of malic enzyme and glucose-6-phosphate dehydrogenase in brown adipose tissue. Am J Physiol 1993;264:E874–E881 [DOI] [PubMed] [Google Scholar]
- 47.Werneck de Castro JP, Fonseca TL, Ignacio DL, et al. Both skeletal myocytes and adipocytes express the type 2 deiodinase within skeletal muscle. In 83rd Annual Meeting of the American Thyroid Association, San Juan, Porto Rico, 2013 Falls Church, VA, American Thyroid Association, p. 69 [Google Scholar]
- 48.López M, Varela L, Vázquez MJ, et al. Hypothalamic AMPK and fatty acid metabolism mediate thyroid regulation of energy balance. Nat Med 2010;16:1001–1008 [DOI] [PMC free article] [PubMed] [Google Scholar]
- 49.Morrison SF, Madden CJ, Tupone D. Central control of brown adipose tissue thermogenesis. Front Endocrinol (Lausanne) 2012;3 [DOI] [PMC free article] [PubMed] [Google Scholar]
- 50.Mittag J, Lyons DJ, Sällström J, et al. Thyroid hormone is required for hypothalamic neurons regulating cardiovascular functions. J Clin Invest 2013;123:509–516 [DOI] [PMC free article] [PubMed] [Google Scholar]
- 51.Bianco AC, Mcaninch EA. The role of thyroid hormone and brown adipose tissue in energy homeostasis. Lancet Diabetes Endocrinol 2013;1:250–258 [DOI] [PMC free article] [PubMed] [Google Scholar]
- 52.Stakkestad JA, Bremer J. The metabolism of fatty acids in hepatocytes isolated from triiodothyronine-treated rats. Biochim Biophys Acta 1982;711:90–100 [DOI] [PubMed] [Google Scholar]
- 53.Stakkestad JA, Bremer J. The outer carnitine palmitoyltransferase and regulation of fatty acid metabolism in rat liver in different thyroid states. Biochim Biophys Acta 1983;750:244–252 [DOI] [PubMed] [Google Scholar]
- 54.Ramadan W, Marsili A, Huang S, Larsen PR, Silva JE. Type-2 iodothyronine 5’deiodinase in skeletal muscle of C57BL/6 mice. I. Identity, subcellular localization, and characterization. Endocrinology 2011;152:3082–3092 [DOI] [PMC free article] [PubMed] [Google Scholar]
- 55.Campos-Barros A, Hoell T, Musa A, et al. Phenolic and tyrosyl ring iodothyronine deiodination and thyroid hormone concentrations in the human central nervous system. J Clin Endocrinol Metab 1996;81:2179–2185 [DOI] [PubMed] [Google Scholar]
- 56.Cypess AM, White AP, Vernochet C, et al. Anatomical localization, gene expression profiling and functional characterization of adult human neck brown fat. Nat Med 2013;19:635–639 [DOI] [PMC free article] [PubMed] [Google Scholar]
- 57.Virtanen KA, Lidell ME, Orava J, et al. Functional brown adipose tissue in healthy adults. N Engl J Med 2009;360:1518–1525 [DOI] [PubMed] [Google Scholar]
Associated Data
This section collects any data citations, data availability statements, or supplementary materials included in this article.