

Abstract
Hepatic ketogenesis plays an important role in catabolism of fatty acids during fasting along with dietary lipid overload, but the mechanisms regulating this process remain poorly understood. Here, we show that Cdc2-like kinase 2 (Clk2) suppresses fatty acid oxidation and ketone body production during diet-induced obesity. In lean mice, hepatic Clk2 protein is very low during fasting and strongly increased during feeding; however, in diet-induced obese mice, Clk2 protein remains elevated through both fed and fasted states. Liver-specific Clk2 knockout mice fed a high-fat diet exhibit increased fasting levels of blood ketone bodies, reduced respiratory exchange ratio, and increased gene expression of fatty acid oxidation and ketogenic pathways. This effect of Clk2 is cell-autonomous, because manipulation of Clk2 in hepatocytes controls genes and rates of fatty acid utilization. Clk2 phosphorylation of peroxisome proliferator–activated receptor γ coactivator (PGC-1α) disrupts its interaction with Mediator subunit 1, which leads to a suppression of PGC-1α activation of peroxisome proliferator–activated receptor α target genes in fatty acid oxidation and ketogenesis. These data demonstrate the importance of Clk2 in the regulation of fatty acid metabolism in vivo and suggest that inhibition of hepatic Clk2 could provide new therapies in the treatment of fatty liver disease.
Introduction
The liver is a key organ for the maintenance of lipid and energy homeostasis during feeding and fasting, as well as under conditions of dietary lipid overload. One of the central processes in hepatic lipid metabolism is the oxidation of fatty acids and the subsequent production of ketone bodies. During fasting, fatty acids are mobilized from peripheral adipose tissue to the liver, where they are subject to a multistep metabolic process, known as β-oxidation, in which fatty acids are oxidized to generate energy. Fatty acids are broken into acetyl-CoA, which is further oxidized through the tricarboxylic acid cycle or is used for the synthesis of ketone bodies (1). Ketone bodies constitute the predominant fuel for the brain during fasting, decreasing the need for glucose synthesis in the liver (2). From a standpoint of preventing or managing fatty liver disease and/or obesity, understanding the regulatory mechanisms of fatty acid oxidation is critical. The inability of fatty acids to be adequately oxidized in the liver causes accumulation of lipids, called hepatic steatosis or fatty liver, one of the most common and potentially serious metabolic diseases (3–5). Fatty liver can lead to more deleterious complications, such as insulin resistance, inflammation, fibrosis, and even the development of hepatocarcinoma (6,7).
Hepatic fatty acid oxidation and subsequent ketogenesis is controlled, at least in part, at the gene-expression level by a key transcription factor, peroxisome proliferator–activated receptor α (PPARα) (8–10), and its coactivator peroxisome proliferator–activated receptor γ coactivator (PGC-1α) (11,12). PPARα is expressed predominantly in the liver and to a lesser extent in other tissues (13). PPARα knockout mice exhibit fatty liver in the fasting state caused by decreased levels of fatty acid oxidation and ketogenesis (5,14). PGC-1α is a transcriptional coactivator that is essential for the fasting-induced expression of PPARα target genes in fatty acid oxidation and ketogenesis (12). Liver-specific PGC-1α heterozygous knockout mice phenocopy PPARα knockout mice (15), showing fatty liver in the fasted state and reduced expression of genes involved in fatty acid oxidation and ketogenesis. Despite the critical role of the PPARα/PGC-1α axis in the control of hepatic lipid oxidation, the upstream mechanisms regulating this transcriptional complex are largely unknown.
Cdc2-like kinase 2 (Clk2) is a dual-specificity kinase that belongs to the evolutionarily conserved Clk family (16–18). We recently identified Clk2 as a suppressor of PGC-1α. Clk2 suppresses the fasting-induced expression of genes involved in gluconeogenesis through PGC-1α as well as effects on insulin signaling (19,20). Clk2 is part of the hepatic response to refeeding, where it is phosphorylated and activated by insulin/Akt signaling (19,21). Once activated, Clk2 directly phosphorylates the serine/arginine-rich (SR) domain on PGC-1α, leading to the repression of PGC-1α activity on gluconeogenic gene expression (19). However, whether Clk2-mediated phosphorylation of PGC-1α affects its ability to regulate fatty acid oxidation and ketogenesis remains to be elucidated.
Here, we show that Clk2 regulates hepatic fatty acid oxidation and subsequent ketone body production by controlling the PPARα/PGC-1α transcriptional program. Expression of Clk2 in hepatocytes suppresses fatty acid oxidation, whereas knockdown of Clk2 increases fatty acid oxidation. These effects stem from Clk2 phosphorylation of the PGC-1α SR domain, which blocks the interaction between PGC-1α and Mediator subunit 1 (MED1). Because MED1 mediates assembly of the transcription initiation complex on promoters, the PGC-1α–MED1 interaction is indispensable for induction of PGC-1α target genes involved in fatty acid oxidation and ketogenesis. Indeed, liver-specific Clk2 knockout mice show increased fatty acid oxidation and ketogenesis during fasting when fed a high-fat diet (HFD). Our findings identify Clk2 as an important regulator of hepatic fat metabolism and provide insight into the mechanism by which Clk2 controls the activity of PGC-1α on fatty acid oxidation genes.
Research Design and Methods
Generation of Hepatic-Specific Clk2 Knockout Mice
A targeting plasmid was constructed using genomic DNA fragments from the C57BL/6 mouse strain. ES cell (C57BL/6 strain) electroporation, selection, and screening were performed by inGenious Targeting Laboratory. To create the liver-specific knockout (LKO) animal, Clk2flox/flox mice were crossed with C57BL/6 background albumin-Cre transgenic mice (The Jackson Laboratory) (Clk2flox/flox Alb-Cre+/−). Littermates carrying the floxed allele but not Cre were used as the control group (Clk2flox/flox Alb-Cre−/−). All experiments were performed in accordance with the Dana-Farber Cancer Institute’s Institutional Animal Care and Use Committee regulations.
Constructs, Reagents, and Cell Culture
pcDNA3-Flag or -HA–Clk2 constructs, PGC-1α, Clk2, and Clk2 short hairpin (sh)RNA adenoviruses were described previously (19). pcDNA3–Flag–PGC-1α, pcDNA–HA–PGC-1α, pSV-Sport-Flag-PPARα, pSV-Sport RXRα, PPAR response element (PPRE) x3-TK-luc, p4x–nuclear factor (NF)-κB–RE–luc, and pCMVβ-p300 were described previously (22). pcDNA3-Flag-PPARα was subcloned from pSV-Sport-Flag-PPARα. pWZLhygro-Flag-HA-MED1 was obtained from Addgene (23). pcDNA3–Flag–PGC-1α 6A and 11A mutants were generated by site-directed mutagenesis. Plasmid enhanced green fluorescent protein (GFP)–PGC-1α (547–659) was subcloned by PCR from pcDNA3–Flag–PGC-1α.
Rabbit anti-Clk2 was a gift from Axel Ullrich. We obtained Clk2 (NeoBioLab), Flag-M2-horseradish peroxidase (HRP) (Sigma-Aldrich), HA-HRP (Roche), Tubulin (Millipore), Lamin B1, glutathione-S-transferase (GST)-HRP, and GFP-HRP (Abcam), MED1 (Abnova), PGC-1α (H300), PPARα (sc-9000) (Santa Cruz), Akt, phospho-Akt (S473), and phosphor-Akt substrate (Cell Signaling).
Isolation of mouse primary hepatocytes and the transcriptional reporter assay using HEK293 cells were performed as described (19). Fatty acid oxidation assays were performed as described (24).
GST-Protein Interaction Assay
MED1 and Clk2 proteins were prepared from HEK293 cells transfected with pWZLhygro-Flag-HA-MED1 or infected with Flag-Clk2 adenovirus, respectively. GST–PGC-1α proteins were prepared from pLysS expressing pGEX-5x-2 PGC-1α constructs. Kinase reaction was performed as described (19).
Real-Time PCR, Immunoprecipitations, and Microarray Analysis
Quantitative real-time PCR and immunoprecipitations were performed as described (19). Chromatin immunoprecipitations (ChIP) were performed as described (25). Primer sequences are available on request. Microarray and gene set enrichment analyses were performed as described (26,27).
Results
Generation of Liver-Specific Clk2 Knockout Mice
Hepatic lipid accumulation represents a hallmark of the metabolic syndrome (3,7). However, the regulatory mechanisms of this metabolic process during diet-induced obesity, particularly related to fatty acid catabolism, are not completely understood. We previously identified Clk2 as a kinase suppressing hepatic glucose output (19), but whether Clk2 regulates lipid catabolism in dietary conditions of lipid overload was unknown. Thus, to assess the regulatory role of hepatic Clk2 in lipid catabolism, especially in diet-induced obesity, we generated LKO mice. We engineered a conditional allele of Clk2 with LoxP sites flanking exon 2 (Fig. 1A and B). After germline transmission and FLP recombination of the Neo cassette, we confirmed the presence of the targeted allele by PCR (Fig. 1C). To ablate Clk2 in the liver, we crossed the conditional Clk2 allele with a liver-specific Cre driver under control of the albumin promoter (28). In the liver, we observed substantial reduction of mRNA and protein levels of Clk2 by quantitative real-time PCR and Western blots, respectively (Fig. 1D and 1E). We found negligible Clk2 mRNA and protein in primary hepatocytes isolated from LKO mice (Fig. 1F and G), and mRNA of other Clks remained unchanged (Fig. 1D and F). LKO mice expressed normal levels of Clk2 in skeletal muscle, white fat, and brown fat (Fig. 1H), confirming the tissue-specific deletion of Clk2. LKO mice were born at the expected Mendelian ratios (data not shown), without any obvious anatomical or behavioral abnormalities. The generation of the liver-specific Clk2 knockout mouse provides us with a genetic mouse model to assess the regulatory role of this kinase on hepatic lipid metabolism in conditions of diet-induced obesity.
Figure 1.

Generation of liver-specific Clk2 knockout mice. A: Schematic representations of the targeting vector, the wild-type (WT) Clk2 allele, the targeted allele after homologous recombination, the floxed allele after FLP-mediated recombination of the targeted allele, and the null recombined allele after Cre-mediated recombination of the conditional allele. Filled triangles indicate LoxP sequences, open triangles indicate Frt sequences, and boxes indicate the exons of the Clk2 gene. The 5′ and 3′ Southern probes corresponding to sequences flanking the targeting vector arms are denoted by black bars. PCR primers flanking the targeting vector are denoted by small opposing arrows (P1 and P2). N, E, and H are NheI, EcoRI, and HpaI restriction sites, respectively. B: Southern blot analysis of genomic DNA from embryonic stem (ES) cells with homologous recombination with 5′ probe after NheI and HpaI digestion or 3′ probe after EcoRI digestion. The 15.7- and 11.5-kb bands (5′ probe), or the 14.5- and 6.4-kb bands (3′ probe), correspond to the WT or targeted (T) alleles, respectively. C: PCR analysis of mouse tail genomic DNA with primers (P1: 5′-agagaatatgggagtcctggaactgg-3′, and P2: 5′-gaagaggtggcaggtgttatctctga-3′). The 240-bp and 320-bp bands correspond to the WT or the floxed alleles, respectively. D: Relative mRNA expression of Clks from liver from the control (Cont) and Clk2 LKO mice (n = 4/each genotype). E: Western blot analysis of liver nuclear extracts from Cont and LKO mice, killed at 16 h fasted or 16 h fasted, followed by refeeding for 4 h. The arrows indicate the bands for Clk2. F: Relative mRNA expression of Clks in primary isolated hepatocytes from Cont and LKO mice (n = 3/each genotype). G: Western blot analysis of nuclear extracts from primary hepatocytes from Cont and LKO mice. Cells were cultured 16 h in a starvation media before treatment with 100 nmol/L insulin for 6 h. H: Relative mRNA expression of Clk2 from gastrocnemius muscle (SM), inguinal fat (WAT), and brown adipose tissue (BAT) from Cont and LKO mice (n = 4/each genotype). All values are expressed as mean ± SEM. Significance was determined by two-tailed unpaired Student t test. ★★★P < 0.001.
Liver-Specific Clk2 Knockout Increases Fatty Acid Oxidation and Ketogenesis in Mice Fed an HFD
Our previous observations that Clk2 kinase activity and protein levels were tightly linked (19) led us to first compare Clk2 protein levels in wild-type mice fed a normal chow diet (NCD) and an HFD, a model of hepatic lipid accumulation and insulin resistance (Fig. 2A). Under an NCD, Clk2 protein is low in fasting but increases in the fed state. Interestingly, in the diet-induced obese mice, Clk2 protein remained elevated during fed and fasted periods, which is consistent with the fact that these obese mice exhibit elevated fasted Akt activity (Fig. 2A). Because our previous data showed that Clk2 is a direct suppressor of PGC-1α, we predicted that LKO mice would display an altered lipid metabolic response due to the hyperactivity of PGC-1α. Although we observed no overt metabolic phenotype in LKO mice when fed the NCD (Supplementary Figs. 1, 2, and 3), we speculated that the aberrantly chronic high levels of Clk2 in the livers of mice fed an HFD might play a role in the hepatic lipid response to this diet. Indeed, among the metabolic pathways that were affected in LKO mice versus controls, we found a concerted upregulation of genes linked to fatty acid oxidation and ketogenesis (Fig. 2B–E). Consistently, there was a significant elevation of serum β-hydroxybutyrate levels (Fig. 2F), an indicator of increased fatty acid oxidation and ketogenesis, in LKO mice. We observed a significant decrease in the respiratory exchange ratio during fasting (Fig. 2G), together indicating that LKO mice are oxidizing fatty acids to CO2 at a higher rate. There were no significant changes in body weight gain, food intake, locomotor activity, and oxygen consumption between the genotypes (Supplementary Figs. 4 and 5). Consequent to increased fatty acid oxidation, hepatic triglyceride content was lower in LKO mice (Fig. 2H). In contrast to fatty acid oxidation and ketogenic genes, there were no significant changes in VLDL production or lipogenic gene expression between the genotypes (Supplementary Fig. 6). These data show that an HFD associated with insulin resistance results in constitutively high fasting/fed expression of hepatic Clk2 that restricts the capacity of the liver to oxidize fatty acids. As a consequence, genetic deficiency of Clk2 in the liver ameliorates liver lipid accumulation through increased fatty acid oxidation and ketogenesis.
Figure 2.

Increased fatty acid oxidation and ketogenesis in Clk2 LKO mice fed an HFD. A: Clk2 protein is induced by the HFD. Western blot analysis of liver nuclear extracts (NE) and cytosolic extracts (CE) from mice fed an NCD or an HFD for 12 weeks, harvested when fasted or refed. The arrows indicate the bands for Clk2. B: Gene set enrichment analysis of microarray data from livers of control or Clk2 LKO mice showing that genes involved in fatty acid metabolism are induced in Clk2 LKO mice. Male adult control (Cont) and LKO mice (8 weeks old) were fed an HFD (60% kcal fat, D12492; Research Diets) for 12 weeks before experiments. Increased expression of genes involved in fatty acid oxidation (C) and ketogenesis (D) in Clk2 LKO mice. Values are expressed as mean ± SEM (n = 6–8). Significance was determined by two-tailed unpaired Student t test. E: Increased protein levels of genes involved in fatty acid oxidation and ketogenesis in Clk2 LKO mice. F: Increased fasting serum β-hydroxybutyrate concentration in Clk2 LKO mice. Values are expressed as mean ± SEM (n = 6–8). Significance was determined by two-tailed unpaired Student t test. G: Decreased fasting respiratory exchange ratio (RER) of LKO mice (n = 8/each genotype). The difference in RER during 24 h, from 8 to 32 h after food deprivation, was determined by two-way ANOVA. H: Decreased fasting liver triglyceride (TG) concentration in Clk2 LKO mice. Values are expressed as mean ± SEM (n = 6–8). Significance was determined by two-tailed unpaired Student t test. ★P < 0.05; ★★P < 0.01.
Clk2 Suppresses Fatty Acid Oxidation and Ketogenesis in the Liver
Consistent with upregulation of β-oxidation and ketogenesis in LKO mice, adenoviral-mediated expression of Clk2 in the liver dramatically decreased expression of the genes involved in fatty acid oxidation and ketogenesis in mRNA and protein levels (Fig. 3A–C). Expression of a kinase dead mutant of Clk2, K192R (19), largely had minor effects on the expression of these genes, suggesting that the suppressive effects of Clk2 depend on kinase activity. In agreement with this pattern of gene expression, serum β-hydroxybutyrate concentrations were significantly lower in mice that received the Clk2 adenovirus (Fig. 3D), and there was a marked increase in liver triglyceride content in the Clk2-expressed mice (Fig. 3E). Taken together, and in contrast to Clk2 deficiency, these results indicate that ectopic expression of Clk2 in the liver is sufficient to suppress hepatic fatty acid oxidation and ketogenesis, leading to the accumulation of liver triglycerides and decreased serum concentrations of ketone bodies.
Figure 3.

Clk2 suppresses expression of genes involved in fatty acid oxidation (A) and ketogenesis (B) in liver. Quantitative PCR analysis from mice infected with GFP (n = 5), Clk2 (n = 6), or K192R (n = 3) adenoviruses after an overnight fast. C: Clk2 decreases protein levels of genes involved in fatty acid oxidation and ketogenesis. Western blot analysis of whole cell extracts from mice infected with GFP, Clk2, or K192R adenoviruses. D: Clk2 decreases serum ketone body concentration. Serum β-hydroxybutyrate levels from mice infected with GFP, Clk2, or K192R adenoviruses after an overnight fast. E: Clk2 induces hepatic steatosis. Liver triglyceride (TG) concentration from mice infected with GFP, Clk2, or K192R adenoviruses after an overnight fast. All values are expressed as mean ± SEM. Significance was determined by two-tailed unpaired Student t test. ★P < 0.05; ★★P < 0.01; ★★★P < 0.001.
Clk2 Suppresses Fatty Acid Oxidation in Cultured Hepatocytes
We assessed whether the effect of Clk2 on hepatic fatty acid metabolism is cell-autonomous by performing adenoviral-mediated gain- and loss-of-function experiments in primary isolated mouse hepatocytes. Ectopic expression of wild-type Clk2, but not K192R mutant, suppressed the expression of fatty acid oxidation genes (Fig. 4A), suggesting that Clk2 kinase activity is required for this repression. Moreover, Clk2 reduced rates of fatty acid oxidation in hepatocytes, as measured by the conversion of radiolabeled oleic acid to CO2 (Fig. 4B). Consistent with the suppressive effect of Clk2 on fatty acid oxidation, shRNA-mediated knockdown of Clk2 (Fig. 4C) caused upregulation of fatty acid oxidation genes (Fig. 4D) and of fatty acid oxidation (Fig. 4E). These results suggest that Clk2 suppresses fatty acid oxidation by controlling gene expression in hepatocytes.
Figure 4.

A: Clk2 suppresses expression of fatty acid oxidation genes in cultured hepatocytes. Quantitative (q)PCR analysis in primary hepatocytes infected with GFP, Clk2, or K192R adenoviruses (n = 3). B: Clk2 suppresses the fatty acid oxidation rate. Oleic acid oxidation was measured using primary hepatocytes infected with GFP, Clk2, or K192R, with or without PGC-1α adenoviruses (n = 5). C: Clk2 protein is induced by insulin. Western blot analysis of whole cell extracts from primary hepatocytes infected with control shRNA or shClk2 adenoviruses, harvested at indicated times after treatment of 100 nmol/L insulin. D and E: Clk2 knockdown increases gene expression and rates of fatty acid oxidation. qPCR analysis (n = 3) (D) and oleic acid oxidation rate (n = 5) (E) in primary hepatocytes infected with control shRNA adenovirus or one of two shClk2 adenoviruses (#2 and #4). Cells were harvested for qPCR or used for fatty acid oxidation assay after overnight treatment with 100 nmol/L insulin. All values are expressed as mean ± SEM. Significance was determined by two-tailed unpaired Student t test. ★P < 0.05; ★★P < 0.01; ★★★P < 0.001.
Clk2 Suppresses PGC-1α/PPARα Transcriptional Activity Through the PGC-1α SR Domain
Previous works have shown that the PGC-1α/PPARα transcriptional axis is one of the primary regulators of genes involved in hepatic fatty acid oxidation and ketogenesis (9–12). Therefore, we hypothesized that Clk2 could regulate hepatic fatty acid oxidation and ketogenesis through PGC-1α/PPARα. Indeed, expression of Clk2 potently suppressed PGC-1α coactivation of PPARα on a reporter gene construct (Fig. 5A). Of note, this suppressive effect was not observed in K192R-transfected cells (Fig. 5A) and was rescued by treatment with the Clk inhibitor TG003 (Supplementary Fig. 7), indicating the effect is dependent on Clk2 kinase activity. We previously showed that Clk2 phosphorylates the SR domain on PGC-1α (19). To assess the role of Clk2 phosphorylation of the PGC-1α SR domain on its ability to coactivate PPARα, we compared the activity of wild-type PGC-1α with a mutant PGC-1α lacking the SR domain (ΔSR) (Fig. 5B). When expressed at the same protein level, the ΔSR PGC-1α construct could not coactivate PPARα transcriptional activity to the level of wild-type PGC-1α (Fig. 5C). Importantly, in contrast to wild-type PGC-1α, expression of Clk2 did not repress ΔSR activity (Fig. 5C). Because SR domains function as phosphorylation-sensitive protein-to-protein interaction platforms in splicing factors (29), we hypothesized Clk2 phosphorylation may control the interaction between PGC-1α and a potential cofactor that mediates PGC-1α activity. To test this, we performed a competition assay by supplying the PGC-1α SR domain (GFP-SR) in trans (Fig. 5B). Expression of GFP-SR caused a dose-dependent suppression of full-length PGC-1α activity (Fig. 5D and E). This suppressive effect of GFP-SR was specific to full-length PGC-1α, because expression of GFP-SR did not suppress ΔSR or NF-κB transcriptional activity (Fig. 5F and G). Taken together, these results suggest that Clk2 controls PGC-1α transcriptional activity through its SR domain, which is required for full PGC-1α coactivation of PPARα.
Figure 5.

Clk2 suppresses PPARα/PGC-1α transcriptional activity through the PGC-1α SR domain. A: Clk2, but not K192R, strongly suppresses PGC-1α to coactivate PPARα transcription. The PPRE-luciferase reporter, RXRα, and indicated constructs were used for the luciferase assay in HEK293 cells. B: Domain map of PGC-1α, ΔSR mutant, and GFP–PGC-1α (547–659) (shown as GFP-SR). C: The ΔSR mutant is less active in PPARα transcription activity compared with wild-type and is resistant to Clk2. Luciferase transcription assay using the PPRE-luciferase reporter, RXRα, and indicated constructs. Western blot analysis showing expressed full-length PGC-1α and ΔSR. D and E: GFP-SR blocks full-length PGC-1α activity on PPARα transcription. D: Western blot analysis of GFP-SR, PPARα, and PGC-1α. RRM, RNA-recognition motif; WT, wild-type. E: Luciferase transcription assay using PPRE-luciferase reporter, RXRα, and indicated constructs. Plasmid-enhanced GFP empty plasmid was used to correct the amount of the transfection of the GFP-fusion protein expressing plasmid. F: GFP-SR blocks the activity of full-length PGC-1α but not ΔSR mutant. Luciferase transcription assay using PPRE-luciferase reporter, RXRα, and indicated constructs. G: GFP-SR does not affect NF-κB transcription activity. Luciferase transcription assay using NF-κB response element-luciferase reporter and GFP-SR. Tumor necrosis factor (TNF)α (1 nmol/L) was added to the media for 16 h before harvest. All values are expressed as mean ± SEM (n = 3).
Clk2 Phosphorylation of PGC-1α Disrupts the Physical Interaction Between PGC-1α and the Transcriptional Coactivator MED1
MED1, also called TRAP220, has been reported to be an important factor for the ability of PGC-1α to coactivate transcription of target genes by anchoring PGC-1α to the Mediator complex (30,31). Consistent with these reports, MED1 potentiated PGC-1α coactivation of PPARα transcription (Fig. 6A). MED1 did not activate expression of the PPARα reporter in the absence of PGC-1α (Fig. 6A). Interestingly, expression of Clk2 completely abrogated the MED1-dependent activation of PGC-1α (Fig. 6A). Previous work has shown that MED1 binds to the PGC-1α SR domain (31). Because Clk2 phosphorylates this domain (19) and the phosphorylation of SR domains has been shown to control their protein-binding patterns (32,33), we decided to perform coimmunoprecipitation experiments to test if the interaction between PGC-1α and MED1 was affected by Clk2 kinase activity. We found that there was a strong interaction between full-length PGC-1α and MED1, which was abrogated by expression of Clk2 (Fig. 6B). In contrast, the ΔSR mutant showed minimal interaction with MED1. These results suggest that Clk2 disrupts the PGC-1α and MED1 interaction. This effect is specific to MED1, because Clk2 did not affect the interactions between PGC-1α and PPARα (Supplementary Fig. 8A) or between PGC-1α and p300, a histone acetyltransferase indispensable for PGC-1α activity (22) (Supplementary Fig. 8B), both of which bind to regions on PGC-1α other then the SR domain (11). In addition, Clk2 had no effect on the ability of PPARα to bind to its DNA recognition motif in ChIP experiments (Supplementary Fig. 8C).
Figure 6.

Clk2 phosphorylation of PGC-1α disrupts the interaction between PGC-1α and the transcriptional coactivator MED1. A: MED1 potentiates PGC-1α/PPARα transcription activity. Luciferase transcription assay using PPRE-luciferase reporter, RXRα, and indicated constructs. B: PGC-1α, but not ΔSR, binds to MED1, and this interaction is blocked by expression of Clk2. Western blot analysis of Flag immunoprecipitates (Flag-IP) and whole cell extracts (Input) of HEK293 cells transfected with indicated constructs. C: Phosphorylated PGC-1α loses its binding ability to MED1. In the GST pull-down assay of GST or GST–PGC-1α (551–635) protein, the indicated amount of GST–PGC-1α (551–635) was pretreated with recombinant Clk2 or vehicle, washed, and incubated with purified MED1 protein before the pull-down assay. GST fusion proteins and bound MED1 were detected by Western blot using anti-GST and anti-MED1 antibody. Phosphorylation was detected by anti–phospho-Akt substrate (RXXS*/T*) antibody. D: Eleven phosphorylation sites were identified (red letters with amino acid numbers) by tandem mass spectrometry on a partial tryptic digest of GST–PGC-1α (551–635) protein pretreated with recombinant Clk2. The protein sequence coverage was 75% (blue letters). Six serine residues (568, 570, 572, 576, 578, and 580) or all the 11 serines phosphorylated by Clk2 are mutated to alanine (PGC-1α 6A or PGC-1α 11A, respectively). E: PGC-1α 11A mutant is resistant to Clk2. Luciferase transcription assay using PPRE-luciferase reporter, RXRα, and indicated constructs. Expressed protein levels were determined by Western blot. F: PGC-1α 11A mutant interacts with PGC-1α in the presence of Clk2. Western blot analysis of HA immunoprecipitates (HA-IP) and whole cell extracts (Input) of HEK293 cells transfected with indicated constructs. G: Decreased PGC-1α and MED1 interaction in liver from HFD-fed control mice but not in LKO mice. Western blot analysis of PGC-1α immunoprecipitates (IP) and liver nuclear extracts (Input) from the control or LKO mice fed an NCD or an HFD. H: Decreased MED1 promoter occupancy on the CPT1a and HMGCS2 genes in liver from HFD-fed control mice but not in LKO mice. ChIP of MED1 and PPARα from control or LKO mice fed an NCD or HFD. All values are expressed as mean ± SEM (n = 3). Significance was determined by two-tailed unpaired Student t test (E) or one-way ANOVA, followed by Fisher least significant difference (H). ★P < 0.05; ★★★P < 0.001.
Next, we tested if the effect of Clk2 on the PGC-1α–MED1 interaction was dependent on phosphorylation by performing in vitro binding assays using purified MED1 protein and GST–PGC-1α (551–635) fusion protein, with or without pretreatment with recombinant Clk2. Consistent with the previous observation (31), GST–PGC-1α (551–635) strongly interacted with MED1 protein (Fig. 6C). However, pretreatment with Clk2, resulting in a phosphorylated GST–PGC-1α (551–635), dramatically reduced this interaction (Fig. 6C), indicating that phosphorylation of the PGC-1α SR domain directly disrupts the PGC-1α and MED1 interaction. Mass spectrometric analysis revealed that Clk2 phosphorylates 11 serine residues on the PGC-1α SR domain but no threonine or tyrosine residues (Fig. 6D and Supplementary Fig. 9). This was consistent with previous studies showing serine residues within SR domains of SR proteins are heavily phosphorylated by SR protein kinases, including Clks (34), and this controls protein-to-protein interactions (35).
To assess the role that phosphorylation of these serines has on the ability of PGC-1α to interact with MED1 and coactivate PPARα, we generated PGC-1α constructs where these residues were mutated to alanine (PGC-1α 6A and 11A; Fig. 6D). The PGC-1α 6A mutant was tested because these residues are located in or close to the 571–590 region, which was required for PGC-1α and MED1 interaction (Supplementary Fig. 10). The 6A and 11A PGC-1α mutants had similar levels of expression and ability to coactivate PPARα as wild-type PGC-1α; however, the 6A mutant was less sensitive to, and the 11A mutant was completely resistant to, Clk2-mediated suppression of PGC-1α transcriptional activity (Fig. 6E). Consistent with this, in a coimmunoprecipitation experiment, the PGC-1α 11A mutant remained bound to MED1 even in the presence of Clk2 (Fig. 6F). These results indicate that phosphorylation of 11 serine residues on the PGC-1α SR domain, by Clk2, abrogates the PGC-1α–MED1 interaction and represses the ability of PGC-1α to coactivate PPARα.
Next, we tested if the PGC-1α–MED1 interaction was regulated in endogenous proteins, in vivo, by performing coimmunoprecipitation experiments with liver extracts from control and LKO mice fed an NCD or an HFD. We found that MED1 efficiently coimmunoprecipitates with endogenous PGC-1α in mice fed an NCD (Fig. 6G). Interestingly, in liver extracts from control mice fed an HFD, conditions in where Clk2 is elevated, we observed a dramatic reduction in the amount of MED1 that coimmunoprecipitates with PGC-1α (Fig. 6G). However, in LKO mice fed an HFD, we observed a strong PGC-1α–MED1 interaction. Furthermore, ChIP experiments revealed that MED1 promoter occupancy on carnitine palmitoyltransferase 1a (CPT1a) and 3-hydroxy-3-methylglutaryl-CoA synthase 2 (HMGCS2) genes was reduced in livers from control mice fed an HFD but not in LKO mice (Fig. 6H). In agreement with the in vitro experiments (Supplementary Fig. 8A and C), PPARα chromatin occupancy is not affected by the diet or the genotype (Fig. 6H). Taken together, these results suggest that elevated levels of Clk2 in the livers of HFD-fed mice leads to the disruption of the PGC-1α–MED1 interaction and reduced MED1 recruitment to PPARα/PGC-1α promoter target genes, resulting in reduced expression of genes involved in fatty acid oxidation and ketogenesis.
Clk2 Regulates Fatty Acid Oxidation and Ketogenesis Through the Transcriptional Coactivators PGC-1α and MED1
Finally, we tested whether the suppressive effect of Clk2 on endogenous PPARα target gene expression was dependent on PGC-1α and MED1 by using stable lentiviral expression of shRNA constructs to knockdown PGC-1α and MED1 in HepG2 cells (Fig. 7A and B). PGC-1α and MED1 knockdown resulted in decreased gene expression of CPT1a and HMGCS2 (Fig. 7C) and ketone body production (Fig. 7D). As expected, expression of Clk2 caused a reduction in CPT1a and HMGCS2 gene expression as well as ketone body production (Fig. 7C and D). Importantly expression of Clk2 did not result in further suppression of CPT1a, HMGCS2, and ketone body formation in cells with PGC-1α or MED1 knockdown (Fig. 7C and D). These data indicate PGC-1α and MED1 are both necessary to mediate the suppressive effects of Clk2 on fatty acid oxidation and ketogenesis.
Figure 7.
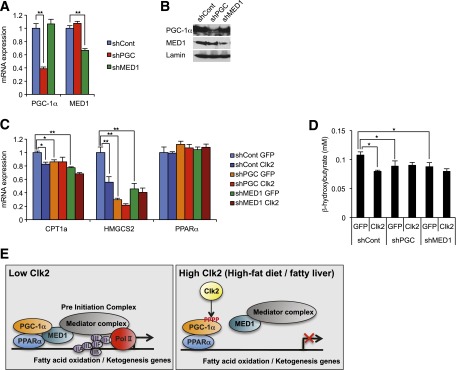
Clk2 regulates fatty acid oxidation and ketogenesis through the transcriptional coactivators PGC-1α and MED1. A and B: Stable shPGC-1α and shMED1-expressing HepG2 cells. Relative mRNA expression levels (A) and protein levels (B) of PGC-1α and MED1 in HepG2 cells. C and D: The suppressive effect of Clk2 on CPT1a and HMGCS2 expressions are dependent on PGC-1α and MED1. Relative mRNA expression levels of CPT1a, HMGCS2, and PPARα (C) and β-hydroxybutyrate production (D) in stable shControl, shPGC-1α, or shMED1-expressing HepG2 cells infected with GFP or Clk2 adenoviruses. All values are expressed as mean ± SEM (n = 4). Significance was determined by one-way ANOVA, followed by the Tukey post hoc test (A, C) or the Fisher least significant difference (D). ★P < 0.05; ★★P < 0.01. E: Proposed model illustrating Clk2-mediated suppression of PGC-1α and fatty acid oxidation by inhibiting PGC-1α from preinitiation complex assembly with Mediator complex, RNA polymerase II (Pol II), and general transcription factors.
Discussion
Fatty acid oxidation is a crucial pathway for gluconeogenesis and ketogenesis in the liver, allowing for the maintenance of energy homeostasis during fasting. Insulin and glucagon control fed/fasting responses, respectively, including multiple steps of hepatic fatty acid oxidation, and the dysregulation of these hormone responses are implicated in metabolic diseases such as obesity, fatty liver disease, and diabetes. PGC-1α is a critical regulator of fatty acid oxidation in response to these hormones (11,36,37). Although the hormonal regulation by which fed/fasting controls PGC-1α activity and fatty acid oxidation have been extensively studied (38–40), the regulatory components by which fatty acid oxidation changes during dietary-induced obesity are largely unknown. In this report, we identify the insulin-regulated Clk2 kinase as an important regulator of hepatic fatty acid oxidation, particularly in conditions of dietary lipid overload. Mechanistically, we demonstrate that Clk2 suppresses hepatic fatty acid oxidation and ketogenesis by phosphorylating PGC-1α and disrupting the interaction between PGC-1α and the component of the Mediator complex, MED1 (Fig. 7E).
Importantly, on an HFD and as a consequence of insulin resistance, hepatic Clk2 is constitutively high in both fed and fasted states, resulting in reduced levels of fatty acid oxidation and ketogenesis and leading to hepatic lipid accumulation and fatty liver. Deficiency of Clk2 results in increased rates of fatty acid oxidation and ketone body production that ameliorates hepatic triglyceride accumulation. These data suggest that diet-induced obesity causes pathological hepatic lipid excess due, at least in part, to the effect of insulin resistance and subsequent constitutive elevation of Clk2 as a suppressor of fatty acid oxidation and ketogenesis. Inhibition of Clk2 could, therefore, be of interest as a therapeutic avenue in the protection from fatty liver diseases.
The increased fatty acid oxidation phenotype observed in Clk2 LKO mice was mainly revealed upon HFD feeding. In mice fed an NCD, hepatic Clk2 protein level was low in the fasted state and increased upon feeding (Fig. 2A). Under these conditions, deficiency of Clk2 has minor effects on hepatic glucose and lipid metabolism (Supplementary Fig. 3), indicating that additional regulatory mechanisms compensate for the chronic lack of this kinase during the fed state. Interestingly, short-term manipulation of Clk2 alters PGC-1α activity on hepatic gluconeogenesis (19) and fatty acid oxidation (Fig. 7E) in mice, and Clk2 suppresses several PGC-α–dependent pathways, including PPARα (Fig. 4 and 5), hepatocyte NF 4α, and Forkhead box protein O1, but not nuclear respiratory factor 1, (19) in in vitro assays. However, regulation of fatty acid oxidation seemed more sensitive than gluconeogenesis to constitutive genetic deletion of Clk2 in the liver. Although there was an increase in G6Pase and PEPCK gene expression in the Clk2 LKO mice fed an HFD (Supplementary Fig. 11), the mild changes in gluconeogenic gene expression were insufficient to affect glucose metabolism, including glycemia, glucose tolerance, or insulin sensitivity in vivo (Supplementary Fig. 12). One possible explanation might be that the regulation and compensation of glucose metabolism is more fine-tuned compared with lipid metabolism. In fact, a similar observation occurs in the liver-specific Sirt1 knockout mice that exhibit hepatic lipid accumulation and decrease in the expression of fatty acid oxidation genes when fed an HFD, without exhibiting major defects in glucose metabolism (41). Moreover, PGC-1α knockout mice also show a decrease in fatty acid oxidation and ketogenesis but not hypoglycemia (15).
Mechanistically, Clk2 phosphorylates multiple serine residues on the PGC-1α SR domain leading to the repression of PGC-1α activity through dissociation from MED1, a component of the Mediator complex. Interestingly, Akt, S6 kinase 1 (S6K1), and Clk2, downstream kinases of insulin signaling, suppress PGC-1α activity through phosphorylation of the SR domain, where residues are evolutionarily highly conserved (Supplementary Fig. 13) (11). On one hand, Akt is reported to suppress gluconeogenesis and fatty acid oxidation through PGC-1α inhibition and phosphorylation of S570 (39). On the other hand, S6K1 predominantly represses hepatic gluconeogenesis by phosphorylating S568 and S572 on PGC-1α and by disrupting the interaction with hepatocyte NF 4α (42). Interestingly, using mass spectrometry analysis, we have identified multiple serine residues phosphorylated by Clk2, including S568, S570, S572, and nine other serines on the SR domain, suggesting that Clk2 might compensate some of the function of these other kinases and, vice versa, these kinases can also compensate Clk2 on PGC-1α function. Although the precise metabolic control is as-of-yet unclear, it is conceivable that there is a timely and dynamic activation of these kinases to suppress fasting metabolic programs during feeding and upon high dietary nutrient conditions; for example, feeding first activates S6K1 (43), then Akt, which in turn activates Clk2 (19,21).
The Mediator plays a crucial role in assembling the preinitiation complex, which consists of RNA polymerase II and the general transcription factors (30). Although the Mediator has already been shown to bind to the SR domain of PGC-1α by MED1 and to be indispensable for PGC-1α activity (31), the physiologic implications of the interactions between MED1 and PGC-1α have been largely unknown. In this regard, we demonstrate for the first time that Clk2 phosphorylates residues of the PGC-1α SR domain and disrupts MED1 docking, leading to the suppression of PGC-1α transcriptional activity. This provides a clear example of how signaling pathways define specific metabolic gene programs to adapt to nutrient responses.
In summary, the current study provides direct evidence not only for metabolic function of Clk2 in hepatic fatty acid oxidation but also for a new regulatory mechanism of PGC-1α activity during fed/fasting transitions and dietary lipid overload. Our findings suggest that inhibition of Clk2 could serve as a novel therapeutic target for the treatment of fatty liver disease and its associated complications.
Article Information
Acknowledgments. Special thanks are given to all members of the Puigserver Laboratory for discussions and advice. The authors thank Dr. Axel Ullrich (Max Planck Institute for Biochemistry, Germany) for providing the antibody against Clk2, James Lo (Harvard Medical School, Boston, MA) for assistance in the mouse respiratory exchange ratio experiment, and Francisca Vazquez (Broad Institute of MIT and Harvard, Boston, MA) for assistance in gene set enrichment analyses.
Funding. M.T. was partly supported by postdoctoral fellowships from the American Heart Association, the American Diabetes Association, and the Manpei Suzuki Diabetes Foundation. J.A.H. was partly supported by a predoctoral fellowship from the American Heart Association. This work was supported by the American Diabetes Association and National Institutes of Health/National Institute of Diabetes and Digestive and Kidney Diseases 1-R01-DK-089883-01A1.
Duality of Interest. No potential conflicts of interest relevant to this article were reported.
Author Contributions. M.T. designed the study, conducted experiments, and wrote the manuscript. J.T.R. designed the Clk2 targeting and reviewed and edited the manuscript. J.A.H. helped design the study and reviewed and edited the manuscript. Y.L. conducted the HFD study with wild-type mice. M.P.J. and S.P.G. conducted phosphorylation mapping with mass spectrometry. P.P. designed the study and wrote the manuscript. P.P. is the guarantor of this work and, as such, had full access to all the data in the study and takes responsibility for the integrity of the data and the accuracy of the data analysis.
Footnotes
This article contains Supplementary Data online at http://diabetes.diabetesjournals.org/lookup/suppl/doi:10.2337/db13-1304/-/DC1.
References
- 1.McGarry JD, Foster DW. Regulation of hepatic fatty acid oxidation and ketone body production. Annu Rev Biochem 1980;49:395–420 [DOI] [PubMed] [Google Scholar]
- 2.Cahill GF., Jr Fuel metabolism in starvation. Annu Rev Nutr 2006;26:1–22 [DOI] [PubMed] [Google Scholar]
- 3.Neuschwander-Tetri BA, Caldwell SH. Nonalcoholic steatohepatitis: summary of an AASLD Single Topic Conference. Hepatology 2003;37:1202–1219 [DOI] [PubMed] [Google Scholar]
- 4.Tolwani RJ, Hamm DA, Tian L, et al. Medium-chain acyl-CoA dehydrogenase deficiency in gene-targeted mice. PLoS Genet 2005;1:e23. [DOI] [PMC free article] [PubMed] [Google Scholar]
- 5.Leone TC, Weinheimer CJ, Kelly DP. A critical role for the peroxisome proliferator-activated receptor alpha (PPARalpha) in the cellular fasting response: the PPARalpha-null mouse as a model of fatty acid oxidation disorders. Proc Natl Acad Sci U S A 1999;96:7473–7478 [DOI] [PMC free article] [PubMed] [Google Scholar]
- 6.Chiang DJ, Pritchard MT, Nagy LE. Obesity, diabetes mellitus, and liver fibrosis. Am J Physiol Gastrointest Liver Physiol 2011;300:G697–G702 [DOI] [PMC free article] [PubMed] [Google Scholar]
- 7.Pascale A, Pais R, Ratziu V. An overview of nonalcoholic steatohepatitis: past, present and future directions. J Gastrointestin Liver Dis 2010;19:415–423 [PubMed] [Google Scholar]
- 8.Rakhshandehroo M, Knoch B, Muller M, Kersten S. Peroxisome proliferator-activated receptor alpha target genes. PPAR Res 2010;2010:612089 [DOI] [PMC free article] [PubMed]
- 9.Hsu MH, Savas U, Griffin KJ, Johnson EF. Identification of peroxisome proliferator-responsive human genes by elevated expression of the peroxisome proliferator-activated receptor alpha in HepG2 cells. J Biol Chem 2001;276:27950–27958 [DOI] [PubMed] [Google Scholar]
- 10.Desvergne B, Michalik L, Wahli W. Transcriptional regulation of metabolism. Physiol Rev 2006;86:465–514 [DOI] [PubMed] [Google Scholar]
- 11.Puigserver P, Spiegelman BM. Peroxisome proliferator-activated receptor-gamma coactivator 1 alpha (PGC-1 alpha): transcriptional coactivator and metabolic regulator. Endocr Rev 2003;24:78–90 [DOI] [PubMed] [Google Scholar]
- 12.Vega RB, Huss JM, Kelly DP. The coactivator PGC-1 cooperates with peroxisome proliferator-activated receptor alpha in transcriptional control of nuclear genes encoding mitochondrial fatty acid oxidation enzymes. Mol Cell Biol 2000;20:1868–1876 [DOI] [PMC free article] [PubMed] [Google Scholar]
- 13.Pyper SR, Viswakarma N, Yu S, Reddy JK. PPARalpha: energy combustion, hypolipidemia, inflammation and cancer. Nucl Recept Signal 2010;8:e002. [DOI] [PMC free article] [PubMed] [Google Scholar]
- 14.Hashimoto T, Cook WS, Qi C, Yeldandi AV, Reddy JK, Rao MS. Defect in peroxisome proliferator-activated receptor alpha-inducible fatty acid oxidation determines the severity of hepatic steatosis in response to fasting. J Biol Chem 2000;275:28918–28928 [DOI] [PubMed] [Google Scholar]
- 15.Estall JL, Kahn M, Cooper MP, et al. Sensitivity of lipid metabolism and insulin signaling to genetic alterations in hepatic peroxisome proliferator-activated receptor-gamma coactivator-1alpha expression. Diabetes 2009;58:1499–1508 [DOI] [PMC free article] [PubMed] [Google Scholar]
- 16.Duncan PI, Stojdl DF, Marius RM, Scheit KH, Bell JC. The Clk2 and Clk3 dual-specificity protein kinases regulate the intranuclear distribution of SR proteins and influence pre-mRNA splicing. Exp Cell Res 1998;241:300–308 [DOI] [PubMed] [Google Scholar]
- 17.Hanes J, von der Kammer H, Klaudiny J, Scheit KH. Characterization by cDNA cloning of two new human protein kinases. Evidence by sequence comparison of a new family of mammalian protein kinases. J Mol Biol 1994;244:665–672 [DOI] [PubMed] [Google Scholar]
- 18.Nayler O, Schnorrer F, Stamm S, Ullrich A. The cellular localization of the murine serine/arginine-rich protein kinase CLK2 is regulated by serine 141 autophosphorylation. J Biol Chem 1998;273:34341–34348 [DOI] [PubMed] [Google Scholar]
- 19.Rodgers JT, Haas W, Gygi SP, Puigserver P. Cdc2-like kinase 2 is an insulin-regulated suppressor of hepatic gluconeogenesis. Cell Metab 2010;11:23–34 [DOI] [PMC free article] [PubMed] [Google Scholar]
- 20.Rodgers JT, Vogel RO, Puigserver P. Clk2 and B56β mediate insulin-regulated assembly of the PP2A phosphatase holoenzyme complex on Akt. Mol Cell 2011;41:471–479 [DOI] [PMC free article] [PubMed] [Google Scholar]
- 21.Nam SY, Seo HH, Park HS, et al. Phosphorylation of CLK2 at serine 34 and threonine 127 by AKT controls cell survival after ionizing radiation. J Biol Chem 2010;285:31157–31163 [DOI] [PMC free article] [PubMed] [Google Scholar]
- 22.Puigserver P, Adelmant G, Wu Z, et al. Activation of PPARgamma coactivator-1 through transcription factor docking. Science 1999;286:1368–1371 [DOI] [PubMed] [Google Scholar]
- 23.Ge K, Guermah M, Yuan CX, et al. Transcription coactivator TRAP220 is required for PPAR gamma 2-stimulated adipogenesis. Nature 2002;417:563–567 [DOI] [PubMed] [Google Scholar]
- 24.Gerhart-Hines Z, Rodgers JT, Bare O, et al. Metabolic control of muscle mitochondrial function and fatty acid oxidation through SIRT1/PGC-1alpha. EMBO J 2007;26:1913–1923 [DOI] [PMC free article] [PubMed] [Google Scholar]
- 25.Blättler SM, Cunningham JT, Verdeguer F, et al. Yin Yang 1 deficiency in skeletal muscle protects against rapamycin-induced diabetic-like symptoms through activation of insulin/IGF signaling. Cell Metab 2012;15:505–517 [DOI] [PMC free article] [PubMed] [Google Scholar]
- 26.Blättler SM, Verdeguer F, Liesa M, et al. Defective mitochondrial morphology and bioenergetic function in mice lacking the transcription factor Yin Yang 1 in skeletal muscle. Mol Cell Biol 2012;32:3333–3346 [DOI] [PMC free article] [PubMed] [Google Scholar]
- 27.Subramanian A, Tamayo P, Mootha VK, et al. Gene set enrichment analysis: a knowledge-based approach for interpreting genome-wide expression profiles. Proc Natl Acad Sci U S A 2005;102:15545–15550 [DOI] [PMC free article] [PubMed] [Google Scholar]
- 28.Postic C, Shiota M, Niswender KD, et al. Dual roles for glucokinase in glucose homeostasis as determined by liver and pancreatic beta cell-specific gene knock-outs using Cre recombinase. J Biol Chem 1999;274:305–315 [DOI] [PubMed] [Google Scholar]
- 29.Long JC, Caceres JF. The SR protein family of splicing factors: master regulators of gene expression. Biochem J 2009;417:15–27 [DOI] [PubMed] [Google Scholar]
- 30.Malik S, Roeder RG. The metazoan Mediator co-activator complex as an integrative hub for transcriptional regulation. Nat Rev Genet 2010;11:761–772 [DOI] [PMC free article] [PubMed] [Google Scholar]
- 31.Wallberg AE, Yamamura S, Malik S, Spiegelman BM, Roeder RG. Coordination of p300-mediated chromatin remodeling and TRAP/mediator function through coactivator PGC-1alpha. Mol Cell 2003;12:1137–1149 [DOI] [PubMed] [Google Scholar]
- 32.Huang Y, Yario TA, Steitz JA. A molecular link between SR protein dephosphorylation and mRNA export. Proc Natl Acad Sci U S A 2004;101:9666–9670 [DOI] [PMC free article] [PubMed] [Google Scholar]
- 33.Ngo JC, Chakrabarti S, Ding JH, et al. Interplay between SRPK and Clk/Sty kinases in phosphorylation of the splicing factor ASF/SF2 is regulated by a docking motif in ASF/SF2. Mol Cell 2005;20:77–89 [DOI] [PubMed] [Google Scholar]
- 34.Manley JL, Tacke R. SR proteins and splicing control. Genes Dev 1996;10:1569–1579 [DOI] [PubMed] [Google Scholar]
- 35.Fu XD. The superfamily of arginine/serine-rich splicing factors. RNA 1995;1:663–680 [PMC free article] [PubMed] [Google Scholar]
- 36.Scarpulla RC, Vega RB, Kelly DP. Transcriptional integration of mitochondrial biogenesis. Trends Endocrinol Metab 2012;23:459–466 [DOI] [PMC free article] [PubMed] [Google Scholar]
- 37.Kelly DP, Scarpulla RC. Transcriptional regulatory circuits controlling mitochondrial biogenesis and function. Genes Dev 2004;18:357–368 [DOI] [PubMed] [Google Scholar]
- 38.Herzig S, Long F, Jhala US, et al. CREB regulates hepatic gluconeogenesis through the coactivator PGC-1. Nature 2001;413:179–183 [DOI] [PubMed] [Google Scholar]
- 39.Li X, Monks B, Ge Q, Birnbaum MJ. Akt/PKB regulates hepatic metabolism by directly inhibiting PGC-1alpha transcription coactivator. Nature 2007;447:1012–1016 [DOI] [PubMed] [Google Scholar]
- 40.Finck BN, Gropler MC, Chen Z, et al. Lipin 1 is an inducible amplifier of the hepatic PGC-1alpha/PPARalpha regulatory pathway. Cell Metab 2006;4:199–210 [DOI] [PubMed] [Google Scholar]
- 41.Purushotham A, Schug TT, Xu Q, Surapureddi S, Guo X, Li X. Hepatocyte-specific deletion of SIRT1 alters fatty acid metabolism and results in hepatic steatosis and inflammation. Cell Metab 2009;9:327–338 [DOI] [PMC free article] [PubMed] [Google Scholar]
- 42.Lustig Y, Ruas JL, Estall JL, et al. Separation of the gluconeogenic and mitochondrial functions of PGC-1alpha through S6 kinase. Genes Dev 2011;25:1232–1244 [DOI] [PMC free article] [PubMed] [Google Scholar]
- 43.Sengupta S, Peterson TR, Laplante M, Oh S, Sabatini DM. mTORC1 controls fasting-induced ketogenesis and its modulation by ageing. Nature 2010;468:1100–1104 [DOI] [PubMed] [Google Scholar]