Short abstract
In nuclear power plants, vibration stress of piping is frequently evaluated to prevent fatigue failure. A simple and fast measurement method is attractive to evaluate many piping systems efficiently. In this study, a method to measure the vibration stress using optical contactless displacement sensors was proposed, the prototype instrument was developed, and the instrument practicality for the method was verified. In the proposed method, light emitting diodes (LEDs) were used as measurement sensors and the vibration stress was estimated by measuring the deformation geometry of the piping caused by oscillation, which was measured as the piping curvature radius. The method provided fast and simple vibration estimates for small-bore piping. Its verification and practicality were confirmed by vibration tests using a test pipe and mock-up piping. The stress measured by both the proposed method and an accurate conventional method using strain gauges were in agreement, and it was concluded that the proposed method could be used for actual plant piping systems.
Keywords: structural health diagnostics, optical measurement, maintenance engineering, vibration fatigue, vibration measurement, small-bore piping, piping vibration problem, light emitting diode, LED
1. Introduction
Fatigue failure is a serious problem in piping systems installed in nuclear power plants that arises from vibration sources such as pumps during plant operation [1–6]. To prevent the problem, health diagnostics of piping is conducted by measuring and analyzing the vibration-induced stress (vibration stress) in the piping [7–14]. Having suitable measurement techniques is important for the plant operators to maintain safe plant operation.
The following methods are generally used to measure the vibration stress generated in piping systems: methods to estimate the vibration stress by substituting the measured values into evaluation equations where the equations are derived from approximation of piping as a simple geometry and the measured values are obtained by portable vibrometers [15]; methods to measure the vibration stress with strain gauges mounted on the piping [16–19]; and methods to estimate the vibration stress by using vibration modes identified from the acceleration measured with many accelerometers installed throughout the piping systems [20,21]. The following vibration measurement techniques for structures and equipment including piping are also being researched at present: laser techniques based on interference and Doppler effect of light [22–31]; vibration sensors based on optical fiber and piezoelectric devices [32–37]; and techniques using laser displacement sensors [38,39].
Among these methods and techniques [15–39], the most frequently adopted is to mount strain gauges onto the pipes [18]. In nuclear power plants, however, there are great numbers of small-bore pipes in which fatigue failure can occur. Here, a small-bore pipe is generally defined as a pipe of less than 2B or 3B (60.5 or 89.1 mm outer diameter). Development of a more efficient method is desirable to measure vibration stress than conventional methods such as using strain gauges, the placement of which requires much time and labor. Although many accurate techniques for measuring vibration stress have been proposed, most of them are for measurement engineers who have high expertise and technical skills. There are few methods for nonexperts such as management staff working in plant operation. The techniques for such nonexperts need to have efficiency and simplicity of measurements, as well as measurement accuracy.
The authors have been conducting research into a simplified method to estimate vibration stress of small-bore piping [15,38–40]. It has been thought that a contactless measurement instrument improves the efficiency and simplicity for health diagnostics of piping. In the past, few accurate contactless measuring instruments were available; in recent years, however, remarkable technological innovations based on light sources and optical devices have accelerated and refined development of contactless displacement sensors. Against this backdrop, the authors have been studying a new vibration measurement method using optical sensors.
In this paper, a method is proposed to measure vibration stress of piping by multiple LED-optical contactless displacement sensors. In the LED-optical sensor, the time history of position of the measured object can be obtained by detected the edge position between light and shade received in charge coupled device (CCD) when the uniform parallel light is irradiated to the object using high-intensity GaN-based green LED light. The proposed method can measure vibration stress of piping by a simple calculation using measured values obtained by multiple displacement sensors, which is based on beam theory and curvature radius approximated from local deformation geometry. The authors developed a vibration stress measuring instrument and conducted vibration tests. Vibration stress measured by the proposed method was compared with that measured accurately by strain gauges. Furthermore, the validity of the proposed method was demonstrated by simulations of the vibration tests, and the measurement accuracy was discussed by sensitivity analysis.
Finally, the practical applicability of the proposed method to plants was verified by vibration tests using a mock-up piping system in which actual vibration behavior could be simulated. By comparison between the stress values measured by the proposed method and the accurate conventional method using strain gauges, the applicability and accuracy of the proposed method were discussed.
2. Proposed Method to Measure Vibration Stress
2.1. Principle to Measure Vibration Stress With Contactless Displacement Sensors.
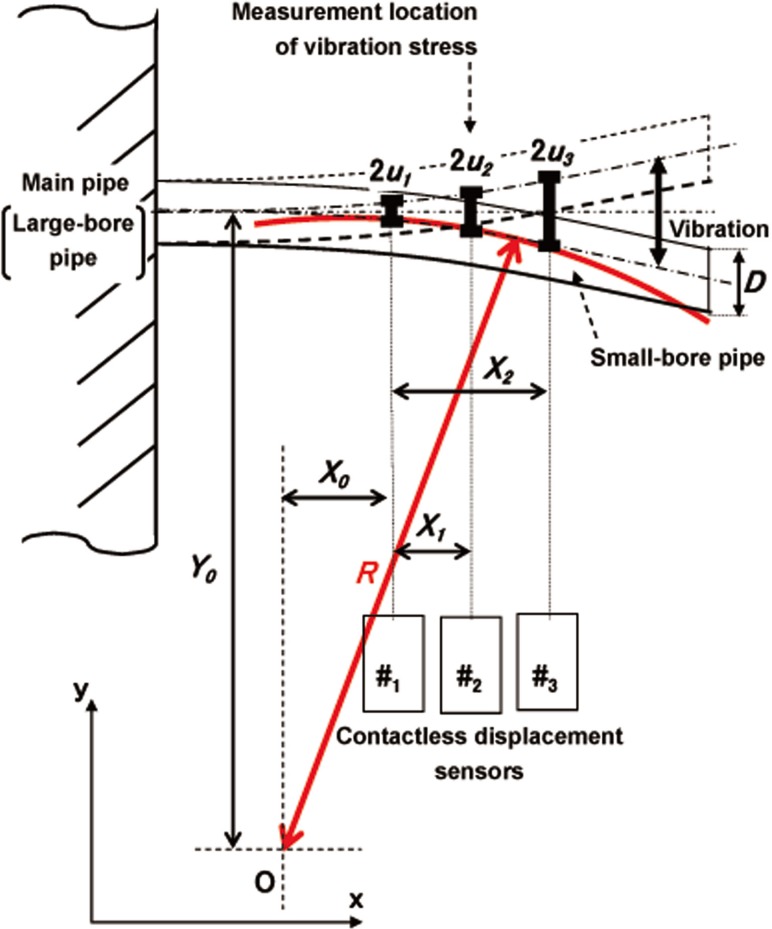
The vibration modes of piping systems in nuclear power plants are complex because of the three-dimensional complicated geometry. However, the areas of piping systems that fail by vibration fatigue are generally where the small-bore pipes connect to main pipes; in particular, breakage is common at the connected section between them, which includes the root section of the small-bore piping. Focusing on the root section area, it can be assumed that one edge is fixed and the whole area is oscillating as a beam (Fig. 1). When three displacements arising from the beam vibration can be measured, the vibration stress can be estimated by approximating the vibration mode based on the displacements. Namely, the vibration stress can be measured with a contactless method if the displacements can be measured with contactless sensors. Such a new measuring method of vibration stress is proposed in this section.
Fig. 1.
Principle of measuring vibration stress
Figure 1 shows the principle for the method developed to measure the vibration stress by using optical contactless displacement sensors. R denotes curvature radius of a pipe derived from vibration deformation. u 1, u 2, and u 3 denote the displacement amplitudes of the vibration measured by displacement sensors at each position. X 0 denotes X-direction distance from the center of the arc O to where u 1 is measured, and Y 0 denotes Y-direction distance from O to the central axis of the pipe. X 1 and X 2 denote the lengths at which the displacement is measured. They also are the measuring intervals of the sensors. D is the pipe outer diameter. Figure 1 also illustrates the determination of R in the X–Y plane. The relationship between vibration displacement amplitude and curvature of pipe is represented by Eqs. (1) to (3), based on the geometrical conditions shown in the figure. The curvature is obtained by solving these simultaneous equations if the vibration displacement amplitudes u 1, u 2, and u 3 are already known
| (1) |
| (2) |
| (3) |
On the other hand, bending stress σ on the pipe surface, which shows vibration stress, is represented as Eq. (4) according to beam theory using curvature R, Young's modulus E, and the pipe outer diameter D
| (4) |
Arranging Eqs. (1) to (3) with reference to X 0 and Y 0 yields
| (5) |
| (6) |
The third terms of the numerators in Eqs. (5) and (6) can be omitted because they are sufficiently smaller values than those of the first and second terms. Equations (5) and (6) are substituted into Eqs. (1), and (7) is obtained after reorganization of the terms. Here, the relationship is used assuming that the all measuring intervals are equal
| (7) |
and , .
In Eq. (7), furthermore, the second and third terms under the square root sign can be omitted because they are sufficiently smaller than the first term. After Eq. (7) is substituted into Eq. (4) and all terms are reorganized, the vibration stress σb is expressed as shown in Eq. (8) when the vibration displacement amplitudes are measured at even intervals
| (8) |
Therefore, the vibration stress at the displacement u 2 position can be measured without contact when the vibration displacement amplitudes u 1, u 2, and u 3 can be measured with contactless displacement sensors. When the intervals are different, the equations for different intervals are derived on the suitable conditions using Eqs. (1) to (6) in the same way as the above.
2.2. Extrapolation Technique to Estimate Vibration Stress at the Root Section.
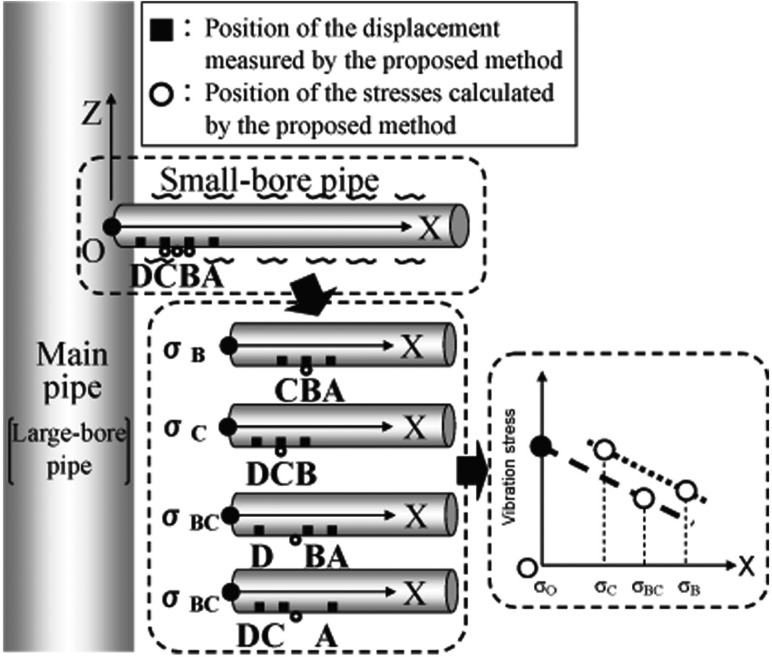
To conduct a health diagnostics of piping, it is necessary to estimate the stress at the root section. In the proposed method, the average R in the measuring range, that is, R at the center position in the measuring range is calculated by Eq. (7), and then the vibration stress is calculated by Eq. (8). The proposed method does not calculate the vibration stress at the root section directly. To solve this problem, the authors proposed an extrapolation technique to estimate the vibration stress by using the stress measured by multiple contactless displacement sensors. In the proposed extrapolation technique, first, four displacements are obtained by four contactless displacement sensors (A to D) as shown in Fig. 2. Second, three vibration stresses at points B and C and the center between points B and C (hereafter referred to as σB, σC, and σBC, respectively) are obtained by combination using three of the four displacements. Third, the vibration stress at the root section is estimated using Eq. (9). Infinitesimal deformation theory is included within beam theory. Hence, the values obtained by linear extrapolation can approximate the true values. Here, ΔX is the interval between displacement measuring points and σO is vibration stress at the root section of the small-bore piping. XBCO is the distance from the center of BC to the root section.
Fig. 2.
Extrapolation technique to estimate vibration stress at the root section
| (9) |
To estimate the vibration stress at the root section of the pipe, first four displacements at the point of A to D are measured. Second, the vibration stress σB at point B is calculated by the displacements of points A, B, and C; the vibration stress σC at point C is also calculated by the displacements of points B, C, and D; and the vibration stress σBC at the center between B and C is also calculated by the displacements of points A, B, and D and the displacements of points A, C, and D. Third, the gradient of vibration stress is calculated from σB and σC. Finally, the stress at the root section σO is estimated by extrapolation using the calculated gradient, the distance from the center of BC to the root section XBCO and σBC.
3. Development of a Vibration Stress Measuring Instrument
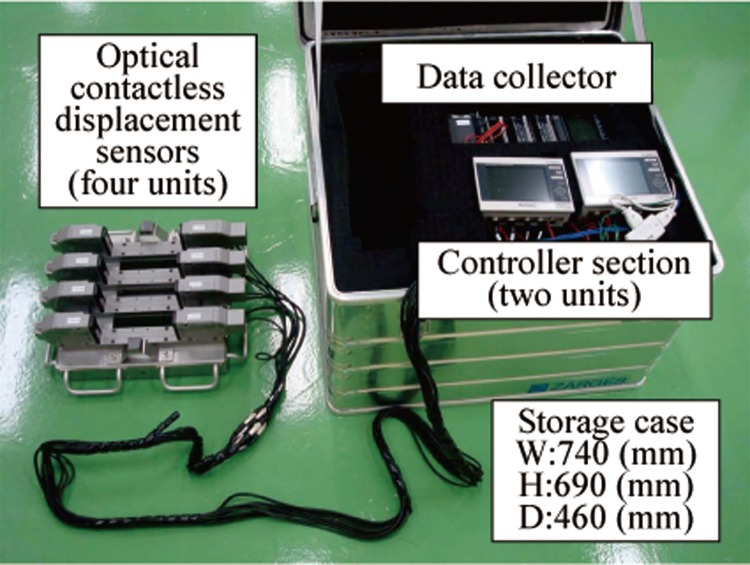
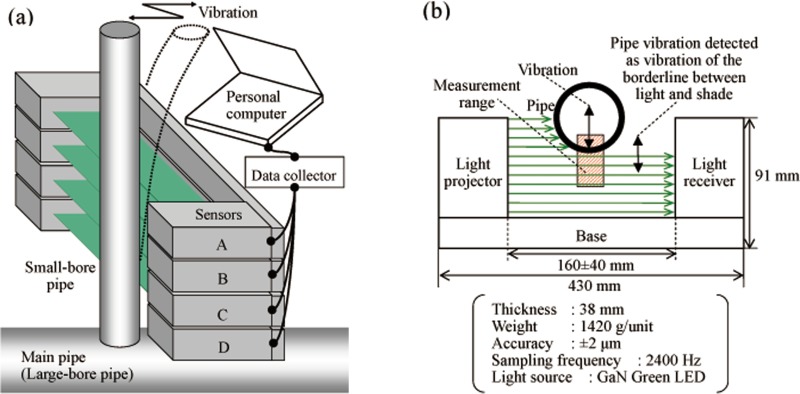
Figure 3 shows a photograph of the instrument developed. Figure 4(a) shows how the instrument is arranged to measure the vibration stress, and Fig. 4(b) is a schematic of an optical contactless displacement sensor with an LED. Vibration of piping is detected as a vibration of the borderline of light and shaded parts between the light projector and the light receiver. In other words, the pipe vibration is recognized as the fluctuation of light and darkness in the sensor. Therefore, the sensor is capable of making highly accurate measurements of displacement without being affected by the pipe surface curvature. The measuring accuracy of the sensor used in this study is 2 μm, which represents measuring error when a cylindrical rod of 10 mm diameter is in the measuring range; the measuring accuracy is better at points closer to the center of the range. The developed vibration stress measuring instrument consists of three optical contactless displacement sensors arranged in a line, a data logger, and a personal computer for calculation. In this study, the system is used with four LED-type optical contactless displacement sensors (LS-7030; KEYENCE, Co., Ltd.) to measure the vibration stress at the root section of the pipe.
Fig. 3.
Photograph of the vibration stress measuring instrument
Fig. 4.
Schematic diagram explaining the vibration stress measuring instrument: (a) arrangement for measurement and (b) principle of a contactless displacement sensor
4. Vibration Tests Using a Test Pipe
4.1. Sensitivity Analysis.
Effective range of the proposed method was evaluated by sensitivity analysis using numerical simulation before the vibration tests. The analysis model imitating a straight pipe with 0.5 m length was made using beam finite elements and modal analysis was conducted using a finite element method, and then displacements of the primary mode were obtained. The vibration stress was calculated by substituting the displacements into each equation of the proposed method. The vibration stress estimated by the proposed method and numerical simulation by the finite element analysis code nastran was compared with respect to pipe diameter, measurement interval, and resolution of the displacement sensor. The approximate accuracy of curvature derived from Eq. (7) depends on amount of vibration-induced bending of pipes, which varies by geometry and size of pipes. As an influential factor for the sensitivity analysis, the outer diameter of pipes was used. The approximate accuracy of curvature also depends on distinction between the displacements measured on the different three positions. The measurement interval was chosen to evaluate the accuracy because the degree of distinction was affected by the distance between measurement positions. The resolution was also picked to examine the resolution of measuring instrument. As reference for the comparison, 10-MPa stress was assumed to be loaded as input under the standard condition of 1B pipe diameter, 38-mm measurement interval, and 1.0 -μm resolution. Next, for each influential factor, the sensitivity analysis was conducted and the measurement accuracy was examined. The results of sensitive analysis are shown in Table 1. They indicate that the conditions except for the 19-mm measurement interval are appropriate considering that the allowance stress for fatigue limit of small-bore piping is more than some tens of mega-Pascal [41]. Therefore, in the vibration tests, the measuring accuracy was discussed for the measurement intervals of 38 mm and 76 mm using 1B pipe.
Table 1.
Results of sensitivity analysis
| Influential factors | Variation | Accuracy (MPa) | |
|---|---|---|---|
| 1 | Outer pipe diameter | 1B (ϕ34.0 mm)a | ±2.3 |
| 2B (ϕ60.5 mm) | ±4.1 | ||
| 3B (ϕ89.1 mm) | ±6.0 | ||
| 2 | Measurement interval | 19 mm | ±9.2 |
| 38 mma | ±2.3 | ||
| 76 mm | ±0.6 | ||
| 3 | Resolution | 1.00 μma | ±2.3 |
| 0.10 μm | ±0.23 | ||
| 0.01 μm | ±0.023 | ||
Standard condition.
4.2. Test Pipe.
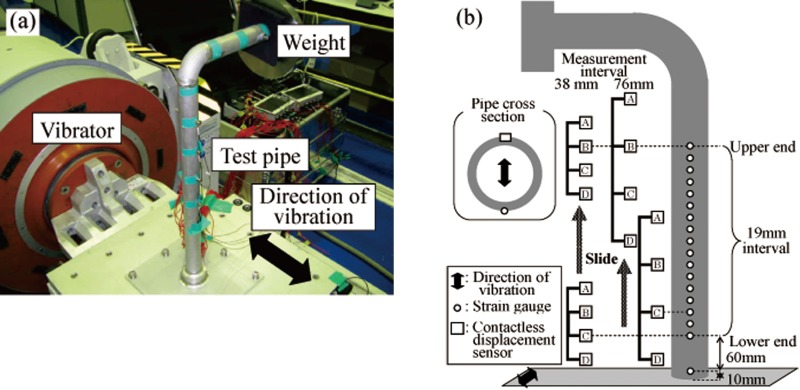
Figure 5(a) shows a photograph of the test pipe, which was made of stainless steel (SUS304). The diameter and wall thickness were 34 mm and 3.4 mm, respectively. The pipe was an L-type shape with a 3.6-kg weight on the top and it was 500 mm long in the vertical direction and 200 mm long in the horizontal direction. The primary natural frequency of the bending mode was found to be 25.2 Hz by a hammering test.
Fig. 5.
Schematic diagram explaining the vibration test: (a) photograph of a vibration unit and (b) measurement locations
4.3. Test Conditions With the Test Pipe.
Figure 5(b) shows measurement positions for the strain gauges and the instrument developed in this study. Details of the positions are described in Table 2. The measurement interval between the contactless displacement sensors was set to 76 mm. One test to measure vibration stress was conducted at six different positions by sliding the instrument in the vertical direction from the lower end to the upper end. Strain gauges were installed between lower end and upper end at a 19-mm interval and at least 10 mm from the root section; hereafter, this is referred to as the conventional method. To examine the influence of the measurement interval between the sensors, another vibration test was conducted in eight different positions under the condition that the measurement interval was 38 mm. The measurement intervals in the two tests were determined based on the thickness of the optical contactless displacement sensor.
Table 2.
Measurement conditions
|
Measurement location (mm) (distance from the root)a |
|||||||||
|---|---|---|---|---|---|---|---|---|---|
|
Proposed method |
Conventional method |
||||||||
| Case | Measurement interval (mm) | A | B | C | D | B | BCb | C | Oc |
| A1 | 76 | 450 | 374 | 298 | 222 | 374 | 336 | 298 | 10 |
| A2 | 412 | 336 | 260 | 184 | 336 | 298 | 260 | 10 | |
| A3 | 374 | 298 | 222 | 146 | 298 | 260 | 222 | 10 | |
| A4 | 336 | 260 | 184 | 108 | 260 | 222 | 184 | 10 | |
| A5 | 298 | 222 | 146 | 108 | 222 | 184 | 146 | 10 | |
| A6 | 260 | 184 | 108 | 32 | 184 | 146 | 108 | 10 | |
| B1 | 38 | 412 | 374 | 336 | 298 | 374 | 355 | 336 | 10 |
| B2 | 374 | 336 | 298 | 260 | 336 | 317 | 298 | 10 | |
| B3 | 336 | 298 | 260 | 222 | 298 | 270 | 260 | 10 | |
| B4 | 298 | 260 | 222 | 184 | 260 | 241 | 222 | 10 | |
| B5 | 260 | 222 | 184 | 146 | 222 | 203 | 184 | 10 | |
| B6 | 222 | 184 | 146 | 108 | 184 | 165 | 146 | 10 | |
| B7 | 184 | 146 | 108 | 70 | 146 | 127 | 108 | 10 | |
| B8 | 146 | 108 | 70 | 32 | 108 | 89 | 70 | 10 | |
The vibration tests were done for the conditions summarized in Table 3. The vibration stress was measured for 10 s with a sampling period of 0.5 ms.
Table 3.
Vibration test conditions with the test pipe
| Excitation wave | Range of excitation frequencies (Hz) | Vibration amplitude ((m/s2)2/Hz) | Acceleration (m/s2) |
|---|---|---|---|
| Random wave | 10–500 | 0.06 | 5.4 a |
Root-mean-square value.
5. Vibration Tests Using Mock-Up Piping System
5.1. Mock-Up Piping System.
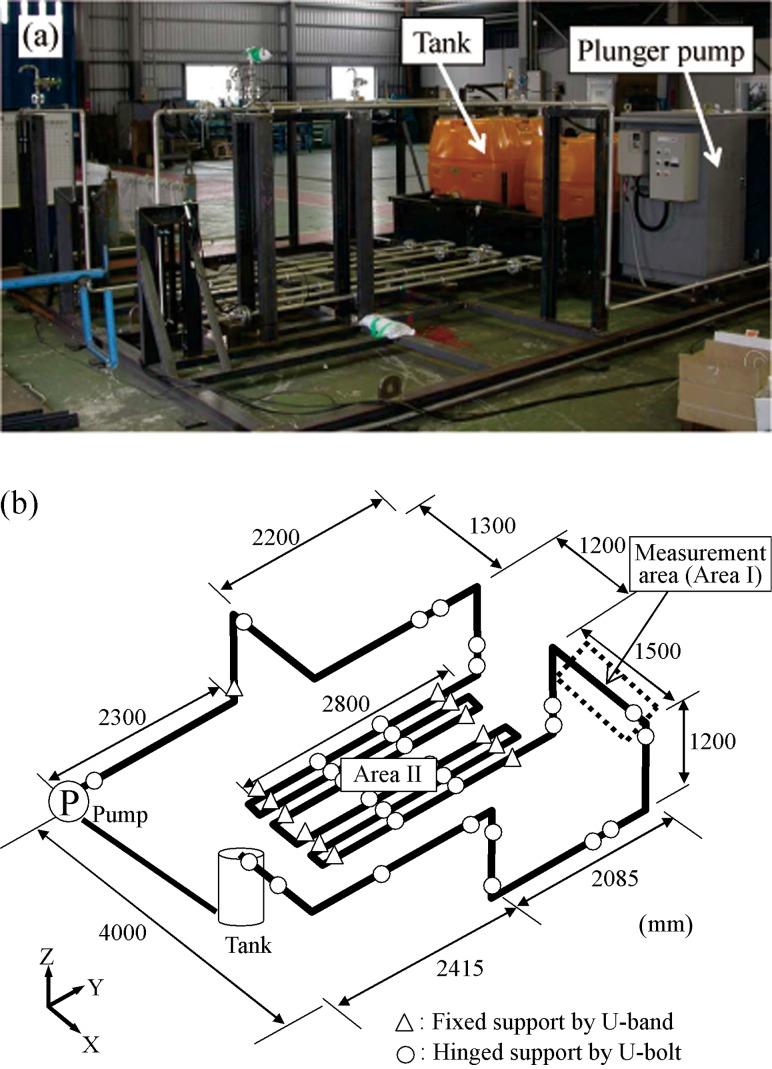
Figure 6 shows the mock-up piping system used in the vibration tests. It was assembled from 40 -m long stainless steel (SUS304) piping and a three-strand plunger pump. The pipe in area I was 3/4B and sch40 (27.2 mm outer diameter and 2.9 mm wall thickness), and in area II (pipe-fixed area), it was 1B and sch40 (34.0 mm outer diameter and 3.4 mm wall thickness). The piping was rigidly fixed in back of the outlet of the pump and at the elbow in area II by U-bands. Area I and other areas of piping were fixed by U-bolts under a free-rotation condition, that is, with a hinged support. The source to excite the piping was pressure pulsation generated from the pump. The piping was adjusted to resonate with the pressure pulsation and acoustic resonance and to have large vibration. These conditions were similar to those of an actual piping system experiencing fatigue failure by vibration.
Fig. 6.
Actual size mock-up piping: (a) photograph and (b) schematic view
5.2. Test Conditions.
The operational conditions of the mock-up piping system were measured by pressure gauges, accelerometers, and strain gauges. The vibration was measured by the developed instrument at the straight pipe connection with the elbow in area I. The pipe part fixed rigidly by U-bolt was assumed as root section. The measurement time and measurement interval were set to 2 s and 38 mm, respectively. The measurement interval of 38 mm was chosen to validate on the hard conditions. The obtained stress and the stress measured by strain gauges were compared. The vibration behavior of the mock-up was controlled using pressure inside and pump's rotational speed. After the pressure inside was set by the pressure regulation valve, the piping system was vibrated under pump operation at a steady rotational speed. The rotational speed was determined to make the elbow in area I resonate. The vibration stress measurement was done for the resonating state of the elbow.
6. Vibration Test Results Using a Test Pipe
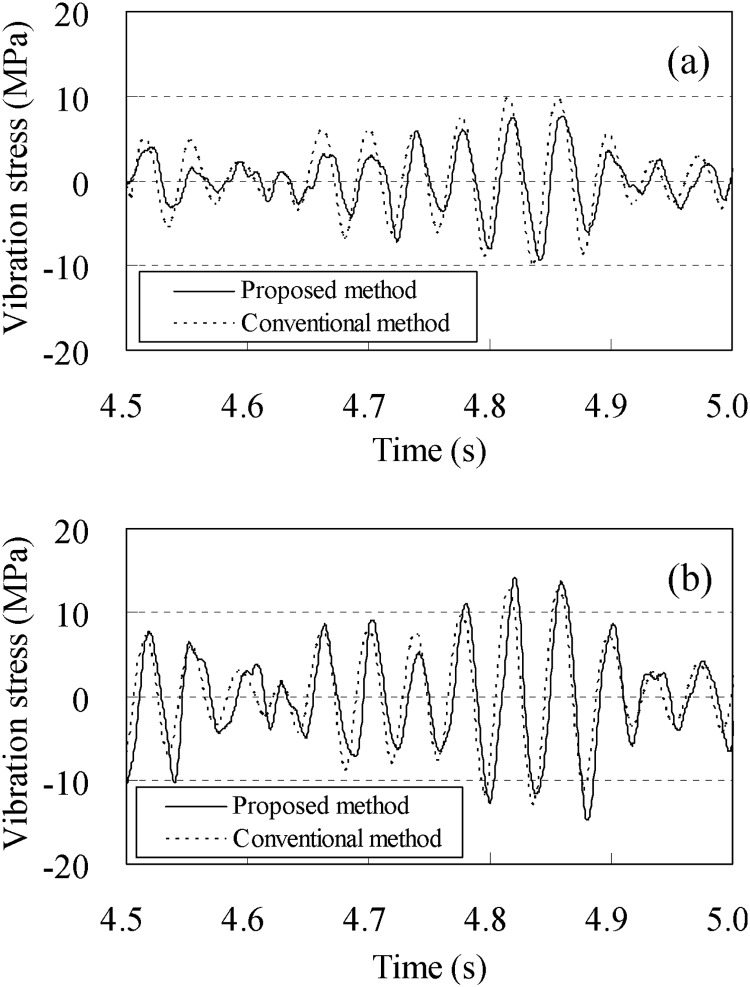
Two example sets of test results for the measurement interval of 76 mm are shown in Fig. 7. One is the vibration stress σB at the upper end and the other is the vibration stress σC at the lower end. The locations of the upper and lower ends are illustrated in Fig. 5(b). Figures 7(a) and 7(b) give expanded scale time-history waveforms of σB and σC, respectively. These results indicated that the vibration stress measured by the proposed method was in good agreement with that by the conventional method.
Fig. 7.
Typical vibration stress waveform at measurement interval of 76 mm: (a) upper end and (b) lower end
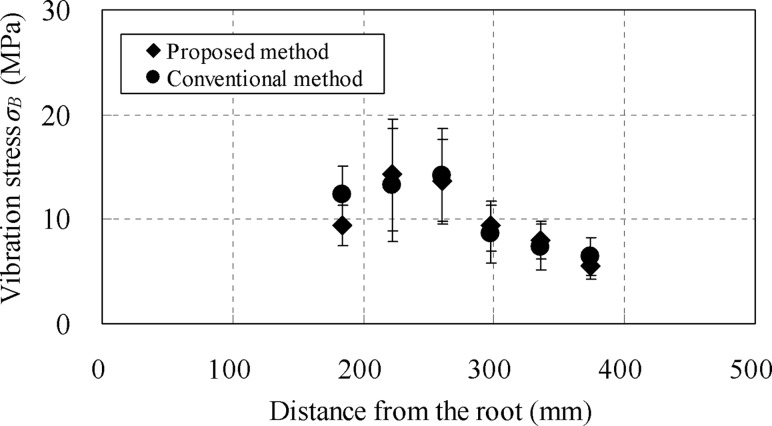
Figure 8 compares the vibration stresses at each measurement location obtained by between the proposed method and the conventional method. These stress values were represented by root-mean-square (rms) value, and the error bars were shown as the standard deviation (SD). These data also indicated good agreement for vibration stress measured by the proposed method and conventional method. In the comparison, the difference between vibration stress values of both methods was within ±3 MPa.
Fig. 8.
Vibration stress at each measurement location at measurement interval of 76 mm
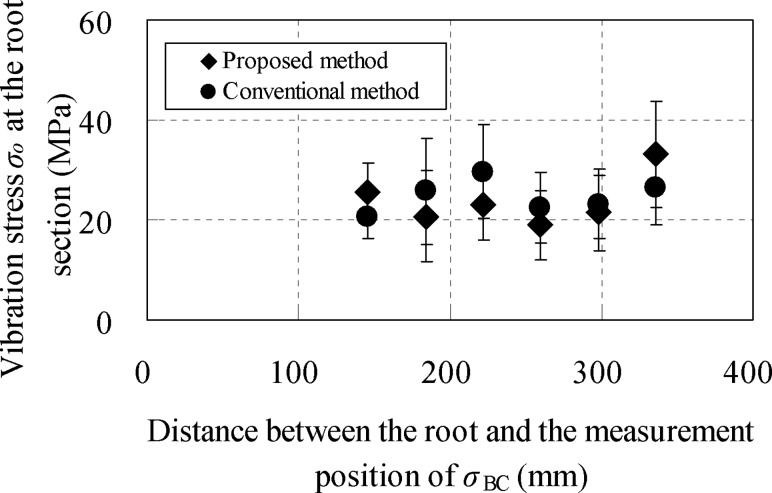
In addition, the vibration stress at the root section was estimated using the proposed extrapolation technique based on the vibration stress values at each measurement position obtained by the proposed method. The results were compared with vibration stress measured at the root section by the conventional method in Fig. 9. The stress and scatter were represented by rms value and SD. The scatter was smaller as the measurement time was longer. The vibration stress estimated at the root section by the proposed extrapolation technique also agreed well with stress measured by the conventional method. The difference in vibration stress at the root section between both methods was approximately ±7 MPa. This difference was about 1 order of magnitude in contrast to the stress value of several tens of mega-Pascal for fatigue limit of small-bore piping [41]. The error was allowable within the applicability of the proposed method to vibration fatigue evaluation. The above results led to the conclusion that the proposed method to measure vibration stress and the proposed extrapolation technique to estimate the vibration stress at the root section were suitable for practical use.
Fig. 9.
Comparison of vibration stress at the root section (measurement interval: 76 mm)
7. Influence of Measurement Intervals
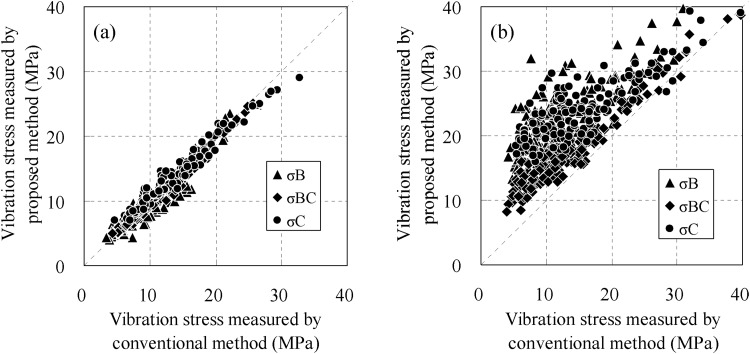
Figure 10 compares vibration stress under the two measurement intervals of 76 mm and 38 mm as measured by the proposed and conventional methods. For the interval of 76 mm, good agreement was found between the proposed and conventional method, while for 38 mm, the vibration stress measured by the former was overestimated with large variation. The magnitude of overestimation was larger for smaller vibration stress and was a maximum 20 MPa. This was why the error on the resolution capability of the contactless displacement sensors affected the measuring accuracy more because the difference between the displacement measured at all positions for the 38-mm interval was smaller than that for 76-mm interval. For the proposed method, the signal to noise (S/N) ratio would be a dominant influence on the measurement accuracy as mentioned later. The proposed method approximated the vibration mode as an arch shape based on three different displacements at each position and estimated the vibration stress from that. Therefore, the large S/N ratio improved the measurement accuracy, but the small interval made the S/N ratio lower because there was no difference in displacements at adjacent positions. This enlarged the error distribution between measured displacement values and true values and caused the overestimation of vibration stress evaluation. However, this showed the proposed method could give a conservative value. A detailed discussion is offered in Sec. 8.
Fig. 10.
Comparison of vibration stress by the proposed and conventional methods at two measurement intervals: (a) 76 mm and (b) 38 mm
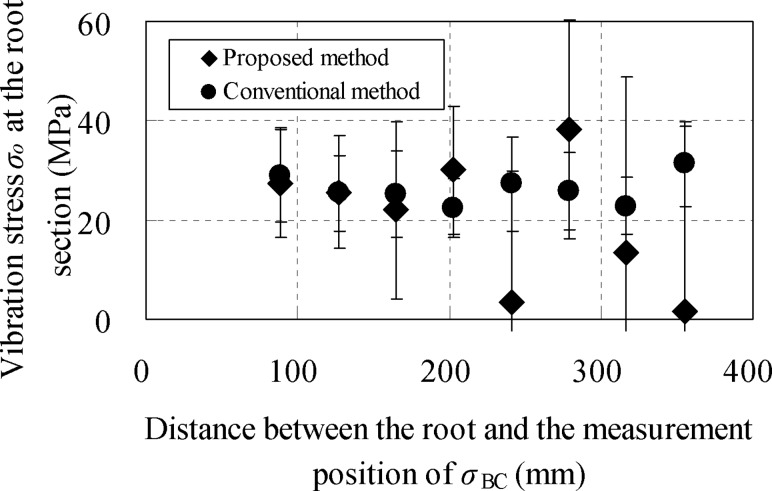
In Fig. 11, vibration stress at the root section was estimated for the measurement interval of 38 mm. The vibration stress at the root section estimated by using only the measured values obtained near the lower end was in good agreement with that measured by the conventional method. However, the vibration stress at the root section estimated by using the measured values far from the lower end varied significantly compared to the conventional method. The small interval condition, in which the measured displacement probably included valid errors, was thought to make the errors by extrapolation obvious because the stress at the root section estimated by extrapolation varied more significantly with the extrapolation at the position further from the root section. However, using the extrapolation at the position near the root section, there was only a small variation in the displacement values, indicating a small influence by the extrapolation on measurement accuracy. From the results in Fig. 11, it was concluded that the vibration stress at the root section could be estimated by the proposed extrapolation technique with an accuracy of ±3 MPa when the vibration stress could be measured at points within 200 mm from the root section.
Fig. 11.
Comparison of vibration stress at the root section (measurement interval: 38 mm)
8. Cause of Overestimation Errors
When calculating the vibration stress using Eq. (8), the displacement values measured with the contactless displacement sensors are inversely proportional to the square of the measurement interval. Finally, using only half (38 mm) of the original measurement interval (76 mm) enlarged the measurement error included in the measured displacement values fourfold and lowered the natural measurement accuracy of the displacement sensors fourfold as well. The influence was much larger than the approximate error included in the equations used in the proposed method and the error caused by the extrapolation technique. Therefore, focusing on the component that contributed to vibration stress (hereafter called the signal) and the component of the error source that did not contribute to it (hereafter called the noise) in the displacement measured with the contactless displacement sensors, the influence of S/N ratio on the measurement accuracy was investigated. In this test, a 1 -m long 3B pipe was used, and the vibration stress loaded in the pipe was changed by the resonance magnitude caused by changing excitation frequency, close to or far from the resonance frequency. The difference of displacements measured with adjacent displacement sensors (u 2 − u 1, and u 3 − u 2) was calculated, and then the difference between both ((u 2 − u 1) − (u 3 – u 2)) was used as the signal. The displacement measured at nonvibration state was used as the noise. From the results in Table 4, the S/N ratio using the interval of 38 mm was lower.
Table 4.
Signal to noise ratio
| Interval of measurement (mm) | Excitation frequency (Hz) | Excitation force | Signal (μm) | Noise (μm) | S/N ratio |
|---|---|---|---|---|---|
| 38 | 10.0 | Small | 1.9 | 1.7 | 1.12 |
| 12.5 | Large | 3.2 | 1.88 | ||
| 76 | 10.0 | Small | 3.2 | 1.7 | 1.88 |
| 12.5 | Large | 13.7 | 8.06 |
Note: Natural frequency of the test pipe: 13.2 Hz.
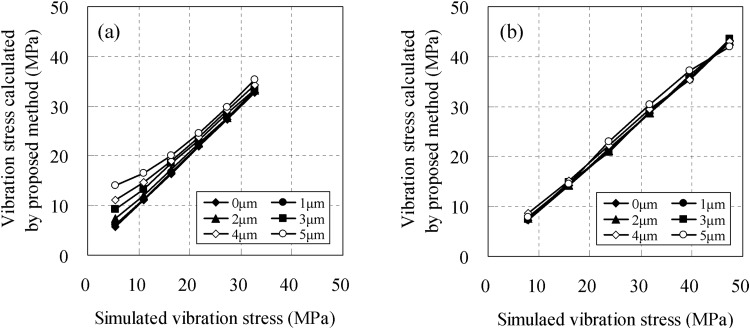
The cause of the overestimation error at the measurement interval of 38 mm is examined below. For this narrow measurement interval, the vibration stress measured by the proposed method was larger in comparison with the one measured by the conventional method. One of the causes may be worsening of the S/N ratio from the test results mentioned above. Accordingly, a numerical simulation of the vibration tests and then a parametric study on the S/N ratio were conducted. The nastran code was used for the simulation. The analysis model of the test pipe in Fig. 5 was made using beam elements. The weight on the top of pipe was modeled as a mass. The bottom of the model was fixed rigidly. The examination was performed as the following procedure: (1) random noise was added to the displacement obtained by simulation analysis. (2) The vibration stresses near the root section were calculated by Eq. (8) in the proposed method and the vibration stresses at the root section were estimated by the proposed extrapolation technique, Eq. (9), by using displacements with random noise. (3) All vibration stresses were compared with the corresponding simulation values on the assumption that the simulation value was the true value. In the examination, the amplitude of noise was assumed as follows: 1 μm, 2 μm, 3 μm, 4 μm, and 5 μm.
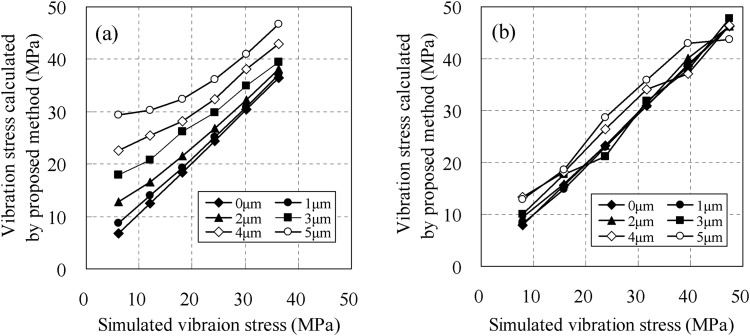
As shown in the results of Fig. 12, the vibration stress calculated using the displacement and adding random noise showed the same trend as in the tests, that is, the vibration stress measured by the proposed method were overestimated in comparison with the true vibration stress. The degree of overestimation was found to be proportional to the magnitude of noise (Fig. 12(a)). Assuming that the displacement component (noise), which was not associated with the deformation due to piping vibration was constant, the displacement component (signal), which corresponded to the deformation on the condition of measurement interval of 38 mm, was small and the S/N ratio was poor (Table 4). Thus, the influence of apparent vibration stress caused by the noise was large in the proposed method and the measured stress was larger than that measured by the conventional method using strain gauges. However, the measurement accuracy was improved when estimating the vibration stress at the root section because the stress σBC, which was used as standard in Eq. (9) was the most accurate among the three measured vibration stresses (Fig. 10). Moreover, the results indicated that vibration stress at the root section was affected by only ±5 MPa even though the stress at the root section was overestimated from the vibration stress (Fig. 12(b)).
Fig. 12.
Influence of noise on the proposed method: (a) vibration stress σB and (b) vibration stress σo at the root section (measurement interval: 38 mm)
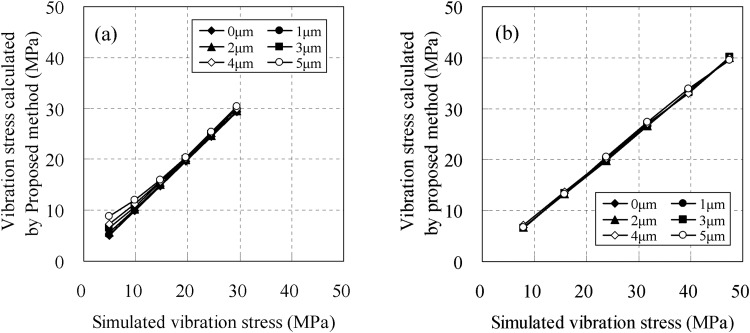
Figures 13 and 14 show the vibration stress measured using the measurement interval of 57 mm and 76 mm, respectively. As shown in Table 4, the S/N ratio was improved when the measurement interval was larger. Therefore, the measurement accuracy was improved remarkably because the influence on the noise was small.
Fig. 13.
Influence of noise on the proposed method: (a) vibration stress σB and (b) vibration stress σo at the root section (measurement interval: 57 mm)
Fig. 14.
Influence of noise on the proposed method: (a) vibration stress σB and (b) vibration stress σo at the root section (measurement interval: 76 mm)
9. Applicability for Practical Use Based on Test Results Using Mock-Up Piping System
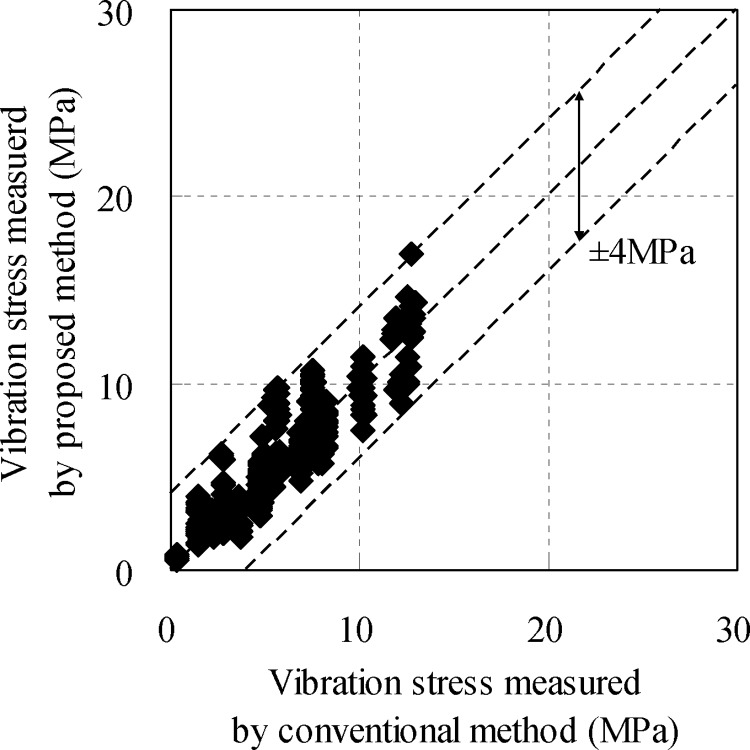
Figure 15 shows the measured vibration stress of the straight pipe in the downstream side near the elbow in area I. The vibration stress measured by the proposed and conventional method agreed closely, and the maximum error was around ±4 MPa.
Fig. 15.
Comparison of vibration stress σb measured by the proposed and conventional methods
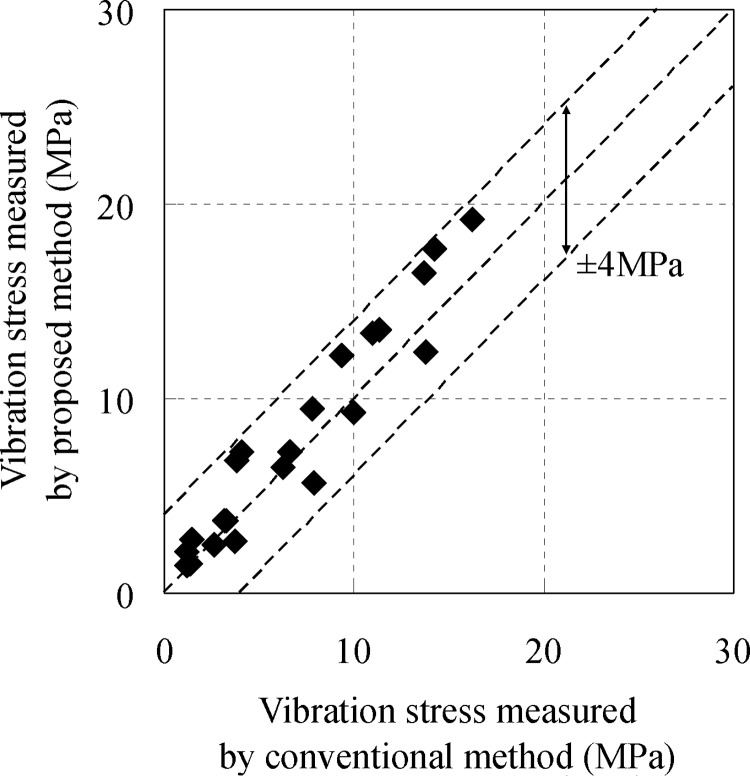
The stress at the U-bolt positions of the elbow in area I, which fixed the pipe was calculated assuming the stress evaluation at the root section of small-bore piping in actual plants. Figure 16 compares the stress measured at U-bolt positions on the downstream side of the elbow in area I by the proposed and conventional methods. The two methods give stress values that agreed closely within ±4 MPa. These values were obtained from the short-time measurement for 2 s and the narrow measurement interval of 38 mm. Thus, the measurement accuracy could be improved when the measurement time is longer or the measurement interval is larger. Because the allowable stress of vibration fatigue used in vibration stress evaluation of small-bore piping is several tens of mega-Pascal, the error in the vibration stress (±4 MPa) obtained in this study was smaller than the allowable value by 1 order, and the error could be ignored taking into account the design coefficient included in the allowable value. Consequently, the vibration stress measurement by the proposed method could be applied to the stress evaluation in actual plants.
Fig. 16.
Comparison of vibration stress σo at the root section measured by the proposed and conventional methods
10. Conclusions
A vibration stress measuring method using optical contactless displacement sensors was proposed and the applicability for practical use was examined by vibration tests using a test pipe and a mock-up piping system and by simulation analysis. The following conclusions were obtained:
-
1.
Principle of vibration stress measurement using the contactless displacement sensors and an extrapolation technique to measure the vibration stress at the root section was proposed.
-
2.
A vibration stress measuring instrument equipped with optical contactless displacement sensors was developed for verification of the proposed vibration stress measuring method and practical use.
-
3.
The applicability of the proposed method was verified by vibration tests using a test pipe. The stress measured by the proposed method agreed with accurate measurements by the conventional method using strain gauges. This indicated that the proposed method could be used for vibration fatigue evaluation of small-bore piping.
-
4.
Using numerical simulation, the cause of errors occurring with the developed vibration stress measuring instrument was studied. The signal to noise ratio under the measurement conditions was found to be the most important factor for improvement of measurement accuracy.
-
5.
The applicability of the proposed method to actual piping using mock-up piping system was discussed. The stress measured by between the proposed and the conventional method using strain gauges agreed. Finally, it was clarified that the proposed method could be applied to vibration stress evaluation of actual piping.
Glossary
Nomenclature
- D =
pipe outer diameter
- E =
Young's modulus
- R =
curvature radius of a pipe derived from vibration deformation
- ui =
displacement amplitude of vibration at each measurement location
- X0 =
X-direction distance from center of arc
- XBCO =
distance from midpoint between B and C to root section
- Xi =
length at which displacement is measured
- Y0 =
Y-direction distance from center of arc
- ΔX =
interval between displacement measuring points
- σ =
bending stress induced by vibration (vibration stress)
- σb =
vibration stress estimated using three vibration displacements measured at even intervals
- σB =
vibration stress at point B
- σBC =
vibration stress at midpoint between B and C
- σC =
vibration stress at point C
- σO =
vibration stress at root section
Contributor Information
Akira Maekawa, e-mail: maekawa@inss.co.jp.
Takashi Tsuji, e-mail: tsuji.takashi@inss.co.jp.
Tsuneo Takahashi, e-mail: takahashi.tsuneo@inss.co.jp, Institute of Nuclear Safety System, Inc., 64 Sata, Mihama-cho, Mikata-gun, Fukui 919-1205, Japan.
Michiyasu Noda, Kansai Electric Power, Co., Inc., 13-8 Goichi, Mihama-cho, Mikata-gun, Fukui 919-1141, Japan, e-mail: noda.michiyasu@c4.kepco.co.jp.
References
- [1]. Nyman, R. , Erixon, S. , Tomic, B. , and Lydell, B. , 1996, “Reliability of Piping System Components, Volume 4: The Pipe Failure Event Database,” The Swedish Nuclear Power Inspectorate (SKI), Stockholm, Sweden, SKI Report 95:61.
- [2]. Bush, S. H. , Do, M. J. , Slavich, A. L. , and Chokie, A. D. , 1996, “Piping Failure in United States Nuclear Power Plants: 1961-1995,” The Swedish Nuclear Power Inspectorate (SKI), Stockholm, Sweden, SKI Report 96:20.
- [3]. Gosselin, S. R. , and Fleming, K. N. , 1997, “Evaluation of Pipe Failure Potential via Degradation Mechanism Assessment,” Proceedings of 5th International Conference on Nuclear Engineering (ICONE 5), ICONE-2641, May 26–30, 1996, Nice, France. [Google Scholar]
- [4]. Mitman, J. , 1999, “Revised Risk-Informed In-Service Inspection Evaluation Procedure”, Electric Power Research Institute, Palo Alto, CA, EPRI TR-112657 Rev. B-A Final Report.
- [5]. Lydell, B. O. Y. , 2002, “A Database System Supporting the Evaluation of Piping Reliability on the Basis of Operational Experience”, The Swedish Nuclear Power Inspectorate (SKI), Stockholm, Sweden, SKI Report, RSA-R-2001-01.12.
- [6]. Huerta, A. , 2009, “OECD/NEA Pipe Failure Data Exchange Project 2003-2008 Status Report,” OECD/NEA, Paris, France.
- [7]. Lepiece, M. , and Leblois, C. , 1989, “Preoperational Testing Procedure for Vibration of Piping Systems,” Proceedings of International Conference on Structural Mechanics in Reactor Technology (SMiRT 10), D02, August 22–27, Anaheim, CA. pp. 65–70 [Google Scholar]
- [8]. Huang, S. N. , 1990, “Fatigue Evaluation of Piping System With Limited Vibration Test Data,” Westinghouse Hanford Company, Richland, Washington, DC, WHC-SA-0988-FP.
- [9]. Hayashi, M. , Tanaka, I. , Iida, K. , Matsuda, F. , and Sato, M. , 1997, “Vibration Behavior and Fatigue Strength of Mocked-Up Piping System,” ASME J. Pressure Vessel Technol., 119, pp. 343–35010.1115/1.2842314 [Google Scholar]
- [10]. Moussou, P. , and Boyelle, H. , 1999, “Analysis of the Vibration of a Complete French PWR Power Plant Piping System,” Proceedings of ASME Pressure Vessels and Piping Conference, PVP-Vol. 389, pp. 415–422 [Google Scholar]
- [11]. Moussou, P. , Cambler, S. , Lachene, D. , Longarini, S. , Pauihiac, L. , and Villouvier, V. , 2001, “Vibration Investigation of a French PWR Power Plant Piping System Caused by Cavitating Butterfly Valves,” Proceedings of ASME Pressure Vessels and Piping Conference, PVP-Vol. 420–422, pp. 99–106 [Google Scholar]
- [12]. Jeon, C. B. , Chun, W. H. , and Lee, J. Y. , 2006, “Evaluation and Analysis of High Frequency Vibration on the Cavitating Venturi Downstream Piping,” Proceedings of ASME Pressure Vessels and Piping Conference, PVP2006-ICPVT-11-93337, July 23–27, Vancouver, BC Canada.
- [13]. Kostarev, V. , Tuomas, A. , and Reinsch, K. H. , 2007, “Resolving of Steam and Feed-Water Piping Vibration Matter at Loviisa NPP,” Transactions of 19th International Conference on Structural Mechanics in Reactor Technology (SMiRT 19), J02/4, August 12–17, Toronto, Canada. [Google Scholar]
- [14]. Xue, F. , Wang, Z. X. , Lin, L. , Ti, W. X. , Gong, M. X. , Liu, P. , and Shu, G.G. , 2010, “Experimental and Numerical Evaluation of the Vibration Fatigue of Small Bore Pipe in PWR,” Adv. Mater. Res., 97–101, pp. 848–851www.scientific.net/AMR.97-10 [Google Scholar]
- [15]. Noda, M. , Suzuki, M. , Maekawa, A. , Sasaki, T. , Suyama, T. , and Fujita, K. , 2006, “Methods of Evaluating Vibration-Induced Stress of Small-Bore Piping,” Proceedings of ASME Pressure Vessels and Piping Conference, PVP2006-ICPVT-11-93198, July 23–27, Vancouver, BC, Canada. [Google Scholar]
- [16]. Bauernfeind, V. , Bloem, Th. , Pache, W. and Diederich, H. J. , 1992, “Vibration Monitoring of the Primary Piping System During the Hot Functional Tests of the Mülheim-Kärlich PWR,” Nucl. Eng. Des., 133, pp. 17–2110.1016/0029-5493(92)90083-8 [Google Scholar]
- [17]. Hofstötter, P. , 1994, “In-Service Measurements on Piping Systems and Components in Nuclear Power Plants,” Nucl. Eng. Des., 147, pp. 369–37410.1016/0029-5493(94)90219-4 [Google Scholar]
- [18]. Silva, C.W. , 1999, Vibration: Fundamentals and Practice, CRC, Boca Raton, FL, pp. 456–476 [Google Scholar]
- [19]. Lu, N. , Wang, X. , and Wu, X. , 2005, “Piping Vibration Stress Measurement and Life Assessment,” Transactions of 18th International Conference on Structural Mechanics in Reactor Technology (SMiRT 18), SMiRT18-D03-8, August 7–12, Beijing, China. [Google Scholar]
- [20]. Tanaka, T. , Suzuki, S. , Nekomoto, Y. , and Tanaka, M. , 1994, “The Development of a Diagnostic and Monitoring System for Vibration Pipe Branches,” Nucl. Eng. Des., 147(3), pp. 455–46110.1016/0029-5493(94)90228-3 [Google Scholar]
- [21]. Kunze, U. , and Bechtold, B. , 1995, “New Generation of Monitoring Systems With On-Line Diagnostics,” Prog. Nucl. Energy, 29(3/4), pp. 215–22710.1016/0149-1970(95)00009-9 [Google Scholar]
- [22]. Pleydell, M. E. , 1988, “Laser Doppler Vibration Measurement Using a Polarization-Based Device,” Measurement, 6(1), pp. 10–1810.1016/0263-2241(88)90033-4 [Google Scholar]
- [23]. Doi, S. M. , Nekomoto, Y. , Takeishi, M. , Miyoshi, T. , and O'shima, E. , 1999, “Development of a High Cycle Vibration Fatigue Diagnostic System With Non-Contact Vibration Sensing,” Proceedings of 7th International Conference on Nuclear Engineering (ICONE 7), ICONE-7344, April 19–23, Tokyo, Japan. [Google Scholar]
- [24]. Bell, J. R. , and Rothberg, S. J. , 2000, “Rotational Vibration Measurements Using Laser Doppler Vibrometry: Comprehensive Theory and Practical Application,” J. Sound Vib., 238(4), pp. 673–69010.1006/jsvi.2000.3134 [Google Scholar]
- [25]. Chambard, J. P. , Chalvidan, V. , Carniel, X. , and Pascal, J. C. , 2002, “Pulsed TV-Holography Recording for Vibration Analysis Applications,” Opt. Lasers Eng., 38(3–4), pp. 131–14310.1016/S0143-8166(02)00006-4 [Google Scholar]
- [26]. Venkatakrishnan, K. , Tan, B. , and Ngoi, B. K. A. , 2002, “Two-Axis-Scanning Laser Doppler Vibrometer for Precision Engineering,” Opt. Lasers Eng., 38, pp. 153–17110.1016/S0143-8166(02)00008-8 [Google Scholar]
- [27]. Scalise, L. , and Paone, N. , 2002, “Laser Doppler Vibrometry Based on Self-Mixing Effect,” Opt. Lasers Eng., 38, pp. 173–18410.1016/S0143-8166(02)00009-X [Google Scholar]
- [28]. Borza, D. N. , 2004, “High-Resolution Time-Average Electronic Holography for Vibration Measurement,” Opt. Lasers Eng., 41, pp.515–52710.1016/S0143-8166(03)00016-2 [Google Scholar]
- [29]. Garoi, F. , Logofatu, P. C. , Apostol, D. , Udrea, C. , and Schiopu, P. , 2010, “Interferometric Vibration Displacement measurement,” Rom. Rep. Prog. Phys., 62(3), pp. 671–677 [Google Scholar]
- [30]. Garoi, F. , Apostol, D. , Damian, V. , and Schiopu, P. , 2010, “Traceable Vibration Amplitude Measurement With a Laser Interferometer,” Rom. J. Phys., 55(3–4), pp. 369–375 [Google Scholar]
- [31]. Zhong, S. , Shen, H. , and Shen, Y. , 2011, “Real-Time Monitoring of Structural Vibration Using Spectral-Domain Optical Coherence Tomography,” Opt. Lasers Eng., 49, pp. 127–13110.1016/j.optlaseng.2010.08.008 [Google Scholar]
- [32]. Ovrén, C. , Adoifsson, M. , and Hök, B. , 1984, “Fiber-Optic Systems for Temperature and Vibration Measurements in Industrial Applications,” Opt. Lasers Eng., 5, pp. 155–17210.1016/0143-8166(84)90008-3 [Google Scholar]
- [33]. Chitnis, V. T. , Kumar, S. , and Sen, D. , 1989, “Optical Fiber Sensor for Vibration Amplitude Measurement,” J. Lightwave Technol., 7(4), pp. 687–69110.1109/50.19096 [Google Scholar]
- [34]. Kageyama, K. , Murayama, H. , Ohsawa, I. , Kanai, M. , Motegi, T. , Nagata, K. , Machijima, Y. , and Matsumura, H. , 2003, “Development of a New Fiber-Optic Acoustic/Vibration Sensor: Principle, Sensor Performance, Applicability to Health Monitoring and Characteristics at Elevated Temperature,” Proceedings of International Workshop on Structural Health Monitoring 2003, Stanford University, CA, pp. 1–8 [Google Scholar]
- [35]. Cheraghi, N. , Zou, G. P. , and Taheri, F. , 2005, “Piezoelectric-Based Degradation Assessment of a Pipe Using Fourier and Wavelet Analysis,” Comput. Aided Civ. Infrastruct. Eng., 20(5), pp. 369–38210.1111/j.1467-8667.2005.00403.x [Google Scholar]
- [36]. Casalicchio, M. L. , Perrone, G. , and Vallan, A. , 2009, “A Fiber Optical Sensor for Non-Contact Vibration Measurements,” DGaO Proceedings [Google Scholar]
- [37]. García, Y. R. , Corres, J. M. , and Goicoechea, J. , 2010, “Vibration Detection Using Optical Fiber Sensors,” J. Sens., 2010, pp. 1–1210.1155/2010/936487 [Google Scholar]
- [38]. Noda, M. , Maekawa, A. , Suzuki, M. , and Shintani, M. , 2007, “Development of Evaluation Method of Vibrational Stress in Piping System Applying Multiple Laser Displacement Sensors,” Proceedings of ASME Pressure Vessels and Piping Conference, PVP2007-26453, July 22–26, San Antonio, TX [Google Scholar]
- [39]. Shintani, M. , Noda, M. , Maekawa, A. , and Sakashita, M. , 2007, “Experimental Study of Evaluation Method of Vibrational Stress in Piping System Applying Multiple Laser Displacement Sensors,” Proceedings of ASME Pressure Vessels and Piping Conference, PVP2007-26454, July 22–26, San Antonio, TX [Google Scholar]
- [40]. Maekawa, A. , and Noda, M. , 2010, “Development of Methods to Measure Vibrational Stress of Small-Bore Piping With Multiple Contactless Displacement Sensors,” Proceedings of 23rd International Congress on Condition Monitoring and Diagnostic Engineering Management (COMADEM2010), June 28–July 2, Nara, Japan. pp. 637–644 [Google Scholar]
- [41]. Higuchi, M. , Nakagawa, A. , Hayashi, M. , Yamauchi, T. , Saito, M. , Iida, K. , Matsuda, F. , and Sato, M. , 1996, “A Study on Fatigue Strength Reduction Factor for Small Diameter Socket Welded Pipe Joints,” Proceedings of ASME Pressure Vessels and Piping Conference, PVP-Vol. 338, pp. 11–19 [Google Scholar]


