

Abstract
Determining biophysical sensitivity and specificity of quantitative magnetic resonance imaging is essential to develop effective imaging metrics of neurodegeneration. Among these metrics apparent pool size ratio (PSR) from quantitative magnetization transfer (qMT) imaging and radial diffusivity (RD) from diffusion tensor imaging (DTI) are both known to relate to histological measure of myelin density and integrity. However their relative sensitivities towards quantitative myelin detection are unknown. In this study, we correlated high-resolution quantitative magnetic resonance imaging measures of subvoxel tissue structures with corresponding quantitative myelin histology in a lipopolysacharide (LPS) mediated animal model of MS. Specifically, we acquired quantitative magnetization transfer (qMT) and diffusion tensor imaging (DTI) metrics (on the same tissue sample) in an animal model system of type III oligodendrogliopathy which lacked prominent lymphocytic infiltration, a system that had not been previously examined with quantitative MRI. We find that the qMT measured apparent pool size ratio (PSR) showed the strongest correlation with a histological measure of myelin content. DTI measured RD showed the next strongest correlation, and other DTI and relaxation parameters (such as the longitudinal relaxation rate (R1f) or fractional anisotropy (FA)) showed considerably weaker correlations with myelin content.
Keywords: Quantitative magnetization transfer (qMT), Diffusion Tensor Imaging (DTI), 9.4T, White matter, Myelin, demyelination, lippopolysaccharide (LPS), Rat brain, Multiple Sclerosis (MS)
INTRODUCTION
Multiple sclerosis (MS) is the most common inflammatory demyelinating disease of the central nervous system (CNS), and MRI is the prominent modality to detect MS lesions. Conventional relaxation-weighted imaging of MS can track inflammation and the number and volume of lesions, but is not specific to different pathological tissue states such as axonal loss, Wallerian degeneration, gliosis, inflammation and demyelination. Quantifying the extent of demyelination in particular has important clinical implications in monitoring disease progression, treatment planning, and drug response. Hence while remaining an important tool for diagnosis, current MRI metrics are imprecise predictors of pathology, disease progression or response to therapy, and more specific quantitative methods are needed.
qMT and DTI are quantitative methods with sensitivity to demyelination (Schmierer, et al., 2004; Song, et al., 2005; Stikov, et al., 2011; Underhill, et al., 2011). Specifically, previous studies have shown that the DTI parameter radial diffusivity increases in dysmyelinating and demyelinating animal models (Shamy, et al., 2010; Song, et al., 2002; Song, et al., 2005), while an increase in axial diffusivity correlates with axonal damage but not with demyelination (Song, et al., 2005). Similarly, magnetization transfer imaging measured magnetization transfer ratio (MTR) and pool size ratio (PSR) mapped with qMT have been shown to correlate with histological measures of demyelination (Deloire-Grassin, et al., 2000; Ou, et al., 2009; Rausch, et al., 2009; Schmierer, et al., 2004). However, MTR is also sensitive to variations in acquisition protocols (such as the irradiation power) (Berry, et al., 1999) and to changes in parameter values that have no direct connection to magnetization transfer (such as the free water relaxation rate, R1f). Instead, metrics derived from quantitative methods are needed to isolate the biophysical changes underlying white matter damage and to make comparisons across subjects and centers. Hence, in this study we have limited ourselves to a qMT method (Gochberg and Gore, 2003; 2007; Li, et al., 2010) that images several underlying tissue characteristics, including the PSR. (There are several different approaches to measuring the pool size ratio (Gloor, et al., 2008; Henkelman, et al., 1993; Ramani, et al., 2002; Ropele, et al., 2003; Sled and Pike, 2000; 2001) which should all give similar results. However, there is some confusion in that some authors, including us, use a pool size ratio = pm/pf, while others use pm/(pm+pf), where pm and pf refers to the macromolecular and free proton pools respectively).
The current study was designed to examine the qMT and DTI metrics which closely reflect the underlying pathology of demyelination. While both methods have shown sensitivity to demyelination, they are based on distinct tissue models and are indirect measures of myelin content. Hence, correlating these quantitative metrics of MRI with histological measures of myelin content (and with each other) in a range of pathologies is necessary to reveal their relative sensitivity and specificity towards demyelination.
There are different animal models of MS each addressing different patho-physiological aspects of MS lesions in humans. In the experimental autoimmune encephalomyelitis (EAE) model, immunization of animals with myelin oligodendrocyte glycoprotein (MOG) induces high levels of inflammation due to infiltration of mononuclear myelin-specific CD4 T cells, resulting in moderate to severe axonal damage but only minor primary demyelination. Toxin-induced models show focal demyelination (e.g. local injection of lysolicithin) or diffused demyelination (e.g. animals fed with cuprizone admixed chow), but typically lack substantial T cell infiltration. Thus both EAE and toxin based animal models deviate from MS pathology in humans, limiting the applicability and relevance of results. Similarly, while the chronic Theiler’s viral model of demyelination shows features of demyelination, the inability to identify a viral pathogen in MS has reduced the enthusiasm for this model. Also, the majority of the pathology in the Theiler’s virus model is seen in the spinal cord, which has made imaging of lesions difficult.
We instead used a model of CNS demyelination which followed the intracerebral injection of lipopolysacharide (LPS). Injection of LPS into the central nervous system (CNS) results in recruitment of macrophages, followed by demyelination that is similar to that of a progressive oligodendrogliopathy (Felts, et al., 2005). This animal model oligodendrogliopathy reflects features which are similar to the primary oligodendrogliopathy as seen in a subset of patients with MS. The pathological features show apoptotic death of oligodendrocytes and relative absence of prominent lymphocytic infiltration. Following intracerebral injection of LPS into the corpus callosum, demyelination is maximal 20–28 days post injection (Sriram, et al., 2012). There are no therapies for this form of oligodendrogliopathy.
Development of newer strategies to treat MS will be facilitated by better methods to characterize changes that are typical of primary oligodendrogliopathy. To our knowledge, this is the first quantitative magnetic resonance myelin study of a LPS mediated rat model of Type III MS lesions, that is, lesions that implicate oligodendrocyte degeneration as the prominent feature rather than autoimmunity as a mechanism for oligodendrocyte death and myelin loss (Lucchinetti, et al., 1999).
In this study, we present correlations of high-resolution 3D qMT and DTI matrices (167μm isotropic) with quantitative Luxol fast blue-periodic acid Schiff (LFB/LFB-PAS) stained histology in a model of CNS demyelination which shows features of MS.
METHODS
In Vivo injection of LPS into Corpus Callosum
To induce focal lesions nine rats were injected intracerebrally with LPS (n=8) or an equal volume of saline (n=1) into the corpus callosum (CC). In one of the LPS rats (#3), the injection missed the CC, which was hence not affected. This animal was excluded from the analysis. Rats were anesthetized and positioned in a small-animal stereotaxic apparatus (David Kopf Instruments, Tujunga, CA) to conform to the brain atlas. Microinjection of LPS (Escherichia Coli serotype 055:B5) into the corpus callosum was performed with a 32-gauge needle through a dentist’s burr hole. To perform the injection into the corpus callosum, the following coordinates were used: 1 mm posterior from bregma, 1 mm lateral from the sagittal suture, and 3.3–3.5 mm below the dura mater. LPS-treated rats received 5 μl of saline containing 5 μg of LPS using a microinjection pump over 15 minutes. The needle was then held for an additional 10 minutes after injection.
Fixation
28 days post injection, rats were perfused with the PBS/saline solution followed by 4% paraformaldehyde fixation. Rat brains were excised and soaked in about ten times the volume of Phosphate Buffered Saline (PBS) solution for a period of 24 hours prior to ex vivo qMT imaging. PBS solution mitigates the T2 shortening caused by fixation. Rat brains were then soaked for an additional one week in 1 mM Gd-DTPA/PBS solution to improve the time efficiency of ex vivo DTI scans (D’Arceuil, et al., 2007). Due to scheduling constraints rats 2, 7, and 9 were imaged about a month later for ex vivo DTI. During this time the brains were stored back in PBS solution before transferring back in 1mM Gd-DTPA/PBS Gd-doping solution one week prior to imaging. All experimental procedures were approved by Vanderbilt University’s animal care committee (IACUC).
Data acquisition and analysis
Ex vivo MRI acquisitions were performed on a 9.4T 21-cm-bore Agilent/Varian Inova scanner. The rat brains were imaged at 3D high resolution (167μm isotropic using a 192×96×96 imaging grid). We choose 3D acquisitions since we needed small volume voxels to avoid partial volume effects between structures and degrees of demyelination and in order to select regions-of-interest that match the very high resolution histology images. Achieving such small voxels using 2D acquisitions requires high gradient performance and adds complicating slice profile issues. Also, since these small voxels require long acquisition times to ensure adequate SNR, no additional time was required in order to acquire 3D data. qMT and DTI scans were performed on the perfusion fixed brains, in a custom brain holder in fomblin. Fomblin prevents tissue dehydration, provides susceptibility matching, and (being proton free) has no background signal.
The qMT scans were performed using an optimized selective inversion-recovery method (Gochberg and Gore, 2007) with a 5 point scheme requiring 15s/shot, 8 echos with the kspace zero line on the first echo, eight additional pulses at the end of echo train after acquisition to ensure zero z-magnetization, and two averages for a total scan time of 10 hours/sample. Pulse sequence timings ti and td match the optimized values of (Li, et al., 2010), except for a minimum ti of 6ms instead of 4ms.
DTI scans on Gd-doped brains were performed using 3D PGSE, with a b-value of 1157s/mm2, TE/TR=29/250 ms, six diffusion sensitizing gradient directions of (x,y,z) = (0,0.707,0.707), (0.707,0,0.707), (0.707,0.707,0), (0,−0.707,−0.707), (−0.707,0,−0.707), (−0.707,−0.707,0) and an additional image with no diffusion sensitive gradients (Basser and Pierpaoli, 1998), 2 averages and a total DTI acquisition time of 8.5 hours/sample.
The diffusion tensor (D), calculated by matrix diagonalization from tensor element maps, on a pixel by pixel basis, was used to derive the eigenvalues (λ1, λ2, λ 3) and eigenvectors. DTI parameter maps were calculated from these eigenvalues, where RD = (λ2+λ3)/2; AD = λ1, the largest eigenvalue; ; and
Histopathology
4mm coronal tissue sections containing the injection were excised matching the area diagrammed in Fig. 1 aided by the visible markers as discussed below. The section was blocked in paraffin, sectioned in 10μm slices, stained with Luxol fast blue (LFB) or Luxol fast blue-periodic acid Schiff (LFB-PAS), and quantified by optical opacity. LFB stains myelin and PAS stains glycogen in cytoplasm. In demyelinating regions, there is recruitment of macrophages which have large amounts of glycogen and these are stained with PAS. LFB and PAS stain two cell types and have different color signatures. Since we quantify myelin on the blue minus red scale, the addition of PAS is unlikely to affect the correlation significantly. (A test of neighboring histology slides stained with LFB and LFB-PAS found a standard deviation of staining differences of 6%, an order of magnitude smaller than the spread in LFB values that will be discussed below.) To account for animal to animal differences in light microscopy of LFB stain intensity, the myelin count as measured by light microscopy of the LFB stain was normalized using the Internal Capsule (IC) as an internal reference by setting the myelin content of the average of the top 100 pixels in the IC to 200. This approach was predicated on the assumption that the IC in each rat was unaffected by LPS injection, which appears to be the case from gross visual inspection.
Figure 1.
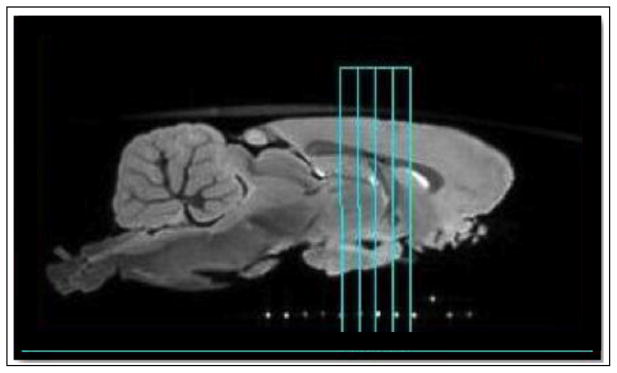
Representative sagittal slice from ex vivo T2* weighted 3D gradient echo image, which was used for anatomical positioning. qMT and DTI imaging data was taken within the 4mm axial slab (outlined in cyan), which was removed for histology. The capillary markers (white dots) ensured that the MRI and histology slices matched.
Co-registration
Co-registraton of 3D qMT dataset to 3D DTI dataset was performed using affine registration programs written in MatLab 2008b (The Mathworks, Natick, MA) maximizing the mutual information (Viola and Wells, 1997). Co-registration between MRI and histology is challenging, since the histology preparation can result in shrinkage, wrapping, and tearing. In order to facilitate such co-registration, all MRI images were taken with the ex vivo brain secured in the brain cast used for slicing histology sections. While the plastic brain matrix was not directly visible in the MRI due to its short T2, capillary markers filled with doped water were incorporated into the cast and used to ensure the histology slab was cut at an angle matching the MRI imaging geometry. (These markers are visible at the bottom of Fig. 1.) This reduced co-registration to a one dimensional problem. The MRI slice that contained the injection site was then visually matched to the histology slice using the injection needle mark and anatomical similarity. The accuracy of the co-registration varied with location, but was on the order of a couple pixels, motivating our use of six 1 mm (± 1 pixel or 167 μm) ROI’s (three on either side of the midline) within the CC as illustrated in Fig. 2.
Figure 2.
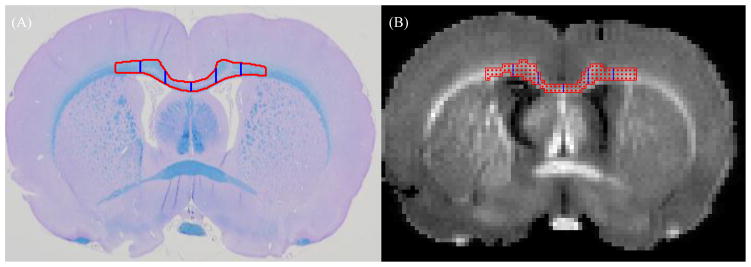
Segmentation of corpus callosum. Red outline indicates the ROI in CC selected for analysis and blue vertical lines mark the separation of 1mm ROI’s from midline. (A) LFB/PAS, (B) PSR (segmented from raw qMT image)
Statistical analysis
Pearson’s correlation coefficients were calculated using mean ROI values for MR and histological matrices using Matlab.
RESULTS
LFB/LFB-PAS staining confirmed demyelination in proximity of the injection site (and often extending along white matter tracts to the contralateral hemisphere, as seen in Fig. 3) in the CC of LPS injected rats, but not all LPS injected rats showed demyelination to a comparable severity and regional expanse. We found that five LPS injected rats had severe and extended demyelinated lesions and two rats (#4 and 5) had no/mild demyelination, which we grouped in our analysis with the saline injected control (#2). The above observations suggest that the LPS injected rat model response is likely to vary depending on individual animal.
Figure 3.
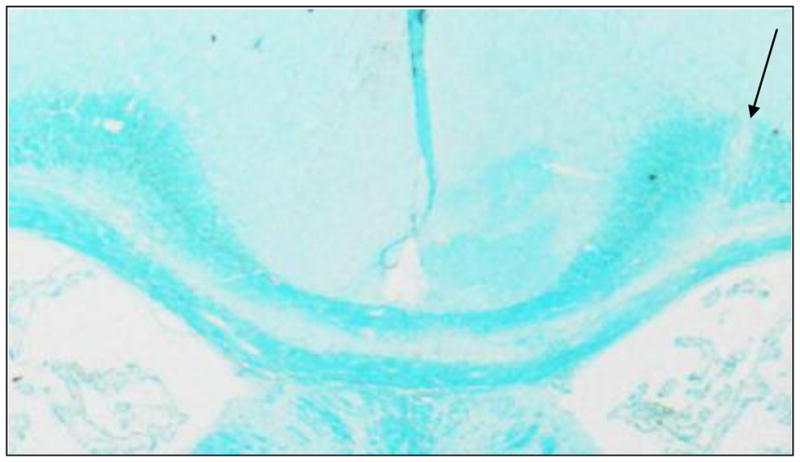
Representative LFB stained slice. Arrows indicate site of injection. The loss of LFB staining in Trunk of the corpus callosum is indicative of demyelination
Fig. 4 illustrates representative ex vivo qMT and DTI parameter maps in a coronal slice containing the injection site indicated by the black arrow in Fig. 4H. Note in particular the strong gray/white matter contrast relative to noise for RD (Fig. 4C) and PSR (Fig. 4F).
Figure 4.

Representative (A) Davg, (B) FA, (C) RD, (D) AD, (E) R1f, (F) PSR, (G) kmf, maps and (H) LFB histology, at injection site location.
Fig. 5 plots the correlation of qMT (R1f, kmf, and PSR) and DTI (RD, AD, FA and Davg) metrics with myelin content as measured by LFB histology with light microscopy. Each point represents a 1 mm section along the corpus callosum starting from the mid line (sagittal suture), traversing 3 mm on both side and giving 6 data points/rat. The results from the saline injected rat (#2) and two LPS rats with minimal demyelination (#4 and #5) are plotted in blue, while all other LPS rats are plotted in red.
Figure 5.

qMT and DTI parameters vs myelin count from LFB histology demonstrate correlations in CC of lesion (red) and non-lesion (blue) rats. qMT: (a) kmf vs LFB, (b) PSR vs LFB, (c) R1f vs LFB and DTI: (d) Davg vs LFB, (e) RD vs LFB, (f) AD vs LFB, (g) FA vs LFB. PSR shows a strong positive and RD shows strong negative correlation with myelin content measured by LFB histology. Each point represents a 1mm ROI in the CC.
The key result is that PSR clearly separates demyelinated from normal white matter. The separation between demyelinated lesions and normal white matter corresponds to ~120 arbitrary units (A.U.) in LFB histology, i.e. the normalized histological myelin count for non-lesioned rats and normal appearing sections of lesioned rats ranged from about 120–180. PSR showed the clearest separation between lesioned and non-lesioned regions, with lesioned regions having a PSR less than about 0.2 (Fig 5. B). In addition, a strong linear correlation is observed within lesion areas between PSR and LFB myelin histology. Thus PSR can distinguish between different degrees of demyelination within the LPS induced lesions. RD correlates negatively with LFB. However this correlation is weaker than it is for PSR. Fig. 6 summarizes the correlations with Pearson coefficients for all qMT and DTI parameters vs LFB light microscopy measurements of myelin content for lesioned and for combined lesioned and non-lesioned samples. The vast bulk of this correlation is due to variations in lesion severity, and hence there are similar correlation coefficients using only lesioned rats vs. using all rats. Non-lesioned rats showed much weaker correlations of MR metrics with histological myelin count likely due to the restricted range of histological myelin count values.
Figure 6.

Pearson correlations of DTI (RD, AD, FA, and Davg) and qMT (PSR, kmf, and R1f) parameters vs LFB histology. PSR shows a strong positive and RD shows a strong negative correlation with myelin content measured by LFB histology. Much weaker correlations are found for other parameters. Only correlations PSR/LFB, R1f/LFB, RD/LFB were significant (p<0.05) for the combined and lesion set. The error bars denote the 95% confidence intervals for correlation coefficients. p-values for the correlations are given in table below.
| vs LFB | R1f/LFB | PSR/LFB | kmf/LFB | Davg/LFB | RD/LFB | AD/LFB | FA/LFB |
| combined | 0.031728 | 1.22E-14 | 0.27691 | 0.055159 | 0.000413 | 0.599932 | 0.060281 |
| Lesioned | 0.001087 | 3.11E-10 | 0.807615 | 0.361128 | 0.030472 | 0.862243 | 0.394368 |
Of all the qMT parameters, PSR has the strongest correlation with myelin histology (Pearson’s r = 0.85, p < 0.00001). Likewise, RD has the strongest correlation (r = −0.49, p < 0.001) of the DTI parameters. Fig. 7 illustrates the connection between qMT and DTI measures of the myelin by correlating DTI parameters (RD, AD, FA, and Davg) to PSR and qMT parameters (PSR, kmf, and R1f) to RD. (Correlations between parameters within a single imaging protocol are inherently high but less meaningful due to similar dependencies on the underlying data, e.g. AD and Davg have similar analytic dependencies on the eigen values). No significant correlations were observed for non-lesioned rat samples.
Figure 7.

Pearson correlations between (A) DTI (RD, AD, FA, and Davg) parameters vs PSR and (B) qMT (PSR, kmf, and R1f) parameters vs RD. (RD and PSR parameters showed the strongest correlations with LFB histology.) Only correlations FA/PSR, kmf/RD, PSR/RD for the combined set and PSR/RD for the lesion set were significant (p<0.05). The error bars denote the 95% confidence intervals for correlation coefficients.
DISCUSSION
In this study, we have used an on-resonance qMT method due to our familiarity with this method and its advantages over off-resonance methods. (For example, it has little sensitivity to field inhomogenieties and avoids the need to co-register T1, B0, and B1 maps acquired from different scans.) However, our key results concerning the sensitivity of PSR to myelin content should be independent of the particular acquisition method, though we have not demonstrated this.
Although we did not acquire separate B1 maps to address RF inhomogeneity issue, B1 variation is directly related to the fitted Sf value (one of 5 qMT fitted parameters). For all the rats, we found a Sf average standard deviation of 3% across the corpus callosum and 3.4% across the entire image, leading us to believe that B1 variation is not a major concern. In addition, the selective inversion recovery method is robust to minor B1 variations.
We comprehensively correlate quantitative metrics from qMT and DTI with histological myelin measure, and also explore their inter-correlations in an LPS induced animal model of type III MS lesions. To our knowledge this is the first study correlating quantitative DTI and qMT metrics with histology and with each other, though previous studies have performed portions of these measurements, though not on the same tissue. In LPS injected rats with lesions, PSR showed the strongest correlation with myelin content (Fig. 5, 6) and showed strong correlations only with RD among other DTI metrics (Fig. 7). This indicates the specificity of PSR towards demyelination. qMT quantifies water protons closely associated with macromolecules such as that found in myelin and cell structures. Pool size ratio (PSR) is the ratio of exchanging macromolecular protons to the free water protons. Thus PSR may relate more directly to myelin content. Though it was not part of this study, multi-exponential T2 (MeT2) is an additional quantitative putative measure of myelin. There have been several studies correlating MeT2, and specifically the amplitude of T2 ~10ms decay component, with myelin histology (Laule, et al., 2006). However recent work (Dula, et al., 2010) suggests that exchange effects may bias MeT2 assessments of myelin, but that these effects do not bias PSR.
qMT measured PSR and DTI measured RD are both indirect markers of myelin content. DTI is a quantitative measure of water diffusion anisotropy within tissue micro structure. Axial and radial diffusivity reflect diffusivity of water along and perpendicular to axons within the tissue. However, this interpretation is complicated by alignment and density of fibres, along with factors such as myelin sheath thickness and intactness of axons. Various studies on demyelinating and dysmyelinating animal models have shown the sensitivity of radial diffusivity towards myelin (Klawiter, et al., 2011; Ou, et al., 2009; Song, et al., 2002; Song, et al., 2005), where the lack of myelin is indicated by an increase in radial diffusivity. Song et al. found radial diffusivity to be more specific to demyelination in presence of axonal damage, where the axonal damage is itself correlated to axonal diffusivity. However, studies have also shown in presence of inflammation (edema), RD underestimates demyelination (Budde, et al., 2008). Also, AD is affected by variations in axonal diameter and the voxel scale coherence of axon tracts (Beaulieu, 2002).
A similar qMT/histology paper (Schmierer, et al., 2007a) measured postmortem unfixed brains from 20 MS patients and found a Pearson correlation coefficient of 0.8 for LFB and the macromolecular proton fraction pm/(pm+pf) and −0.57 for LFB and the T1 relaxation time. These correlations are very similar to those found in our study for the PSR and R1f (R1f = 1/T1f), respectively. (Note that the macromolecular proton fraction and T1 approach PSR and 1/R1f, respectively, in the limit of small pm.) However a second study by the same group (Schmierer, et al., 2007b) found strong correlations between LFB histology and Davg (r=−.68) and FA (r=−.79), which did not match our weaker correlations. The source of these difference may be due to Schmierer et al.’s study of multiple types of MS lesions and disease courses vs. our study of one type of animal lesion with varying severity. Furthermore, differing anatomies were studied and there are various structural factors that influence FA including coherence of fibers, axonal size and density, and myelination. Mori and Zhang (Mori and Zhang, 2006) studied FA during brain development in C57/BL mice and found FA may vary from 0.2–0.8 in myelinated fibers due to coherence factors and 0.5–0.8 due to myelination.
While some previous studies of demyelination (e.g., (Odrobina, et al., 2005)) have emphasized changes in relaxation rates, and the longitudinal rate R1 has been correlated with myelin, edema (without demyelination) also affects R1. As an added complication, R1 actually includes both relaxation and MT effects when measured using multi-angle gradient echo (Ou and Gochberg, 2008) or conventional inversion recovery (Edzes and Samulski, 1977; Gochberg and Gore, 2003; 2007; Gochberg, et al., 1997; Prantner, et al., 2008). (Though these effects are often overlooked, longitudinal recovery is biexponential due to MT. While the macromolecular and water protons are in fast exchange, the signal is nonetheless biexponential since only water protons are measured.) However, the current work avoids these issues by isolating the longitudinal relaxation rate of the free water (R1f). We found that the correlation of R1f with myelin histology was much weaker than PSR.
There are various study design and method factors influencing the correlation between MR metrics and histology, and these may lead to an increase in scatter on correlation plots. Hence, the correlation of the qMT parameters to histology vs. the correlation of DTI parameters to histology may be affected by our particular acquisition choices. However, Monte Carlo simulations (not shown) indicate that, at the measured image SNR (~100 for qMT and ~35 for DTI) and assuming the noise in each pixel is independent, the expected variation in the fitted parameters is roughly an order of magnitude less than the measured scatter. Hence, physiologic variations most likely dominate, making the details of the acquisition choices non-determinative. An additional issue and possible source of error is correlation with histology. Accurate correlation between MR metrics and quantitative histology myelin content is influenced by numerous factors including the difference in histology and MR slice thickness, orientation of histological slice plane relative to the neuronal fibres, and artifacts in histological images, all of which may result in errors in myelin quantification. The resulting errors are difficult to quantify. However, all the above factors influence the correlations between MR metrics and histology equally and the comparative results are therefore meaningful.
CONCLUSION
This study demonstrates the sensitivity of PSR and RD to the degree of demyelination in LPS mediated white matter lesions in the CC, with PSR showing a greater correlation to histological measures of myelin compared to RD.
Highlights.
Metrics from qMT and DTI are correlated with histological measure of myelin content.
Demyelination in LPS mediated rat model of type III MS lesions is investigated.
PSR (from qMT) and RD (from DTI) are sensitive to the degree of demyelination in LPS mediated lesions.
PSR showed a greater correlation with myelin histology compared to RD.
Acknowledgments
This research is supported by NIH R01EB001452, R01EB001744 and Vanderbilt Bridge Funding grants.
Footnotes
Publisher's Disclaimer: This is a PDF file of an unedited manuscript that has been accepted for publication. As a service to our customers we are providing this early version of the manuscript. The manuscript will undergo copyediting, typesetting, and review of the resulting proof before it is published in its final citable form. Please note that during the production process errors may be discovered which could affect the content, and all legal disclaimers that apply to the journal pertain.
References
- Basser PJ, Pierpaoli C. A simplified method to measure the diffusion tensor from seven MR images. Magnetic Resonance in Medicine. 1998;39 (6):928–934. doi: 10.1002/mrm.1910390610. [DOI] [PubMed] [Google Scholar]
- Beaulieu C. The basis of anisotropic water diffusion in the nervous system - a technical review. NMR Biomed. 2002;15 (7–8):435–455. doi: 10.1002/nbm.782. [DOI] [PubMed] [Google Scholar]
- Berry I, Barker GJ, Barkhof F, Campi A, Dousset V, Franconi JM, Gass A, Schreiber W, Miller DH, Tofts PS. A multicenter measurement of magnetization transfer ratio in normal white matter. Journal of Magnetic Resonance Imaging. 1999;9 (3):441–446. doi: 10.1002/(sici)1522-2586(199903)9:3<441::aid-jmri12>3.0.co;2-r. [DOI] [PubMed] [Google Scholar]
- Budde MD, Kim JH, Liang HF, Russell JH, Cross AH, Song SK. Axonal injury detected by in vivo diffusion tensor imaging correlates with neurological disability in a mouse model of multiple sclerosis. Nmr in Biomedicine. 2008;21 (6):589–597. doi: 10.1002/nbm.1229. [DOI] [PMC free article] [PubMed] [Google Scholar]
- D’Arceuil HE, Westmoreland S, de Crespigny AJ. An approach to high resolution diffusion tensor imaging in fixed primate brain. Neuroimage. 2007;35 (2):553–565. doi: 10.1016/j.neuroimage.2006.12.028. [DOI] [PubMed] [Google Scholar]
- Deloire-Grassin MSA, Brochet B, Quesson B, Delalande C, Dousset V, Canioni P, Petry KG. In vivo evaluation of remyelination in rat brain by magnetization transfer imaging. Journal of the Neurological Sciences. 2000;178 (1):10–16. doi: 10.1016/s0022-510x(00)00331-2. [DOI] [PubMed] [Google Scholar]
- Dula AN, Gochberg DF, Valentine HL, Valentine WM, Does MD. Multiexponential T-2, Magnetization Transfer, and Quantitative Histology in White Matter Tracts of Rat Spinal Cord. Magnetic Resonance in Medicine. 2010;63 (4):902–909. doi: 10.1002/mrm.22267. [DOI] [PMC free article] [PubMed] [Google Scholar]
- Edzes HT, Samulski ET. Cross Relaxation and Spin Diffusion in Proton Nmr of Hydrated Collagen. Nature. 1977;265 (5594):521–523. doi: 10.1038/265521a0. [DOI] [PubMed] [Google Scholar]
- Felts PA, Woolston AM, Fernando HB, Asquith S, Gregson NA, Mizzi OJ, Smith KJ. Inflammation and primary demyelination induced by the intraspinal injection of lipopolysaccharide. Brain. 2005;128:1649–1666. doi: 10.1093/brain/awh516. [DOI] [PMC free article] [PubMed] [Google Scholar]
- Gloor M, Scheffler K, Bieri O. Quantitative magnetization transfer imaging using balanced SSFP. Magnetic Resonance in Medicine. 2008;60 (3):691–700. doi: 10.1002/mrm.21705. [DOI] [PubMed] [Google Scholar]
- Gochberg DF, Gore JC. Quantitative imaging of magnetization transfer using an inversion recovery sequence. Magnetic Resonance in Medicine. 2003;49 (3):501–505. doi: 10.1002/mrm.10386. [DOI] [PubMed] [Google Scholar]
- Gochberg DF, Gore JC. Quantitative magnetization transfer imaging via selective inversion recovery with short repetition times. Magnetic Resonance in Medicine. 2007;57 (2):437–441. doi: 10.1002/mrm.21143. [DOI] [PMC free article] [PubMed] [Google Scholar]
- Gochberg DF, Kennan RP, Gore JC. Quantitative studies of magnetization transfer by selective excitation and T1 recovery. Magn Reson Med. 1997;38 (2):224–231. doi: 10.1002/mrm.1910380210. [DOI] [PubMed] [Google Scholar]
- Henkelman RM, Huang XM, Xiang QS, Stanisz GJ, Swanson SD, Bronskill MJ. Quantitative Interpretation of Magnetization-Transfer. Magnetic Resonance in Medicine. 1993;29 (6):759–766. doi: 10.1002/mrm.1910290607. [DOI] [PubMed] [Google Scholar]
- Klawiter EC, Schmidt RE, Trinkaus K, Liang HF, Budde MD, Naismith RT, Song SK, Cross AH, Benzinger TL. Radial diffusivity predicts demyelination in ex vivo multiple sclerosis spinal cords. Neuroimage. 2011;55 (4):1454–1460. doi: 10.1016/j.neuroimage.2011.01.007. [DOI] [PMC free article] [PubMed] [Google Scholar]
- Laule C, Leung E, Li DKB, Troboulsee AL, Paty DW, MacKay AL, Moore GRW. Myelin water imaging in multiple sclerosis: quantitative correlations with histopathology. Multiple Sclerosis. 2006;12 (6):747–753. doi: 10.1177/1352458506070928. [DOI] [PubMed] [Google Scholar]
- Li K, Zu ZL, Xu JZ, Janve VA, Gore JC, Does MD, Gochberg DF. Optimized Inversion Recovery Sequences for Quantitative T(1) and Magnetization Transfer Imaging. Magnetic Resonance in Medicine. 2010;64 (2):491–500. doi: 10.1002/mrm.22440. [DOI] [PMC free article] [PubMed] [Google Scholar]
- Lucchinetti C, Bruck W, Parisi J, Scheithauer B, Rodriguez M, Lassmann H. A quantitative analysis of oligodendrocytes in multiple sclerosis lesions - A study of 113 cases. Brain. 1999;122:2279–2295. doi: 10.1093/brain/122.12.2279. [DOI] [PubMed] [Google Scholar]
- Mori S, Zhang JY. Principles of diffusion tensor imaging and its applications to basic neuroscience research. Neuron. 2006;51 (5):527–539. doi: 10.1016/j.neuron.2006.08.012. [DOI] [PubMed] [Google Scholar]
- Odrobina EE, Lam TYJ, Pun T, Midha R, Stanisz GJ. MR properties of excised neural tissue following experimentally induced clemyelination. Nmr in Biomedicine. 2005;18 (5):277–284. doi: 10.1002/nbm.951. [DOI] [PubMed] [Google Scholar]
- Ou X, Gochberg DF. MT effects and T1 quantification in single-slice spoiled gradient echo imaging. Magn Reson Med. 2008;59 (4):835–845. doi: 10.1002/mrm.21550. [DOI] [PMC free article] [PubMed] [Google Scholar]
- Ou XW, Sun SW, Liang HF, Song SK, Gochberg DF. The MT pool size ratio and the DTI radial diffusivity may reflect the myelination in shiverer and control mice. Nmr in Biomedicine. 2009;22 (5):480–487. doi: 10.1002/nbm.1358. [DOI] [PMC free article] [PubMed] [Google Scholar]
- Prantner AM, Bretthorst GL, Neil JJ, Garbow JR, Ackerman JJH. Magnetization transfer induced biexponential longitudinal relaxation. Magnetic Resonance in Medicine. 2008;60 (3):555–563. doi: 10.1002/mrm.21671. [DOI] [PMC free article] [PubMed] [Google Scholar]
- Ramani A, Dalton C, Miller DH, Tofts PS, Barker GJ. Precise estimate of fundamental in-vivo MT parameters in human brain in clinically feasible times. Magnetic Resonance Imaging. 2002;20 (10):721–731. doi: 10.1016/s0730-725x(02)00598-2. [DOI] [PubMed] [Google Scholar]
- Rausch M, Tofts P, Lervik P, Walmsley A, Mir A, Schubart A, Seabrook T. Characterization of white matter damage in animal models of multiple sclerosis by magnetization transfer ratio and quantitative mapping of the apparent bound proton fraction f. Mult Scler. 2009;15 (1):16–27. doi: 10.1177/1352458508096006. [DOI] [PubMed] [Google Scholar]
- Ropele S, Seifert T, Enzinger C, Fazekas F. Method for quantitative imaging of the macromolecular H-1 fraction in tissues. Magnetic Resonance in Medicine. 2003;49 (5):864–871. doi: 10.1002/mrm.10427. [DOI] [PubMed] [Google Scholar]
- Schmierer K, Scaravilli F, Altmann DR, Barker GJ, Miller DH. Magnetization transfer ratio and myelin in postmortem multiple sclerosis brain. Annals of Neurology. 2004;56 (3):407–415. doi: 10.1002/ana.20202. [DOI] [PubMed] [Google Scholar]
- Schmierer K, Tozer DJ, Scaravilli F, Altmann DR, Barker GJ, Tofts PS, Miller DH. Quantitative magnetization transfer imaging in postmortem multiple sclerosis brain. Journal of Magnetic Resonance Imaging. 2007a;26 (1):41–51. doi: 10.1002/jmri.20984. [DOI] [PMC free article] [PubMed] [Google Scholar]
- Schmierer K, Wheeler-Kingshott CAM, Boulby PA, Scaravilli F, Altmann DR, Barker GJ, Tofts PS, Miller DH. Diffusion tensor imaging of post mortem multiple sclerosis brain. Neuroimage. 2007b;35 (2):467–477. doi: 10.1016/j.neuroimage.2006.12.010. [DOI] [PMC free article] [PubMed] [Google Scholar]
- Shamy JL, Carpenter DM, Fong SG, Murray EA, Tang CY, Hof PR, Rapp PR. Alterations of White Matter Tracts Following Neurotoxic Hippocampal Lesions in Macaque Monkeys: A Diffusion Tensor Imaging Study. Hippocampus. 2010;20 (8):906–910. doi: 10.1002/hipo.20737. [DOI] [PMC free article] [PubMed] [Google Scholar]
- Sled JG, Pike GB. Quantitative interpretation of magnetization transfer in spoiled gradient echo MRI sequences. J Magn Reson. 2000;145 (1):24–36. doi: 10.1006/jmre.2000.2059. [DOI] [PubMed] [Google Scholar]
- Sled JG, Pike GB. Quantitative imaging of magnetization transfer exchange and relaxation properties in vivo using MRI. Magnetic Resonance in Medicine. 2001;46 (5):923–931. doi: 10.1002/mrm.1278. [DOI] [PubMed] [Google Scholar]
- Song SK, Sun SW, Ramsbottom MJ, Chang C, Russell J, Cross AH. Dysmyelination revealed through MRI as increased radial (but unchanged axial) diffusion of water. Neuroimage. 2002;17 (3):1429–1436. doi: 10.1006/nimg.2002.1267. [DOI] [PubMed] [Google Scholar]
- Song SK, Yoshino J, Le TQ, Lin SJ, Sun SW, Cross AH, Armstrong RC. Demyelination increases radial diffusivity in corpus callosum of mouse brain. Neuroimage. 2005;26 (1):132–140. doi: 10.1016/j.neuroimage.2005.01.028. [DOI] [PubMed] [Google Scholar]
- Sriram S, Yao SY, Natarajan C, Zhang FL. Innate Immunity Mediated Model of Primary Oligodendrogliopathy. Neurology. 2012;78 [Google Scholar]
- Stikov N, Perry LM, Mezer A, Rykhlevskaia E, Wandell BA, Pauly JM, Dougherty RF. Bound pool fractions complement diffusion measures to describe white matter micro and macrostructure. Neuroimage. 2011;54 (2):1112–1121. doi: 10.1016/j.neuroimage.2010.08.068. [DOI] [PMC free article] [PubMed] [Google Scholar]
- Underhill HR, Rostomily RC, Mikheev AM, Yuan C, Yarnykh VL. Fast bound pool fraction imaging of the in vivo rat brain: Association with myelin content and validation in the C6 glioma model. Neuroimage. 2011;54 (3):2052–2065. doi: 10.1016/j.neuroimage.2010.10.065. [DOI] [PMC free article] [PubMed] [Google Scholar]
- Viola P, Wells WM. Alignment by maximization of mutual information. International Journal of Computer Vision. 1997;24 (2):137–154. [Google Scholar]