

Abstract
Genomic evolution can be highly heterogeneous. Here, we introduce a new framework to simulate genome-wide sequence evolution under a variety of substitution models that may change along the genome and the phylogeny, following complex multispecies coalescent histories that can include recombination, demographics, longitudinal sampling, population subdivision/species history, and migration. A key aspect of our simulation strategy is that the heterogeneity of the whole evolutionary process can be parameterized according to statistical prior distributions specified by the user. We used this framework to carry out a study of the impact of variable codon frequencies across genomic regions on the estimation of the genome-wide nonsynonymous/synonymous ratio. We found that both variable codon frequencies across genes and rate variation among sites and regions can lead to severe underestimation of the global dN/dS values. The program SGWE—Simulation of Genome-Wide Evolution—is freely available from http://code.google.com/p/sgwe-project/, including extensive documentation and detailed examples.
Keywords: heterogeneous substitution models, multispecies coalescent, molecular adaptation, molecular evolution
Computer simulations are important for different purposes in molecular evolution. For example, they can be used for hypothesis testing, to evaluate and validate analytical methods, or to estimate evolutionary parameters (see Arenas 2012; Hoban et al. 2012). To our knowledge, only a few simulators of genome-wide evolution have been developed so far (table 1). Tools like EvolSimulator (Beiko and Charlebois 2007) and ALF (Dalquen et al. 2012) are able to actually simulate genomic events like duplication or rearrangement, while others basically simulate multiple genomic regions. Except ALF, current genome-wide simulators assume a constant substitution process across the entire genome, which might seem overly simplistic (Arbiza et al. 2011). In the case of ALF however, the user has to specify by hand the substitution model for any predefined genomic region, which can be too tedious for more than a few genes. Furthermore, in all these simulators, specific parameter values need to be specified by the user, which is not always an easy task.
Table 1.
Genome-Wide Simulation Software.
| Program | Class | Evolutionary Process | Substitution Process | Variable dN/dS across Sites and Branches | Rate Variation | Indels | Homogeneous/ Heterogeneous Substitution Model across Regions | Reference |
|---|---|---|---|---|---|---|---|---|
| SIMCOAL2 and Fastsimcoal | Coalescent | D, M, R | N: JC, K2P | No | No | No | Homogeneous | Excoffier et al. (2000); Excoffier and Foll (2011) |
| GenomePop | Forward | D, M, R, S | N: GTR; Cod: MG94 | No | No | No | Homogeneous | Carvajal-Rodriguez (2008) |
| EvolSimulator | Birth–death process | D, M, L, S | N: GTR; C: Nta; A: user defined | No | Gsitesb | No | Homogeneous | Beiko and Charlebois (2007) |
| GSIMULATOR package | Phylogenetic | — | N: GTR; C: EM; A: Secondary structure | No | No | Yes | Homogeneous | Varadarajan et al. (2008) |
| ALF | Birth–death process and phylogenetic | M, L | N: GTR; C: GY94 (M0,M2,M3,M8) and EM; A: 5 EMc | Yes | Gsites,b I | Yes | Homogeneous/heterogeneousd | Dalquen et al. (2012) |
| SGWE | Coalescent and phylogenetic | D, N, R | N: GTR; C: GY94 (M0-M13), MG94, HB and EM; A: 16 EMe | Yes | Gsitesb and/or Gregions, I | Yes | Heterogeneous | This study |
Note.—The column “Class” includes phylogenetic (where a phylogeny is user-specified), forward, birth–death, and coalescent approaches. The column “Evolutionary process” describes the implemented evolutionary scenarios: D (demographics), M (population structure and migration), R (recombination), L (lateral gene transfer), and S (selection). The column “Substitution process” refers to N (nucleotide), C (codon), and A (amino acid) substitution/replacement models. EM means “empirical model,” and it is indicated whether the model is fixed along the genome (homogeneous) or can change among genomic regions (heterogeneous). The column “Rate variation” indicates whether different sites can evolve under different rates (G: gamma distribution; I: proportion of invariable sites) and whether this level of heterogeneity can change across site positions (Gsites) and/or genomic regions (Gregions). The column “Indels” indicates the consideration of insertion and deletion events.
aCoding sequences are simulated through nucleotide substitution models just avoiding stop codons.
bThe rate of variation among sites can be user-specified.
cAmino acid models implemented in ALF: JTT, GCB, LG, WAG, CustomP.
dA maximum of three genomic regions based on different substitution models can be simulated.
eAmino acid models implemented in SGWE: Blosum62, CpRev, Dayhoff, DayhoffDCMUT, HIVb, HIVw, JTT, JonesDCMUT, LG, Mtart, Mtmam, Mtrev24, RtRev, VT, WAG, user-specified. See references in the supplementary material, Supplementary Material online.
Here, we present a simulation framework called SGWE (Simulation of Genome-Wide Evolution) that is able to simulate multigene data sets accounting for heterogeneous evolution across genomic regions. Importantly, this heterogeneity is controlled by the user through the specification of prior statistical distributions from which specific parameter values are sampled for each genomic region and replicate. Furthermore, evolutionary histories can be specified by the user or simulated by the multispecies coalescent with recombination—including hotspots and coldspots—demographics, and migration, among other evolutionary scenarios. We used this simulation framework to study the impact of variable codon frequencies across regions on the estimation of the dN/dS ratio.
New Approaches: SGWE
SGWE simulates genome-wide sequence evolution through the specification of genome-wide parameters and prior distributions for local parameters governing the evolution of the different genomic regions. Supplementary table S1, Supplementary Material online, shows a list of the different evolutionary scenarios that can be implemented in SGWE. The simulation procedure consists of two steps. In the first step, the user can specify every aspect of the simulation through a user-friendly Graphical User Interface (GUI), with the possibility of loading up to ten prespecified scenarios. The GUI window includes a series of frames where the user can define target evolutionary scenarios and the underlining prior distributions for the different parameters. In the second step, SGWE simulates each genomic region according to the specific genome-wide and local parameters sampled from the prior distributions. Each simulated replicate consists of a set of aligned genomes (fig. 1). Internally, each genomic region is simulated under the multispecies coalescent with recombination, including intracodon and hotspot recombination (Wiuf and Posada 2003; Arenas and Posada 2007; Arenas and Posada 2010), demographic periods, exponential growth, and several migration models with constant or time-dependent migration rates (Wright 1931; Kimura and Weiss 1964; Hudson 1998), longitudinal sampling (i.e., noncontemporaneous sequences) (Drummond et al. 2002), under multiple nucleotide, codon, and protein substitution/replacement models. SGWE implements nucleotide substitution models like GTR (Tavaré 1986) plus invariable sites and gamma-distributed rate variation among sites (i.e., the GTR+I+G model) (Yang 1994) and special cases of it. In addition, the user can select codon models like GY94 × M0-M10 (Yang et al. 2000; Anisimova et al. 2001) where dN/dS can vary across branches, MG94 (Muse and Gaut 1994), Halpern and Bruno (HB) (Halpern and Bruno 1998; Holder et al. 2008), or different empirical codon models (Schneider et al. 2005; Kosiol et al. 2007). Finally, SGWE also implements 16 empirical matrices and the CAT model (Lartillot and Philippe 2004) for amino acid replacement with variable frequencies across sites.
Fig. 1.
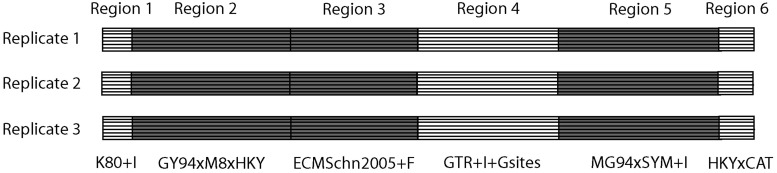
Depiction of three genome alignments simulated with SGWE. Each genome alignment contains six regions, printed with white and gray background to describe noncoding and coding regions, respectively. “+I” indicates proportion of invariable sites, and “+Gsites” indicates heterogeneity across sites according to a gamma distribution. “ECMSchn2005” indicates the empirical codon model by Schneider et al. (2005). “+F” indicates empirical frequencies (e.g., user-specified) are considered. “CAT” indicates that frequencies change across sites within a region.
Although SGWE implements a large variety of evolutionary scenarios and substitution models, it does not directly implement indel evolution. This is mainly based on the complexity of simulating the coalescent with recombination (Hudson and Kaplan 1988) with indels, because the former requires a fixed sequence length. However, in a way that is transparent to the user, SGWE is able to call INDELible (Fletcher and Yang 2009), a simulation software that implements a wide set of models of indel evolution along a fixed phylogeny.
The SGWE pipeline is written in Java, C, Perl, and R and is freely available from http://code.google.com/p/sgwe-project/ (last accessed March 4, 2014). The downloadable package includes executable files, source code, documentation, and a variety of practical examples. Furthermore, SGWE’s coalescent simulator can be used on its own on the command line for single locus simulations. This simulator is written in C, can run in parallel, and is freely available from http://code.google.com/p/coalevol/ (last accessed March 4, 2014).
Benchmarking
The implementation of SGWE was validated using theoretical expectations and/or comparisons with other simulation/analytical software. For example:
Different simulation outcomes, like the time to the most recent common ancestor (TMRCA) or the number of recombination events, were in agreement with theoretical expectations and with those obtained under the same settings using ms (Hudson 2002).
Simulated genealogies under diverse evolutionary scenarios were accurately reconstructed using Phyml (Guindon and Gascuel 2003).
Generating nucleotide and amino acid substitution models were correctly identified using jModelTest (Posada 2008) and ProtTest (Abascal et al. 2005), respectively.
Simulated dN/dS values were accurately estimated with PAML, Hyphy (Kosakovsky Pond et al. 2005), and SNAP (Korber 2000).
Further details are given in supplementary note S1, Supplementary Material online.
An Example: Influence of Heterogeneous Codon Frequencies and Substitution Rates on dN/dS Estimates
To illustrate a potential use of SGWE, we studied the influence of variable transition/transversion rates ratio (ti/tv) and variable codon frequencies on the estimation of dN/dS (e.g., Oleksyk et al. 2010; Kjeldsen et al. 2012; Smith et al. 2013). Using SWGE, we simulated genome alignments were dN/dS was kept constant across the different genomic regions, but ti/tv and the codon frequencies varied among them. Then, we estimated dN/dS assuming that all parameters were constant along the different genomic regions.
In the absence of rate variation among sites or regions, when only the ti/tv (fig. 2) or the GTR matrices (fig. 3 and supplementary figs. S1 and S2, Supplementary Material online, upper plots) varied across regions, the dN/dS estimates were very accurate. On the contrary, when the codon frequencies varied across regions, the global dN/dS was consistently underestimated (figs. 2 and 3 and supplementary figs. S1 and S2, Supplementary Material online; white bars). For example for simulated values of 2.0, 1.0, and 0.5, the average dN/dS estimates were 1.25 ± 0.04, 0.71 ± 0.02, and 0.43 ± 0.01, respectively (fig. 2). However, if the average of the local dN/dS estimates for each region was considered as an estimate of global dN/dS, the bias was not observed (figs. 2 and 3 and supplementary figs. S1 and S2, Supplementary Material online, upper plots; gray bars).
Fig. 2.

Influence of variable codon frequencies and variable ti/tv across regions on the estimation of the genome-wide dN/dS when the true dN/dS value is 0.5, 1.0, and 2.0. The horizontal dashed black line indicates the simulated dN/dS value. White bars indicate the estimated dN/dS from the entire genome, while the gray bars display the averaged dN/dS across regions. Error bars indicate 95% confidence intervals.
Fig. 3.

Influence of variable codon frequencies, variable transition rates, and gamma-distributed rate variation among sites and across regions on the estimation of the genome-wide dN/dS when the true dN/dS value is 1.0. The horizontal dashed black line indicates the true, simulated value. White bars indicate the estimated dN/dS from the entire genome, while the gray bars display the averaged dN/dS across regions. Error bars indicate 95% confidence intervals.
Introducing rate variation among sites and regions resulted in a very complex picture, where different combination of parameters resulted in underestimates or overestimates of the simulated dN/dS value (fig. 3 and supplementary figs. S1 and S2, Supplementary Material online). When codon frequencies were constant across regions, the M0 model resulted in accurate dN/dS estimates, but estimates under models M8 and especially M5 were biased upward. When codon frequencies varied across regions, the dN/dS estimates were biased downward. In general, these biases were more pronounced when different regions had distinct levels of among-site rate variation (fig. 3 and supplementary figs. S1 and S2, Supplementary Material online, lower plots).
Discussion
Sequence evolution across different genomic regions can be highly heterogeneous (e.g., Gibbs et al. 2007; Arbiza et al. 2011). Simulation and empirical studies tend to ignore this heterogeneity and assume that multigene data sets evolve under one or very few substitution models. SGWE implements a simulation framework to simulate genome-wide sequence evolution that accounts for evolutionary heterogeneity in time and (sequence) space, better reflecting the evolutionary process shaping real data. A key aspect of SGWE is that the heterogeneity of the whole evolutionary process can be parameterized according to statistical prior distributions specified by the user, allowing much needed flexibility. We believe that SGWE is complementary to other comprehensive tools like ALF, which implement a range of genomic events not included in SGWE but which cannot handle easily variation across regions and does not currently simulate population-genetic events such as recombination or lineage sorting within species trees.
At this point, SGWE’s coalescent simulator and INDELible cannot run at the same time in a given simulation experiment, so recombination simulations cannot be run with indels, for example. Which one to choose depends on the particular biological scenario that the user wants to implement. In general, coalescent simulations should be more useful in intraspecific scenarios or in interspecific situations with incomplete lineage sorting, and phylogenetic simulations with INDELible should be more appropriate for interspecific evolution with no phylogenomic incongruence (i.e., where gene trees across the genome are equal). A detailed list of the capabilities implemented in SGWE is shown in the supplementary table S1, Supplementary Material online.
As an example of the use of SGWE, we studied the impact of variable codon frequencies and among-site rate variation across genomic regions on the estimation of dN/dS. It is well known that protein-coding sequences usually show variable frequencies across protein regions as a consequence of protein folding, solvent accessibility, and protein function (e.g., Goldman et al. 1998; Lio and Goldman 1999; Liberles et al. 2012; Arenas et al. 2013). While different models of sequence evolution exist capable of accounting for this heterogeneity (Bruno 1996; Halpern and Bruno 1998; Pagel and Meade 2004; Holder et al. 2008), these are seldom used in real data—at least at the DNA and codon level—probably because they are computationally very intensive. Our simulation experiments with SGWE show that, in general, variable codon frequencies can result in the underestimation of genome-wide dN/dS values, while rate variation among sites and regions seem to have the opposite effect. On the other hand, the average of the regional estimates seems to be a good approximation of the genome-wide dN/dS value. The fact that model misspecification cause error in dN/dS estimation is hardly surprising, but our simulations confirm this expectation and more importantly quantify the bias. Indeed, most studies do not rely on a single, genome-wide dN/dS estimate, but they might still try to obtain single estimates from single genomic fragments that in fact could include distinct substitution models (i.e., fragments that encompass multiple genomic regions) and therefore be the subject of similar biases.
Here, we are under a model underfitting scenario, where the model assumed for parameter estimation is always simpler than the true model used to simulate the data. It is known that this circumstance usually leads to parameter underestimation, for example of the branch lengths or of the ti/tv ratio (Tamura 1992; Lemmon and Moriarty 2004). In our simulations, the reasons why some model violations can induce underestimation of the global dN/dS and others overestimation are not straightforward. Moreover, different misspecifications of the assumed model operate here in opposite directions. Ignoring variable codon frequencies seems to push the dN/dS estimates downward. In particular, we could see that this was due to the simultaneous underestimation of dN and the overestimation of dS. Also, increasing the number of variable regions accentuated this bias (data not shown). Codon frequency biases have been shown before to induce underestimation of dN/dS for some ML methods (Yang and Nielsen 2000). Accordingly, variation in GC content along a sequence seems to reduce the number of true positives of the branch-site test (Gharib and Robinson-Rechavi 2013).
On the other hand, ignoring rate variation among sites, especially when this change among regions, biased the dN/dS estimates upward under the M5 and M8 models, but not under the M0 model. The M5 model assumes a gamma distribution for dN/dS variation among sites, while M8 adds to M5 a proportion of sites with dN/dS > 1. In the simulations, dN/dS was always constant across regions, but the bias appeared when the substitution rate changed within regions, and specially when it did it in different way in different regions (i.e., according to different gamma distributions). The exact reasons for this are not straightforward, although it is known that the M5 and M8 models can be less conservative than the M0 model (Yang et al. 2000; Metzger and Thomas 2010).
Apart from simulation studies like the one implemented here, SGWE could also be used to benchmark species tree estimation, to understand the interactions between different evolutionary forces at the genome-wide level or to estimate evolutionary parameters and perform model choice using approximate Bayesian computation (Beaumont 2010; Lopes et al. 2014).
Material and Methods
Simulation of Variable Codon Frequencies, ti/tv, and Substitution Rates across Genomic Regions
Gene genealogies for each genomic region were simulated under the coalescent assuming a constant effective population size of 1,000 and a sample size of 15 individuals. Each individual genome was composed of 15 genomic regions or genes, with 150 codons each. Genomic sequences were evolved over these genealogies assuming a GY94 × M0 codon model under three genome-wide dN/dS values: 0.5, 1, and 2. Transition/transversion (ti/tv) ratios were either fixed to 0.5 or varied across regions according to a Uniform distribution truncated between 0.5 and 15. Substitution rates (A-C, A-G, A-T, C-G, C-T, G-T) varied across regions according to a Dirichlet distribution D(6,16,2,8,20,4) that was then scaled with the last rate. Scenarios with rate variation across sites were simulated according to a gamma distribution (+G) with shape 0.7. Scenarios where this gamma distribution varied across regions drew the different gamma shapes from to an exponential distribution with mean 2.0 and truncated between 0.5 and 5.0. Such parameter values are typical of RNA virus like HIV-1 (Carvajal-Rodriguez et al. 2006). Codon frequencies were specified according to the nucleotide frequencies at each codon position. The latter were either constant (0.25 for each codon position) or varied across regions according to a Dirichlet distribution (D(1,1,1,1) for each codon position). For each scenario, we simulated a total of 100 genome alignments.
Estimation of dN/dS
Genome-wide dN/dS values were estimated using the codeml program from PAML (Yang 2007) under the GY94 × M0 (constant dN/dS), GY94 × M5 (dN/dS follows a Gamma distribution), and GY94 × M8 (two categories, Beta distribution + dN/dS ≥ 1) codon models (Yang et al. 2000). We choose PAML because it is a well-known, commonly used, comprehensive, and validated software to estimate dN/dS. The assumed codon frequencies were calculated as a function of the empirical nucleotide frequencies at each codon position. As a sanity check, similar dN/dS estimates under GY94 × M0 codon model were obtained when we used Hyphy instead of PAML (supplementary fig. S4, Supplementary Material online).
Supplementary Material
Supplementary figures S1–S3 and tables S1–S6 are available at Molecular Biology and Evolution online (http://www.mbe.oxfordjournals.org/).
Acknowledgments
The authors thank Gina M. Cannarozzi for providing us the empirical codon matrix “ECMSchn2005” (Schneider et al. 2005). They also thank three anonymous reviewers for their constructive comments. This work was supported by the Spanish Government with the “Juan de la Cierva” fellowship JCI-2011-10452 to M.A. D.P. was financially supported by the European Research Council (ERC-2007-Stg 203161-PHYGENOM).
References
- Abascal F, Zardoya R, Posada D. ProtTest: selection of best-fit models of protein evolution. Bioinformatics. 2005;21:2104–2105. doi: 10.1093/bioinformatics/bti263. [DOI] [PubMed] [Google Scholar]
- Anisimova M, Bielawski JP, Yang Z. Accuracy and power of the likelihood ratio test in detecting adaptive molecular evolution. Mol Biol Evol. 2001;18:1585–1592. doi: 10.1093/oxfordjournals.molbev.a003945. [DOI] [PubMed] [Google Scholar]
- Arbiza L, Patricio M, Dopazo H, Posada D. Genome-wide heterogeneity of nucleotide substitution model fit. Genome Biol Evol. 2011;3:896–908. doi: 10.1093/gbe/evr080. [DOI] [PMC free article] [PubMed] [Google Scholar]
- Arenas M. Simulation of molecular data under diverse evolutionary scenarios. PLoS Comput Biol. 2012;8:e1002495. doi: 10.1371/journal.pcbi.1002495. [DOI] [PMC free article] [PubMed] [Google Scholar]
- Arenas M, Dos Santos HG, Posada D, Bastolla U. Protein evolution along phylogenetic histories under structurally constrained substitution models. Bioinformatics. 2013;29:3020–3028. doi: 10.1093/bioinformatics/btt530. [DOI] [PMC free article] [PubMed] [Google Scholar]
- Arenas M, Posada D. Recodon: coalescent simulation of coding DNA sequences with recombination, migration and demography. BMC Bioinformatics. 2007;8:458. doi: 10.1186/1471-2105-8-458. [DOI] [PMC free article] [PubMed] [Google Scholar]
- Arenas M, Posada D. Coalescent simulation of intracodon recombination. Genetics. 2010;184:429–437. doi: 10.1534/genetics.109.109736. [DOI] [PMC free article] [PubMed] [Google Scholar]
- Beaumont MA. Approximate Bayesian computation in evolution and ecology. Annu Rev Ecol Evol Syst. 2010;41:379–405. [Google Scholar]
- Beiko RG, Charlebois RL. A simulation test bed for hypotheses of genome evolution. Bioinformatics. 2007;23:825–831. doi: 10.1093/bioinformatics/btm024. [DOI] [PubMed] [Google Scholar]
- Bruno WJ. Modeling residue usage in aligned protein sequences via maximum likelihood. Mol Biol Evol. 1996;13:1368–1374. doi: 10.1093/oxfordjournals.molbev.a025583. [DOI] [PubMed] [Google Scholar]
- Carvajal-Rodriguez A. GENOMEPOP: a program to simulate genomes in populations. BMC Bioinformatics. 2008;9:223. doi: 10.1186/1471-2105-9-223. [DOI] [PMC free article] [PubMed] [Google Scholar]
- Carvajal-Rodriguez A, Crandall KA, Posada D. Recombination estimation under complex evolutionary models with the coalescent composite-likelihood method. Mol Biol Evol. 2006;23:817–827. doi: 10.1093/molbev/msj102. [DOI] [PMC free article] [PubMed] [Google Scholar]
- Dalquen DA, Anisimova M, Gonnet GH, Dessimoz C. ALF—a simulation framework for genome evolution. Mol Biol Evol. 2012;29:1115–1123. doi: 10.1093/molbev/msr268. [DOI] [PMC free article] [PubMed] [Google Scholar]
- Drummond AJ, Nicholls GK, Rodrigo AG, Solomon W. Estimating mutation parameters, population history and genealogy simultaneously from temporally spaced sequence data. Genetics. 2002;161:1307–1320. doi: 10.1093/genetics/161.3.1307. [DOI] [PMC free article] [PubMed] [Google Scholar]
- Excoffier L, Foll M. fastsimcoal: a continuous-time coalescent simulator of genomic diversity under arbitrarily complex evolutionary scenarios. Bioinformatics. 2011;27:1332–1334. doi: 10.1093/bioinformatics/btr124. [DOI] [PubMed] [Google Scholar]
- Excoffier L, Novembre J, Schneider S. SIMCOAL: a general coalescent program for the simulation of molecular data in interconnected populations with arbitrary demography. J Hered. 2000;91:506–509. doi: 10.1093/jhered/91.6.506. [DOI] [PubMed] [Google Scholar]
- Fletcher W, Yang Z. INDELible: a flexible simulator of biological sequence evolution. Mol Biol Evol. 2009;26:1879–1888. doi: 10.1093/molbev/msp098. [DOI] [PMC free article] [PubMed] [Google Scholar]
- Gharib WH, Robinson-Rechavi M. The branch-site test of positive selection is surprisingly robust but lacks power under synonymous substitution saturation and variation in GC. Mol Biol Evol. 2013;30:1675–1686. doi: 10.1093/molbev/mst062. [DOI] [PMC free article] [PubMed] [Google Scholar]
- Gibbs RA, Rogers J, Katze MG, Bumgarner R, Weinstock GM, Mardis ER, Remington KA, Strausberg RL, Venter JC, Wilson RK, et al. Evolutionary and biomedical insights from the rhesus macaque genome. Science. 2007;316:222–234. doi: 10.1126/science.1139247. [DOI] [PubMed] [Google Scholar]
- Goldman N, Thorne JL, Jones DT. Assessing the impact of secondary structure and solvent accessibility on protein evolution. Genetics. 1998;149:445–458. doi: 10.1093/genetics/149.1.445. [DOI] [PMC free article] [PubMed] [Google Scholar]
- Guindon S, Gascuel O. A simple, fast, and accurate algorithm to estimate large phylogenies by maximum likelihood. Syst Biol. 2003;52:696–704. doi: 10.1080/10635150390235520. [DOI] [PubMed] [Google Scholar]
- Halpern AL, Bruno WJ. Evolutionary distances for protein-coding sequences: modeling site-specific residue frequencies. Mol Biol Evol. 1998;15:910–917. doi: 10.1093/oxfordjournals.molbev.a025995. [DOI] [PubMed] [Google Scholar]
- Hoban S, Bertorelle G, Gaggiotti OE. Computer simulations: tools for population and evolutionary genetics. Nat Rev Genet. 2012;13:110–122. doi: 10.1038/nrg3130. [DOI] [PubMed] [Google Scholar]
- Holder MT, Zwickl DJ, Dessimoz C. Evaluating the robustness of phylogenetic methods to among-site variability in substitution processes. Philos Trans R Soc Lond B Biol Sci. 2008;363:4013–4021. doi: 10.1098/rstb.2008.0162. [DOI] [PMC free article] [PubMed] [Google Scholar]
- Hudson RR. Island models and the coalescent process. Mol Ecol. 1998;7:413–418. [Google Scholar]
- Hudson RR. Generating samples under a Wright-Fisher neutral model of genetic variation. Bioinformatics. 2002;18:337–338. doi: 10.1093/bioinformatics/18.2.337. [DOI] [PubMed] [Google Scholar]
- Hudson RR, Kaplan NL. The coalescent process in models with selection and recombination. Genetics. 1988;120:831–840. doi: 10.1093/genetics/120.3.831. [DOI] [PMC free article] [PubMed] [Google Scholar]
- Kimura M, Weiss GH. The stepping stone model of population structure and the decrease of genetic correlation with distance. Genetics. 1964;49:561–576. doi: 10.1093/genetics/49.4.561. [DOI] [PMC free article] [PubMed] [Google Scholar]
- Kjeldsen KU, Bataillon T, Pinel N, De Mita S, Lund MB, Panitz F, Bendixen C, Stahl DA, Schramm A. Purifying selection and molecular adaptation in the genome of Verminephrobacter, the heritable symbiotic bacteria of earthworms. Genome Biol Evol. 2012;4:307–315. doi: 10.1093/gbe/evs014. [DOI] [PMC free article] [PubMed] [Google Scholar]
- Korber B. HIV signature and sequence variation analysis. In: Rodrigo AG, Learn GH, editors. 2000. Computational analysis of HIV molecular sequences. Dordrecht (The Netherlands): Kluwer Academic Publishers. p. 55–72. [Google Scholar]
- Kosakovsky Pond SL, Frost SD, Muse SV. HYPHY: hypothesis testing using phylogenies. Bioinformatics. 2005;21:676–679. doi: 10.1093/bioinformatics/bti079. [DOI] [PubMed] [Google Scholar]
- Kosiol C, Holmes I, Goldman N. An empirical codon model for protein sequence evolution. Mol Biol Evol. 2007;24:1464–1479. doi: 10.1093/molbev/msm064. [DOI] [PubMed] [Google Scholar]
- Lartillot N, Philippe H. A Bayesian mixture model for across-site heterogeneities in the amino-acid replacement process. Mol Biol Evol. 2004;21:1095–1109. doi: 10.1093/molbev/msh112. [DOI] [PubMed] [Google Scholar]
- Lemmon AR, Moriarty EC. The importance of proper model assumption in bayesian phylogenetics. Syst Biol. 2004;53:265–277. doi: 10.1080/10635150490423520. [DOI] [PubMed] [Google Scholar]
- Liberles DA, Teichmann SA, Bahar I, Bastolla U, Bloom J, Bornberg-Bauer E, Colwell LJ, de Koning AP, Dokholyan NV, Echave J, et al. The interface of protein structure, protein biophysics, and molecular evolution. Protein Sci. 2012;21:769–785. doi: 10.1002/pro.2071. [DOI] [PMC free article] [PubMed] [Google Scholar]
- Lio P, Goldman N. Using protein structural information in evolutionary inference: transmembrane proteins. Mol Biol Evol. 1999;16:1696–1710. doi: 10.1093/oxfordjournals.molbev.a026083. [DOI] [PubMed] [Google Scholar]
- Lopes JS, Arenas M, Posada D, Beaumont MA. Coestimation of Recombination, Substitution and Molecular Adaptation rates by approximate Bayesian computation. Heredity. 2014;112:255–264. doi: 10.1038/hdy.2013.101. [DOI] [PMC free article] [PubMed] [Google Scholar]
- Metzger KJ, Thomas MA. Evidence of positive selection at codon sites localized in extracellular domains of mammalian CC motif chemokine receptor proteins. BMC Evol Biol. 2010;10:139. doi: 10.1186/1471-2148-10-139. [DOI] [PMC free article] [PubMed] [Google Scholar]
- Muse SV, Gaut BS. A likelihood approach for comparing synonymous and nonsynonymous nucleotide substitution rates, with application to the chloroplast genome. Mol Biol Evol. 1994;11:715–724. doi: 10.1093/oxfordjournals.molbev.a040152. [DOI] [PubMed] [Google Scholar]
- Oleksyk TK, Smith MW, O'Brien SJ. Genome-wide scans for footprints of natural selection. Philos Trans R Soc Lond B Biol Sci. 2010;365:185–205. doi: 10.1098/rstb.2009.0219. [DOI] [PMC free article] [PubMed] [Google Scholar]
- Pagel M, Meade A. A phylogenetic mixture model for detecting pattern-heterogeneity in gene sequence or character-state data. Syst Biol. 2004;53:571–581. doi: 10.1080/10635150490468675. [DOI] [PubMed] [Google Scholar]
- Posada D. jModelTest: phylogenetic model averaging. Mol Biol Evol. 2008;25:1253–1256. doi: 10.1093/molbev/msn083. [DOI] [PubMed] [Google Scholar]
- Schneider A, Cannarozzi GM, Gonnet GH. Empirical codon substitution matrix. BMC Bioinformatics. 2005;6:134. doi: 10.1186/1471-2105-6-134. [DOI] [PMC free article] [PubMed] [Google Scholar]
- Smith LM, McWhorter AR, Shellam GR, Redwood AJ. The genome of murine cytomegalovirus is shaped by purifying selection and extensive recombination. Virology. 2013;435:258–268. doi: 10.1016/j.virol.2012.08.041. [DOI] [PubMed] [Google Scholar]
- Tamura K. Estimation of the number of nucleotide substitutions when there are strong transition-transversion and G+C content biases. Mol Biol Evol. 1992;9:678–687. doi: 10.1093/oxfordjournals.molbev.a040752. [DOI] [PubMed] [Google Scholar]
- Tavaré S. Some probabilistic and statistical problems in the analysis of DNA sequences. In: Miura RM, editor. 1986. Some mathematical questions in biology—DNA sequence analysis. Providence (RI): Amer Math Soc. p. 57–86. [Google Scholar]
- Varadarajan A, Bradley RK, Holmes IH. Tools for simulating evolution of aligned genomic regions with integrated parameter estimation. Genome Biol. 2008;9:R147. doi: 10.1186/gb-2008-9-10-r147. [DOI] [PMC free article] [PubMed] [Google Scholar]
- Wiuf C, Posada D. A coalescent model of recombination hotspots. Genetics. 2003;164:407–417. doi: 10.1093/genetics/164.1.407. [DOI] [PMC free article] [PubMed] [Google Scholar]
- Wright S. Evolution in Mendelian populations. Genetics. 1931;16:97–159. doi: 10.1093/genetics/16.2.97. [DOI] [PMC free article] [PubMed] [Google Scholar]
- Yang Z. Maximum likelihood phylogenetic estimation from DNA sequences with variable rates over sites: approximate methods. J Mol Evol. 1994;39:306–314. doi: 10.1007/BF00160154. [DOI] [PubMed] [Google Scholar]
- Yang Z. PAML 4: phylogenetic analysis by maximum likelihood. Mol Biol Evol. 2007;24:1586–1591. doi: 10.1093/molbev/msm088. [DOI] [PubMed] [Google Scholar]
- Yang Z, Nielsen R. Estimating synonymous and nonsynonymous substitution rates under realistic evolutionary models. Mol Biol Evol. 2000;17:32–43. doi: 10.1093/oxfordjournals.molbev.a026236. [DOI] [PubMed] [Google Scholar]
- Yang Z, Nielsen R, Goldman N, Pedersen A-MK. Codon-substitution models for heterogeneous selection pressure at amino acid sites. Genetics. 2000;155:431–449. doi: 10.1093/genetics/155.1.431. [DOI] [PMC free article] [PubMed] [Google Scholar]
Associated Data
This section collects any data citations, data availability statements, or supplementary materials included in this article.