Abstract
Purpose.
We previously demonstrated that most eyes have regionally variable extensions of Bruch's membrane (BM) inside the clinically identified disc margin (DM) that are clinically and photographically invisible. We studied the impact of these findings on DM- and BM opening (BMO)-derived neuroretinal rim parameters.
Methods.
Disc stereo-photography and spectral domain optical coherence tomography (SD-OCT, 24 radial B-scans centered on the optic nerve head) were performed on 30 glaucoma patients and 10 age-matched controls. Photographs were colocalized to SD-OCT data such that the DM and BMO could be visualized in each B-scan. Three parameters were computed: (1) DM-horizontal rim width (HRW), the distance between the DM and internal limiting membrane (ILM) along the DM reference plane; (2) BMO-HRW, the distance between BMO and ILM along the BMO reference plane; and (3) BMO-minimum rim width (MRW), the minimum distance between BMO and ILM. Rank-order correlations of sectors ranked by rim width and spatial concordance measured as angular distances between equivalently ranked sectors were derived.
Results.
The average DM position was external to BMO in all quadrants, except inferotemporally. There were significant sectoral differences among all three rim parameters. DM-HRW and BMO-HRW sector ranks were better correlated (median ρ = 0.84) than DM-HRW and BMO-MRW (median ρ = 0.55), or BMO-HRW and BMO-MRW (median ρ = 0.60) ranks. Sectors with the narrowest BMO-MRW were infrequently the same as those with the narrowest DM-HRW or BMO-HRW.
Conclusions.
BMO-MRW quantifies the neuroretinal rim from a true anatomical outer border and accounts for its variable trajectory at the point of measurement.
Current neuroretinal rim assessment lacks anatomical validity because the disc margin is not a consistent outer border of neural tissue and measurement is not made perpendicular to it. A parameter overcoming these limitations is described.
Introduction
Examination of the optic nerve head (ONH) includes assessment of the neuroretinal rim from the clinically identified optic disc margin (DM) to the cup edge. Identification of the DM is necessary whether the evaluation is clinical, photographic, or based on imaging techniques, such as scanning laser tomography. In clinical or photographic examination, the cup margin is defined subjectively on assessment of the contour of the ONH surface. With scanning laser tomography, the cup is delineated according to a reference plane relative to the height of a portion of the internal limiting membrane (ILM) corresponding to the DM.1–3 With spectral domain optical coherence tomography (SD-OCT), some investigators have defined the cup as the portion of the ILM below a plane that connects Bruch's membrane opening (BMO).4,5
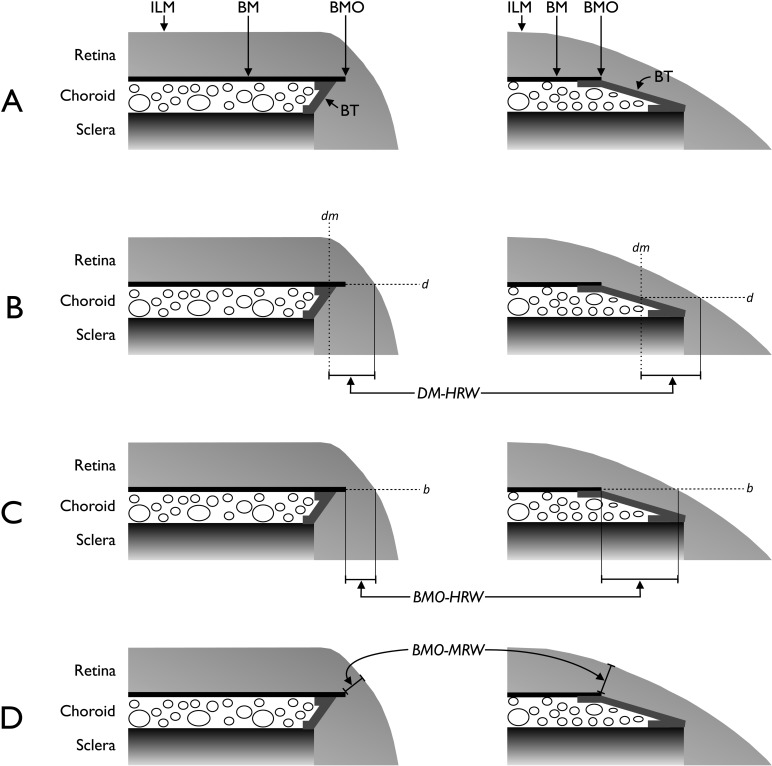
The DM is a clinical construct that presumes there is a single anatomical structure that forms the outer border of the neural tissues of the ONH.6 We recently marked the clinical DM in stereo disc photographs and then colocalized the photographs to SD-OCT B-scans of the same ONHs such that positions of the DM and BMO in each B-scan could be visualized and analyzed.7 In that report, we presented two findings that challenge previously held concepts about human DM anatomy and that have significant bearing on the assessment of the ONH in glaucoma. First, in an individual eye, the clinically identified DM is rarely a single anatomical structure and can coincide with either (1) BMO, (2) border tissue of Elschnig, or (3) a combination of Bruch's membrane (BM) and border tissue. Second, in most eyes there are regionally variable internal extensions of BM that are not photographically or clinically detectable as the DM. Taken together, these findings undermine the concept that the clinically identified DM is a consistent outer border for neuroretinal rim assessment. Because retinal ganglion cell axons cannot pass through BM to exit the eye, in cases with extensions of BM internal to the DM, the actual neuroretinal rim is narrower than that estimated by DM assessment, potentially resulting in significant errors in the estimation of the remaining rim. Furthermore, because the trajectory of the axons over the ONH depends on the orientation of border tissue, an assessment of conventional rim width (hereafter referred to as horizontal rim width) is likely to be inaccurate. For example, in eyes where the trajectory of the axons is more horizontal to the plane of measurement, a wider rim estimate is obtained compared with eyes with the same number of axons but where the trajectory of the axons is more perpendicular (Fig. 1).
Figure 1.
Schematic representations of the neuroretinal rim parameters. (A) Salient anatomical features of the optic disc margin in internally oblique border tissue (BT) configuration (left) where BT extends internally from the anterior scleral opening to fuse with BM and externally oblique BT configuration (right) where BT extends externally from the anterior scleral opening to fuse with BM. For simplicity, the retinal pigment epithelium is not shown. (B) Representation of DM-HRW, the distance from the projection (dm) of the DM from the optic disc photograph to the ILM in the DM reference plane (d). (C) Representation of BMO-HRW, the distance from BMO to the ILM in the BMO reference plane (b). (D) Representation of BMO-MRW, the minimum distance from BMO to the ILM irrespective of the plane. Horizontal rim width measurements (B and C) depend on the trajectory of the retinal nerve fiber layer at the point of measurement resulting in larger measurements when the trajectory is more horizontal (right compared with left).
Hence, the basis for current rim measurements lacks a solid anatomical foundation because (1) the clinical DM is not a consistent outer border of the rim tissue and (2) the orientation of neural tissue in the ONH is not accounted for.
In the present article, we postulate that current DM- and BMO-based rim assessment is inaccurate. We propose a parameter called BMO minimum rim width (BMO-MRW) that measures the minimum width of the rim from BMO, an actual anatomical landmark of the outer rim border. The theoretical advantages of BMO-MRW are twofold. First, it takes into account the clinically invisible, but SD-OCT–detected extensions of BM. Second, because BMO-MRW measurement is made perpendicular to the axis of the neural tissue, it takes into account the variable trajectory of axons over the point of measurement, akin to current strategies for measuring peripapillary retinal nerve fiber layer thickness. We present comparative analyses of current DM-based horizontal rim width assessments, corresponding to clinical, photographic, or scanning laser tomographic analyses, to those based on the SD-OCT–detected BMO.
Methods
The subjects, detailed inclusion and exclusion criteria, and some of the methods used in the present study have been described in detail in a previous publication7; however, the salient details are provided in the following sections.
Participants
The subjects in the study were obtained from two ongoing prospective follow-up studies at the Eye Care Centre, Queen Elizabeth II Health Science Centre, Halifax, Nova Scotia. Thirty open-angle glaucoma patients (10 patients each representing focal, diffuse, and sclerotic optic disc damage8) and 10 age-matched healthy controls were enrolled. The patients had glaucomatous visual field damage with standard automated perimetry performed with the 24-2 SITA program9 of the Humphrey Field Analyzer (Carl Zeiss Meditec, Dublin, CA) defined by an abnormal Glaucoma Hemifield Test.10 Control subjects had a normal eye examination, intraocular pressure lower than 21 mm Hg, and a normal visual field defined by a normal Glaucoma Hemifield Test, and mean deviation and pattern SD within normal limits. One eye was randomly selected as the study eye.
The research followed the tenets of the Declaration of Helsinki and subjects gave informed consent to participate in the study. The protocol was approved by the Capital Health Research Ethics Board.
Imaging
The ONH of the study eye was imaged with conventional stereo disc photography (FF3, Carl Zeiss Jena GmbH, Jena, Germany) and SD-OCT (Spectralis, Heidelberg Engineering GmbH, Heidelberg, Germany). A radial scanning pattern centered on the ONH was used to obtain 24 radial B-scans, 15° apart and subtending 15°. Each radial B-scan comprised an average of 30 images with a transverse sampling of 768 pixels (or A-scans). Color slides from the fundus camera were digitized and viewed on a computer monitor with a stereo viewer (Screen Vu, PS Mfg, Portland, OR).
Registration and Colocalization of SD-OCT Images and Optic Disc Photographs
For each eye, the optic disc photograph and the infrared disc image obtained with SD-OCT data were first registered with public domain software (ImageJ, version 1.43u, TurboReg plug-in, National Institutes of Health, Bethesda, MD). Segmentation data (see below) were then colocalized with specialized software based on the Visualization Toolkit (VTK, Clifton Park, NY).11,12 The registration and colocalization procedure is illustrated in a video clip (Supplemental material: Clip 1; supplemental material is available at: http://www.iovs.org/content/53/4/1852/suppl/DC1).
Segmentation of ONH Structures
The clinically identified DM was defined as the innermost border of reflective tissue that was internal to any pigmented tissue (if present) and within which only neural tissue was present. The DM was manually segmented in the registered optic disc photograph by one observer (ASCR) and then reviewed together with three additional observers (MTN, CFB, and BCC) to concur on the location of the DM. The observers also had access to the original stereo-photograph slides. Additionally, for each of the 24 B-scans, one observer (ASCR) segmented the termination of BM (i.e., BMO) and the ILM. All eyes were then transformed to right-eye format.
The software determined the horizontal (transverse) projection of the clinically identified DM in each B-scan. The vertical (depth) position of the DM in the B-scan was positioned by the observer along the fixed horizontal projection and coincided with (1) BMO, (2) border tissue of Elschnig, or (3) a combination of BM and border tissue.7 The positions of DM and BMO were therefore colocalized to both sets of images (Supplemental material: Clip 1).
ONH and Neuroretinal Rim Parameters
The 24 radial B-scans yielded 48 sector positions around the ONH marking the DM and BMO. A spline was fitted to the DM points to generate a closed curve within which the clinical optic disc area (DM area) was computed. The BMO points were similarly fitted to derive the BMO curve and BMO area. With the 3-dimensional coordinates of the DM points, a best-fit planar surface representing the DM reference plane was established. Similarly, a BMO reference plane was established with the BMO points.
Three neuroretinal rim parameters were derived from the B-scans and are described in Figure 1. For each B-scan, the DM horizontal rim width (DM-HRW) was defined as the distance between the projection of the DM to the DM reference plane and ILM along the DM reference plane. DM-HRW is equivalent to the rim width measurement made clinically, photographically, or with scanning laser tomography. The BMO horizontal rim width (BMO-HRW) was defined as the distance between the projection of BMO to the BMO reference plane and ILM along the BMO reference plane. BMO-HRW is equivalent to measurements recently described with SD-OCT.4,13,14 Finally, the BMO-MRW was defined as the minimum distance between BMO and the ILM. Sectoral values for the three rim parameters were computed at 48 equally spaced angular positions around the BMO center.
Statistical Analysis
Comparisons between DM area and BMO area were made first. Sectoral differences between all pairs of rim parameters (i.e., DM-HRW, BMO-HRW, and BMO-MRW) were analyzed. To determine if there was any spatial concordance between the rim parameters, two analyses were performed after ranking the rim widths (from widest to narrowest) independently within the 48 sector positions around the ONH. First, a Spearman nonparametric correlation analysis for all three possible rim parameter comparisons was performed by correlating the ranks of corresponding sector positions (e.g., the DM-HRW rank versus the BMO-HRW rank of sector positions 1 through 48). The distribution of the correlation coefficients provided an indication of how close the ranks for pairs of rim parameters were. Second, the distribution of angular distances in degrees between all possible pairs of equivalently ranked sectors was determined (e.g., the angle between the sector positions of DM-HRW and BMO-HRW ranked 1 through 48).
Group and paired differences were analyzed with the Mann-Whitney and Wilcoxon tests, respectively. Differences in the three rim parameters among patients and controls as well as among the sector positions were evaluated with a mixed-effect model ANOVA. Spearman's nonparametric correlation analysis was performed for pairs of comparisons, and differences in the distributions of correlation coefficients were evaluated with the Friedman test.
Results
The median (range) age of the 30 glaucoma patients and 10 controls was 68.1 (42 to 86) and 63.5 (42 to 77) years, respectively. The respective values for visual field mean deviation were −2.9 (−13.0 to −0.21) dB and 0.6 (−1.7 to 1.7) dB. The age difference between the groups was not statistically significant (P = 0.43, Mann-Whitney test), whereas the mean deviation difference was (P < 0.01).
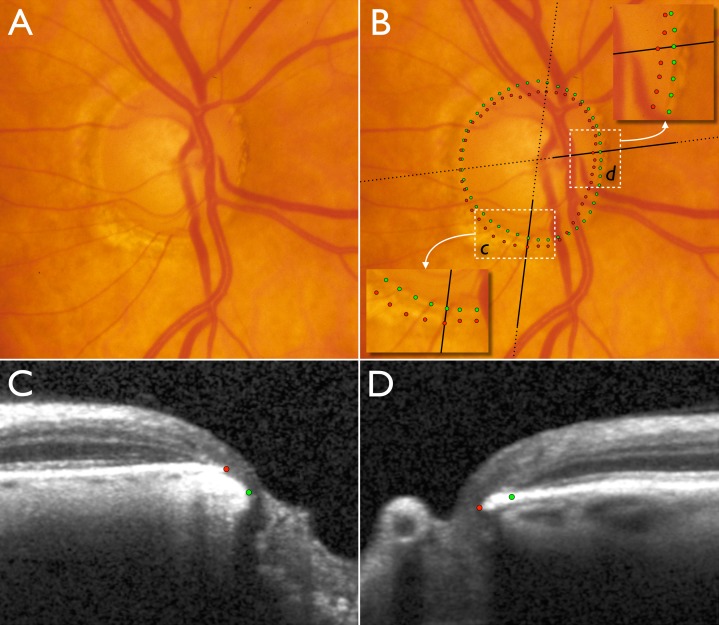
The significant differences between clinical and SD-OCT–based neuroretinal rim evaluation are illustrated in Figure 2. Video clips showing all 24 radial B-scans with unmarked (Supplemental material: Clip 2) and marked DM, BMO, ILM, and BMO-MRW (Supplemental material: Clip 3) are also provided. In the inferotemporal sector, there is apparently little or no rim visible in the disc photograph; however, SD-OCT allows visualization of the relevant ONH anatomy and indicates that the rim is wider than either clinical examination or disc photography would indicate. On the other hand, in the nasal sector, clinical DM-based assessment overestimates the amount of remaining rim because the DM is external to BMO, the anatomical outer border of the rim.
Figure 2.
Disc photograph and two (of 24) SD-OCT radial B-scans of the right optic nerve head of a glaucoma patient. (A) Disc photograph with localized cupping and apparently very little or no neuroretinal rim remaining in the inferotemporal sector. (B) Clinical DM positions obtained from examination of stereo disc photographs (green) and projected BMO (red) positions obtained from SD-OCT scans. Insets show magnified areas in c and d. Dotted black lines indicate the orientation of the radial B-scans and bold solid black lines indicate the section of the B-scans shown in C and D. (C) B-scan corresponding to inset c. (D) B-scan corresponding to inset in d. In the inferotemporal section (c and C), BMO is external to DM. In this quadrant, SD-OCT detects rim tissue that is not clinically evident in the photograph. In the nasal section (d and D), BMO is internal to DM and SD-OCT detects a narrower rim than clinically apparent.
Although the DM area was highly correlated to the BMO area (Spearman's ρ = 0.84, P < 0.01), DM area was consistently larger than BMO area in both patients (1.96 [1.41 to 2.90] and 1.85 [1.33 to 2.78] mm2 respectively, P < 0.01, Wilcoxon test) and controls (1.75 [1.15 to 2.17] and 1.59 [1.04 to 1.94] mm2 respectively, P < 0.01). Analyses of the positions of DM and BMO in the 48 sectors showed notable regional variations. The mean position of the DM was external to that of the BMO for most of the ONH; however, the reverse was the case in the inferotemporal quadrant in both patients and controls (Fig. 3).
Figure 3.
Sectoral mean difference plot of clinical DM width and BMO width from the BMO center in glaucoma patients (left) and age-matched controls (right). All data are converted to right-eye format and data points represent the 48 sector positions obtained from the 24 radial B-scans. SN, superior nasal; N, nasal; IN, inferonasal; IT, inferotemporal; T, temporal; ST, superotemporal.
Regional variations were observed in the comparison between DM-HRW and BMO-HRW (Fig. 4). In glaucoma patients, the DM-HRW was on average wider than the mean BMO-HRW, although the magnitude of the regional differences varied significantly from approximately 70 μm superotemporally to approximately 5 μm inferotemporally (P < 0.01, ANOVA). The difference between DM-HRW and BMO-HRW was not different between patients and controls (P = 0.27).
Figure 4.
Sectoral mean difference plot of clinical DM-HRW and BMO-HRW in glaucoma patients (left) and age-matched controls (right). All data are converted to right-eye format and data points represent the 48 sector positions obtained from the 24 radial B-scans. SN, superior nasal; N, nasal; IN, inferonasal; IT, inferotemporal; T, temporal; ST, superotemporal.
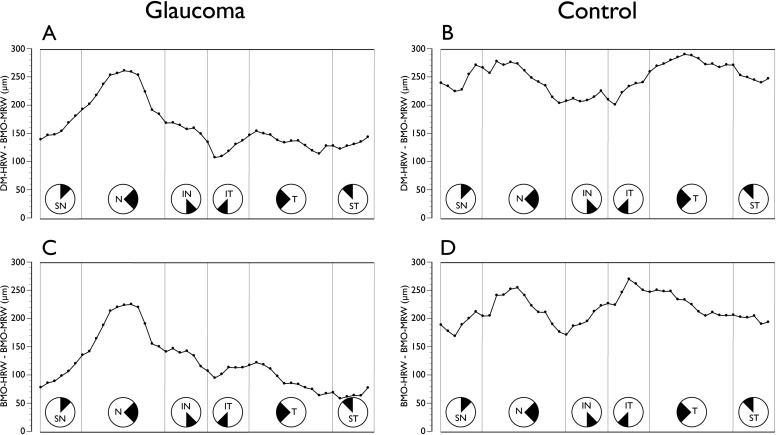
Although by definition BMO-MRW was consistently smaller than either DM-HRW or BMO-HRW (Fig. 5), the differences varied according to sector (P < 0.01). In patients, the largest difference between DM-HRW and BMO-MRW occurred nasally, whereas in controls it was nasally and temporally. The difference between patients and controls reached borderline statistical significance (P = 0.07, ANOVA). The largest difference between BMO-HRW and BMO-MRW occurred nasally in patients and nasally and inferotemporally in controls. The difference between patients and controls was statistically significant (P = 0.03).
Figure 5.
Comparison of conventional horizontal rim width measurements to BM-MRW. (A) Sectoral mean difference plot of clinical DM-HRW and BMO-MRW in glaucoma patients and (B) in age-matched controls. (C) Sectoral mean difference plot of BMO-HRW and BMO-MRW in glaucoma patients and (D) in age-matched controls. All data are converted to right-eye format and data points represent the 48 sector positions obtained from the 24 radial B-scans. SN, superior nasal; N, nasal; IN, inferonasal; IT, inferotemporal; T, temporal; ST, superotemporal.
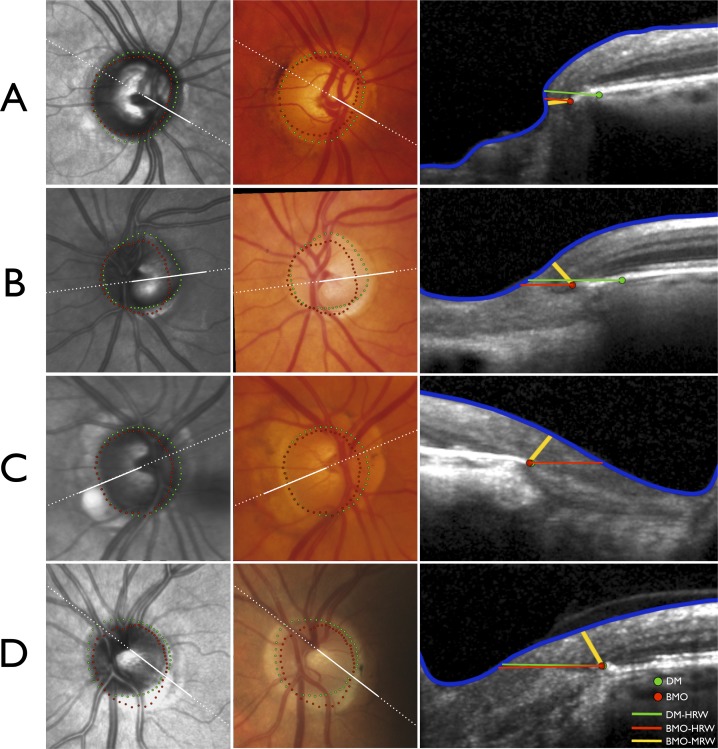
Examples of the significant variations in the sectoral position of the DM and BMO, and their influence on DM- and BMO-based rim parameters, are shown Figure 6. Two cases (Figs. 6A, 6B) illustrate that DM-based rim assessment can be erroneous because the clinically invisible BMO and not the DM represents the anatomical external border of the rim tissue. Two cases (Figs. 6C, 6D) illustrate even when DM and BMO coincide, a horizontal rim assessment (DM-HRW or BMO-HRW) is larger than one made perpendicular to the axis of the neural tissue (BMO-MRW). In these cases, BMO-MRW is identical yet the horizontal rim assessments are substantially different. In two of these cases (Figs. 6B, 6D), there was significant discordance between the clinically identified DM and the SD-OCT–identified BMO. A version of Figure 6 without the DM, BMO, or rim width markings is also shown (Supplemental material: Fig. S1)
Figure 6.
Four illustrative cases (A–D) demonstrating the impact of variations in optic nerve head (ONH) anatomy on neuroretinal rim measurements. Infrared image from anatomical SD-OCT (left), registered optic disc photograph (center) and SD-OCT B-scans (right). Dashed white lines indicate the orientation of the radial B-scans and solid white lines indicate the section of the B-scans shown. (A) Right ONH of a glaucoma patient with extension of BMO internal to the clinically visible DM in all sectors except temporally resulting in DM-HRW being erroneously larger than BMO-HRW or BMO-MRW. (B) Significant mismatch between DM and BMO in the left ONH of a glaucoma patient. In the radial section shown in the temporal sector, DM-HRW is erroneously larger than BMO-HRW; however, because the trajectory of the nerve fiber layer is more parallel to the DM and BMO plane, BMO-MRW is considerably smaller. (C) Right ONH of a glaucoma patient with internal extension of BM in the nasal half and the superior temporal sector of the disc. Although the DM and BMO almost coincide in the radial section shown in the temporal sector yielding similar DM-HRW and BMO-HRW measurements, BMO-MRW is substantially smaller. (D) Left ONH of a healthy subject with significant mismatch between DM and BMO, with DM internal to BMO in the inferior temporal quadrant and BMO internal to DM in the remainder of the disc. Although the DM and BMO almost coincide in the radial section shown with similar DM-HRW and BMO-HRW measurements, BMO-MRW is substantially smaller owing to the trajectory of the nerve fiber layer.
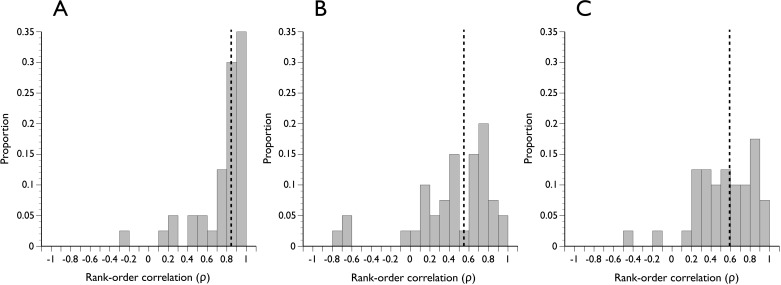
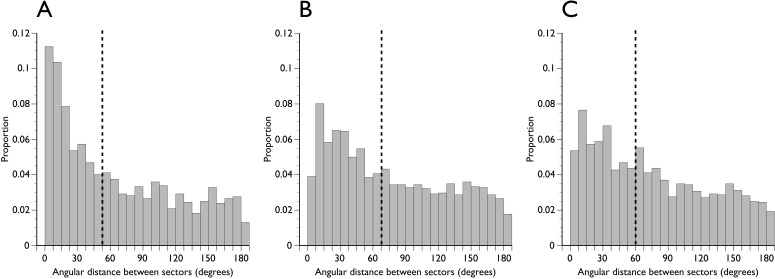
There was a larger spatial discordance between either DM-HRW or BMO-HRW and BMO-MRW than between DM-HRW and BMO-HRW. The respective Spearman ρ had medians of 0.55, 0.60, and 0.84, respectively, and were significantly different (Fig. 7, P < 0.01). The angular distance between equivalently ranked pairs of rim parameters is shown in Figure 8. For comparisons of DM-HRW and BMO-HRW sectors, 11.3% of equivalently ranked sector positions according to rim width were actually the same sector (angular distance = 0). The distribution of angular distance between equivalently ranked DM-HRW and BMO-MRW and between equivalently ranked BMO-HRW and BMO-MRW was closer to uniform, suggesting little spatial concordance between the horizontal rim parameters and BMO-MRW (Fig. 8).
Figure 7.
Distribution of Spearman rank-order correlation coefficients in all subjects of ranks of optic nerve head sector positions according to the width of the neuroretinal rim. The magnitude of correlation indicates the degree to which sectors are spatially related according to rim width. (A) DM-HRW and BMO-HRW. (B) DM-HRW and BMO-MRW. (C) BMO-HRW and BMO-MRW. Dashed vertical line indicates the median of the distribution.
Figure 8.
Distribution of angular distance between equivalently ranked optic nerve head sector positions. (A) DM-HRW and BMO-HRW. (B) DM-HRW and BMO-MRW. (C) BMO-HRW and BMO-MRW. Dashed vertical line indicates the median of the distribution.
Discussion
Imaging with SD-OCT has enabled clinicians to visualize key structures of the ONH and their variations, which to date has not been possible in vivo.15–18 Principal among these structures is BM and its termination. Assessing the neuroretinal rim requires a stable and consistent anatomical landmark and, as such, recognizing BMO may prove vital. BMO represents an actual anatomical border through which retinal ganglion cell axons have to pass to exit the eye and against which an accurate assessment of quantitative rim parameters can be made. We recently showed that the clinically identified DM is a clinical construct that does not reference a consistent anatomical structure within or between eyes and is therefore not a suitable outer border for the rim.7 Furthermore, because in most eyes, there is an invisible extension of BM internal to the clinically determined DM, current methods of rim evaluation, including cup-to-disc ratio and rim area, are unlikely to accurately represent the remaining amount of neural tissue.
In this study, we introduced a parameter termed BMO-MRW that has two logical rationales. First, it takes into account the clinically invisible termination of BM present in most eyes. Second, it measures the rim width perpendicular to the path of the axons as they exit the eye and not along a fixed horizontal plane, which could lead to an overestimation of rim tissue if the path of the axons is more parallel to the plane. Several investigators have previously recognized the need to derive rim measurements perpendicular to the trajectory of axons19–22; however, quantitative analyses supporting the rationale for such an index was not made. To the best of our knowledge, the present study is the first to characterize the properties of BMO-MRW and compare it with the conventional DM-HRW (derived from the clinically identified DM in stereo-photographs colocalized to SD-OCT data) and BMO-HRW.
We showed that although DM area correlates highly with BMO area, it is significantly larger. These findings are in agreement with a recent study by Sharma et al.23; however, we found notable regional variations, particularly in the inferotemporal sector of both patients and controls where the mean position of BMO was external to that of the DM (Fig. 3), contributing to a relatively wider BMO-HRW compared with DM-HRW.
The differences between BMO-MRW and either DM-HRW or BMO-HRW were greater than those between DM-HRW and BMO-HRW. The magnitude of these differences is not surprising, as the minimum distance from BMO to the ILM cannot by definition be larger than the horizontal rim widths. Sector ranks by rim width correlated better with the horizontal indices than with BMO-MRW, indicating a larger discordance in the quantitative and spatial information provided by BMO-MRW compared with either DM-HRW or BMO-HRW. Hence, the locations the clinician currently recognizes as having the widest rim is most likely not where the BMO-MRW is widest and vice versa (Fig. 6). The angular distance between equivalently ranked sectors was notably large for all comparisons; hence, depending on which of the 3 parameters is used, the location of the narrowest rim is frequently in different sectors.
Automated identification of the ILM and BM, including BMO, have been described and are being used in commercial SD-OCT devices.4,13 Our segmentation of these structures was performed manually because to date we are not aware of studies that have systematically verified the automated algorithms. Furthermore, colocalization of the clinically identified DM in disc photographs to the infrared image from SD-OCT could only be performed manually. The manual segmentations are time-consuming and laborious and therefore our study is weakened by a relatively small sample size in spite of including glaucoma patients with a broad range of optic disc appearances and age-matched control subjects. After automated algorithms to segment key structures in the ONH are verified for accuracy, larger sample sizes can be analyzed more readily. It is important that the ONH is scanned with a radial pattern such that BMO-MRW can be calculated along an axis that passes through the BMO center.
Unlike clinical, photographic, or scanning laser tomographic evaluation, BMO-based rim measurement offers a significant advantage in that the DM does not have to be identified. Evidence from experimental glaucoma suggests that BMO remains stable compared with the anterior and posterior scleral canal opening.24 It is also stable compared with the surface height of the clinical DM and peripheral ILM, both used in scanning laser tomography1,2 which presumably decrease with advancing nerve fiber loss. Hence, a plane fitted to the BMO points around the ONH represents a logical reference plane for the derivation of the rim parameters; however, current BMO-based assessments of the rim width and rim area, as proposed with SD-OCT,4,13,14 do not account for the trajectory of axons. Future advances with SD-OCT could include the automated identification and quantification of the BMO-MRW and potentially area calculations based on BMO-MRW values around the ONH.
Our findings have significant practical implications for evaluation of the neuroretinal rim, most notably for the initial assessment of a patient. We have reasoned that it is essential to visualize BMO for an accurate quantification of the rim, necessitating examination with SD-OCT or less optimally with the preceding time domain OCT technology. Methods of rim evaluation that are independent of the DM are likely less important compared with those that can accurately identify BMO. Scanning laser tomography offers analysis techniques that do not require identification of the DM25; however, they are not superior to conventional ones that do require it in discriminating glaucoma patients from healthy controls.26–33 Visualizing BMO may be less critical for the follow-up of a patient for progression compared with the initial assessment, as any progressive changes in the neuroretinal rim are likely to manifest as surface changes of the ILM, which can be detected with conventional stereo disc photography or scanning laser tomography.34–36 Research with SD-OCT on progressive glaucoma may reveal enhanced sensitivity to detect even smaller, and perhaps earlier, changes in the ONH than those possible today, however.22
In summary, findings from our previous7 and the present study indicate that the rationale for the clinically defined outer and inner borders of neuroretinal rim is questionable. The clinically defined DM and conventional horizontal rim measurements regionally underestimate or overestimate the amount of remaining rim tissue. We have described the properties of a parameter, BMO-MRW, which takes into account the highly variable anatomy of the ONH both within and between individuals and quantifies the rim width perpendicular to the trajectory of axons. Research is currently under way to determine whether BMO-MRW assessment improves the discrimination of glaucomatous from healthy eyes and its relationships to retinal nerve fiber layer thickness and visual field sensitivity.
Supplementary Material
Disclosure: A.S.C. Reis, None; N. O'Leary, None; H. Yang, None; G.P. Sharpe, None; M.T. Nicolela, None; C.F. Burgoyne, Heidelberg Engineering (R); B.C. Chauhan, Heidelberg Engineering (R).
Supported by Grants MOP11357 (BCC) and MOP200309 (MTN) from the Canadian Institutes of Health Research, Ottawa, Ontario; Capes Foundation, Ministry of Education of Brazil, Brasilia, Brazil (ASCR); US Public Health Service Grants R01EY011610 (CFB) from the National Eye Institute, National Institutes of Health, Bethesda, Maryland; The Legacy Good Samaritan Foundation (CFB), Portland, Oregon; the Sears Trust for Biomedical Research (CFB), Mexico, Missouri; the Alcon Research Institute (CFB), Fort Worth, Texas; and equipment and unrestricted research support from Heidelberg Engineering (BCC, CFB), Heidelberg, Germany.
References
- 1. Burk RO, Vihanninjoki K, Bartke T, et al. Development of the standard reference plane for the Heidelberg retina tomograph. Graefes Arch Clin Exp Ophthalmol. 2000;238:375–384. [DOI] [PubMed] [Google Scholar]
- 2. Poli A, Strouthidis NG, Ho TA, Garway-Heath DF. Analysis of HRT images: comparison of reference planes. Invest Ophthalmol Vis Sci. 2008;49:3970–3975. [DOI] [PubMed] [Google Scholar]
- 3. Tan JC, Hitchings RA. Reference plane definition and reproducibility in optic nerve head images. Invest Ophthalmol Vis Sci. 2003;44:1132–1137. [DOI] [PubMed] [Google Scholar]
- 4. Hu Z, Abramoff MD, Kwon YH, Lee K, Garvin MK. Automated segmentation of neural canal opening and optic cup in 3D spectral optical coherence tomography volumes of the optic nerve head. Invest Ophthalmol Vis Sci. 2010;51:5708–5717. [DOI] [PMC free article] [PubMed] [Google Scholar]
- 5. Mwanza JC, Oakley JD, Budenz DL, Anderson DR. Ability of cirrus HD-OCT optic nerve head parameters to discriminate normal from glaucomatous eyes. Ophthalmology. 2011;118:241–248.e1. [DOI] [PMC free article] [PubMed] [Google Scholar]
- 6. Allingham RR, Damji KF, Freedman S, Moroi SE, Shafranov G, Shields MB. Shields' Textbook of Glaucoma. Philadelphia: Lippincott Williams and Wilkins; 2005. [Google Scholar]
- 7. Reis ASC, Sharpe GP, Yang H, Nicolela MT, Burgoyne CF, Chauhan BC. Optic disc margin anatomy in glaucoma patients and normal controls with spectral domain optical coherence tomography. Ophthalmology. In press. [DOI] [PMC free article] [PubMed]
- 8. Nicolela MT, Drance SM. Various glaucomatous optic nerve appearances: clinical correlations. Ophthalmology. 1996;103:640–649. [DOI] [PubMed] [Google Scholar]
- 9. Bengtsson B, Olsson J, Heijl A, Rootzen H. A new generation of algorithms for computerized threshold perimetry, SITA. Acta Ophthalmol Scand. 1997;75:368–375. [DOI] [PubMed] [Google Scholar]
- 10. Åsman P, Heijl A. Glaucoma Hemifield Test. Automated visual field evaluation. Arch Ophthalmol. 1992;110:812–819. [DOI] [PubMed] [Google Scholar]
- 11. Strouthidis NG, Yang H, Downs JC, Burgoyne CF. Comparison of clinical and three-dimensional histomorphometric optic disc margin anatomy. Invest Ophthalmol Vis Sci. 2009;50:2165–2174. [DOI] [PMC free article] [PubMed] [Google Scholar]
- 12. Strouthidis NG, Yang H, Fortune B, Downs JC, Burgoyne CF. Detection of optic nerve head neural canal opening within histomorphometric and spectral domain optical coherence tomography data sets. Invest Ophthalmol Vis Sci. 2009;50:214–223. [DOI] [PMC free article] [PubMed] [Google Scholar]
- 13. Abramoff MD, Lee K, Niemeijer M, et al. Automated segmentation of the cup and rim from spectral domain OCT of the optic nerve head. Invest Ophthalmol Vis Sci. 2009;50:5778–5784. [DOI] [PMC free article] [PubMed] [Google Scholar]
- 14. Lee K, Niemeijer M, Garvin MK, Kwon YH, Sonka M, Abramoff MD. Segmentation of the optic disc in 3-D OCT scans of the optic nerve head. IEEE Trans Med Imaging. 2010;29:159–168. [DOI] [PMC free article] [PubMed] [Google Scholar]
- 15. Wojtkowski M, Srinivasan V, Fujimoto JG, et al. Three-dimensional retinal imaging with high-speed ultrahigh-resolution optical coherence tomography. Ophthalmology. 2005;112:1734–1746. [DOI] [PMC free article] [PubMed] [Google Scholar]
- 16. Strouthidis NG, Grimm J, Williams GA, Cull GA, Wilson DJ, Burgoyne CF. A comparison of optic nerve head morphology viewed by spectral domain optical coherence tomography and by serial histology. Invest Ophthalmol Vis Sci. 2010;51:1464–1474. [DOI] [PMC free article] [PubMed] [Google Scholar]
- 17. Schuman JS. Spectral domain optical coherence tomography for glaucoma (an AOS thesis). Trans Am Ophthalmol Soc. 2008;106:426–458. [PMC free article] [PubMed] [Google Scholar]
- 18. Srinivasan VJ, Adler DC, Chen Y, et al. Ultrahigh-speed optical coherence tomography for three-dimensional and en face imaging of the retina and optic nerve head. Invest Ophthalmol Vis Sci. 2008;49:5103–5110. [DOI] [PMC free article] [PubMed] [Google Scholar]
- 19. Chen TC. Spectral domain optical coherence tomography in glaucoma: qualitative and quantitative analysis of the optic nerve head and retinal nerve fiber layer (an AOS thesis). Trans Am Ophthalmol Soc. 2009;107:254–281. [PMC free article] [PubMed] [Google Scholar]
- 20. Mwanza JC, Chang RT, Budenz DL, et al. Reproducibility of peripapillary retinal nerve fiber layer thickness and optic nerve head parameters measured with cirrus HD-OCT in glaucomatous eyes. Invest Ophthalmol Vis Sci. 2010;51:5724–5730. [DOI] [PMC free article] [PubMed] [Google Scholar]
- 21. Povazay B, Hofer B, Hermann B, et al. Minimum distance mapping using three-dimensional optical coherence tomography for glaucoma diagnosis. J Biomed Opt. 2007;12:041204. [DOI] [PubMed] [Google Scholar]
- 22. Strouthidis NG, Fortune B, Yang H, Sigal IA, Burgoyne CF. Longitudinal change detected by spectral domain optical coherence tomography in the optic nerve head and peripapillary retina in experimental glaucoma. Invest Ophthalmol Vis Sci. 2011;52:1206–1219. [DOI] [PMC free article] [PubMed] [Google Scholar]
- 23. Sharma A, Oakley JD, Schiffman JC, Budenz DL, Anderson DR. Comparison of automated analysis of Cirrus HD OCT spectral-domain optical coherence tomography with stereo photographs of the optic disc. Ophthalmology. 2011;118:1348–1357. [DOI] [PMC free article] [PubMed] [Google Scholar]
- 24. Bellezza AJ, Rintalan CJ, Thompson HW, Downs JC, Hart RT, Burgoyne CF. Deformation of the lamina cribrosa and anterior scleral canal wall in early experimental glaucoma. Invest Ophthalmol Vis Sci. 2003;44:623–637. [DOI] [PubMed] [Google Scholar]
- 25. Swindale NV, Stjepanovic G, Chin A, Mikelberg FS. Automated analysis of normal and glaucomatous optic nerve head topography images. Invest Ophthalmol Vis Sci. 2000;41:1730–1742. [PubMed] [Google Scholar]
- 26. Rao HL, Babu GJ, Sekhar GC. Comparison of the diagnostic capability of the Heidelberg Retina Tomographs 2 and 3 for glaucoma in the Indian population. Ophthalmology. 2010;117:275–281. [DOI] [PubMed] [Google Scholar]
- 27. Reddy S, Xing D, Arthur SN, et al. HRT III glaucoma probability score and Moorfields regression across the glaucoma spectrum. J Glaucoma. 2009;18:368–372. [DOI] [PubMed] [Google Scholar]
- 28. Yip LW, Mikelberg FS. A comparison of the glaucoma probability score to earlier heidelberg retina tomograph data analysis tools in classifying normal and glaucoma patients. J Glaucoma. 2008;17:513–516. [DOI] [PubMed] [Google Scholar]
- 29. Oddone F, Centofanti M, Rossetti L, et al. Exploring the Heidelberg Retinal Tomograph 3 diagnostic accuracy across disc sizes and glaucoma stages: a multicenter study. Ophthalmology. 2008;115:1358–1365,1365.e1–3. [DOI] [PubMed] [Google Scholar]
- 30. Ferreras A, Pablo LE, Pajarin AB, Larrosa JM, Polo V, Pueyo V. Diagnostic ability of the Heidelberg Retina Tomograph 3 for glaucoma. Am J Ophthalmol. 2008;145:354–359. [DOI] [PubMed] [Google Scholar]
- 31. De Leon-Ortega JE, Sakata LM, Monheit BE, McGwin G, Jr, Arthur SN, Girkin CA. Comparison of diagnostic accuracy of Heidelberg Retina Tomograph II and Heidelberg Retina Tomograph 3 to discriminate glaucomatous and nonglaucomatous eyes. Am J Ophthalmol. 2007;144:525–532. [DOI] [PMC free article] [PubMed] [Google Scholar]
- 32. Burgansky-Eliash Z, Wollstein G, Bilonick RA, Ishikawa H, Kagemann L, Schuman JS. Glaucoma detection with the Heidelberg retina tomograph 3. Ophthalmology. 2007;114:466–471. [DOI] [PMC free article] [PubMed] [Google Scholar]
- 33. Coops A, Henson DB, Kwartz AJ, Artes PH. Automated analysis of heidelberg retina tomograph optic disc images by glaucoma probability score. Invest Ophthalmol Vis Sci. 2006;47:5348–5355. [DOI] [PubMed] [Google Scholar]
- 34. Vizzeri G, Bowd C, Weinreb RN, et al. Determinants of agreement between the confocal scanning laser tomograph and standardized assessment of glaucomatous progression. Ophthalmology. 2010;117:1953–1959. [DOI] [PMC free article] [PubMed] [Google Scholar]
- 35. O'Leary N, Crabb DP, Mansberger SL, et al. Glaucomatous progression in series of stereoscopic photographs and Heidelberg retina tomograph images. Arch Ophthalmol. 2010;128:560–568. [DOI] [PMC free article] [PubMed] [Google Scholar]
- 36. Chauhan BC, Hutchison DM, Artes PH, et al. Optic disc progression in glaucoma: comparison of confocal scanning laser tomography to optic disc photographs in a prospective study. Invest Ophthalmol Vis Sci. 2009;50:1682–1691. [DOI] [PubMed] [Google Scholar]
Associated Data
This section collects any data citations, data availability statements, or supplementary materials included in this article.


