Abstract
Simultaneous, hybrid MR-PET is expected to improve PET image resolution in the plane perpendicular to the static magnetic field of the scanner. Previous papers have reported this either by simulation or experiment with simple sources and detector arrangements. Here, we extend those studies using a realistic brain phantom in a recently installed MR-PET system comprising a 9.4 T MRI-scanner and an APD-based BrainPET insert in the magnet bore. Point and line sources and a 3D brain phantom were filled with 18F (low-energy positron emitter), 68Ga (medium energy positron emitter) or 120I, a non-standard positron emitter (high positron energies of up to 4.6 MeV). Using the BrainPET insert, emission scans of the phantoms were recorded at different positions inside and outside the magnet bore such that the magnetic field was 0 T, 3 T, 7 T or 9.4 T. Brain phantom images, with the ‘grey matter’ compartment filled with 18F, showed no obvious resolution improvement with increasing field. This is confirmed by practically unchanged transaxial FWHM and ‘grey/white matter’ ratio values between at 0T and 9.4T. Field-dependent improvements in the resolution and contrast of transaxial PET images were clearly evident when the brain phantom was filled with 68Ga or 120I. The grey/white matter ratio increased by 7.3% and 16.3%, respectively. The greater reduction of the FWTM compared to FWHM in 68Ga or 120I line-spread images was in agreement with the improved contrast of 68Ga or 120I images. Notwithstanding elongations seen in the z-direction of 68Ga or 120I point source images acquired in foam, brain phantom images show no comparable extension. Our experimental study confirms that integrated MR-PET delivers improved PET image resolution and contrast for medium- and high-energy positron emitters even though the positron range is reduced only in directions perpendicular to the magnetic field.
Introduction
The development of hybrid MR-PET scanners has recently gained momentum following the announcement of prototype devices by the major manufacturers of clinical imaging equipment. Two major routes have been pursued thus far: the so-called “true hybrids” and the “tandem” machines [1], [2]. As implied by the name, the tandem machines are two separate scanners, with one placed behind the other, and a shared table. The MR and PET measurements are performed consecutively. The development of true hybrids, on the other hand, has taken the much more difficult route of integrating the PET machine inside the bore of the MR magnet, necessitating a major redesign of the PET components [3]–[5]. Although this engineering challenge might be viewed as a disadvantage, it does offer new possibilities in that spatial and temporal coherence is guaranteed. The MR and PET measurements can be performed simultaneously depending on the required study protocol [6]–[8]. In such an instrument, there is another, incidental, advantage; the range of the emitted positron is somewhat more circumscribed because of the presence of a large static magnetic field, as originally proposed by Iida et al [9]. The circumscribed range should yield improved PET image quality in the directions perpendicular to the main magnetic field of the MR magnet. It has also been expected from Monte Carlo simulations that the more important impact of applying a magnetic field is the improvement of image contrast attributed to the confinement of the spreading positrons [9], [10].
The influence of a magnetic field on positron emitters and the anticipated improvement of PET image resolution and image contrast in hybrid, integrated MR-PET scanners due to the confined positron trajectory has been studied in a number of papers since 1986 [9]–[15]. Those studies investigated reduction in positron range using simulations and/or simple experiments. Following the significance gained by PET/CT in oncological imaging, MR-PET is attracting more and more interest as a new bimodal imaging modality driven by the fact that MRI has a better soft tissue contrast than CT and does not use additional ionising radiation. If MRI and PET data can be recorded simultaneously in an integrated, fully-hybrid scanner, MR-PET offers many perspectives for multi-parametric imaging beyond the common combination of functional PET and anatomical MRI [16]–[18]. Moreover, given the different acquisition times for each modality, a number of MRI scans, with different contrasts, sensitivities and anatomical and functional properties, can be acquired during the data acquisition for a PET scan [19]. Importantly, acquisition of the MR and PET datasets is concurrent.
For small animal research, different solutions for combining MRI and PET have been realised [20]. Considering the potentially high PET resolution of these scanners and the concomitant tiny structures in small animals to be investigated, the positron range of tracers such as 68Ga, 15O, 124I, which have higher positron energies than the standard PET-nuclides 11C and 18F, cannot be neglected as a factor that has a detrimental effect on PET image resolution [21]. Some small-animal MR-PET scanners use high magnetic field strengths (∼7 T) [3], [4] and thus in such scanners a reduction of the positron range can be expected, and consequential improvement of PET image contrast and resolution.
In the last few years, the first true hybrid MR-PET prototype scanners for human brain imaging at 3 T have been developed by Siemens (Siemens AG, Healthcare Sector, Erlangen, Germany) and have been installed in a limited number of centres worldwide [6]–[8], [22]. More recently, a similar type of true hybrid MR-PET for whole-body studies, called the mMR, from the same company became commercially available and has since been installed in a number of centres [1]. Both types of hybrid MR-PET, the 3T MR-BrainPET and the mMR, integrate newly-developed magneto-insensitive PET detectors [5] into Siemens MRI scanners, the 3T MAGNETOM Tim-Trio MR and the 3T Verio MR, respectively. Although the magnetic field of these hybrid scanners is ‘just’ 3 T, it is of enormous interest whether this field leads to an appreciable improvement in the spatial resolution of PET images, especially if medium- or high-energy positron emitters such as 68Ga, 15O or 82Rb are used [13], [23], [24].
In our institute, two identical BrainPET inserts are currently in operation; one in a 3 T MRI scanner and a second in an ultra-high field 9.4 T whole-body MR scanner for humans, currently being constructed jointly with Siemens. Given the above instrumentation, there exists a unique opportunity for us to investigate experimentally the actual improvement in the spatial resolution of PET images as a function of static magnetic field strength. The experimental results, obtained from fully-functional BrainPET scanners operating in magnetic fields, enable comparison with simulation results and/or experimental results obtained from simpler detector units that have been presented previously in the literature.
The results reported herein are from experiments carried out with different phantoms and different positron emitters in a 9.4 T MR-BrainPET. Previous experiments reported by other investigators only made use of point sources [11], [13]. Primarily, they looked at changed positron range in the plane in which the Lorenz force acts on the charged particles, i.e. perpendicular to the direction of the magnetic field. PET images are, however, acquired in three dimensions. In the experimental setup employed here, in addition to point sources and line sources placed in materials of different density, a realistic brain phantom was also used. Under these experimental conditions, it becomes possible to comprehensively explore the issues relevant for determining the extent of improvement of spatial resolution in PET images in future in vivo MR-PET applications.
The present study is intended to evaluate quantitatively the effects of an external magnetic field on PET images acquired using a newly-developed PET insert for MRI scanners. In particular, the improvements in spatial resolution and contrast of the PET images were assessed.
Materials and Methods
The MR component of the 9.4 T MR-BrainPET is a whole-body MR scanner developed in collaboration by Siemens Healthcare (Erlangen, Germany) and the Forschungszentrum Jülich. The magnet has a warm bore of 90 cm and the inner bore of the gradient coil is 60 cm, into which the BrainPET can be inserted. The superconducting 9.4 T magnet is passively shielded with 870 tons of iron. Although detailed previously in several publications [6], [8], [25], for the sake of clarity some of the technical specifications of the BrainPET are described below. The BrainPET consists of 32 cassettes forming a ring with an inner diameter of 36 cm, which matches the outer diameter of the MR head radiofrequency (RF) coils. Each cassette has 6 detector blocks inline whereby each block consists of 12×12 LSO crystals of size 2.5×2.5×20 mm3. Light emissions from these crystals are recorded by an array of 3×3 avalanche photodiodes (APDs). The PET volume-of-interest (VOI) covers 19.2 cm in the axial direction. Each detector cassette is RF-shielded separately in such a way that it is transparent for the low frequency switched magnetic fields used for imaging in the MR scanner. Six-millimetre wide gaps exist between the cassettes and 2.5 mm gaps exist between the detector blocks. The feasibility of simultaneous MR-PET measurements with an almost identical BrainPET insert in the 3T field of a Siemens MAGENETOM Trio has been demonstrated in earlier works [6]–[8], [19].
Glass capillaries with an inner diameter of 1 mm and an outer diameter of 6 mm were placed in a cylinder of 20 cm length and 20 cm diameter filled with water. The cylinder was positioned within the BrainPET such that the line source was located in and along the central axis of the scanner. Images from a point source of 1 mm3 placed in the centre of the BrainPET were measured with the source positioned in the middle of a 10×10×10 cm3 block of polyethylene foam with a density of 0.1 g/cm3. Given the positrons emitted from the nuclei employed in this study, this density, which is about a third of the density of lung tissue [26], was selected in order to have an expanded positron range, but also to stop the positrons within the realistically-sized phantom. As shown in Fig. 1, the block of polyethylene foam consists of two halves shaped such that a disk-shaped protrusion on the inner surface of one half fits into a disk-shaped recess on the other.
Figure 1. Point source phantom.
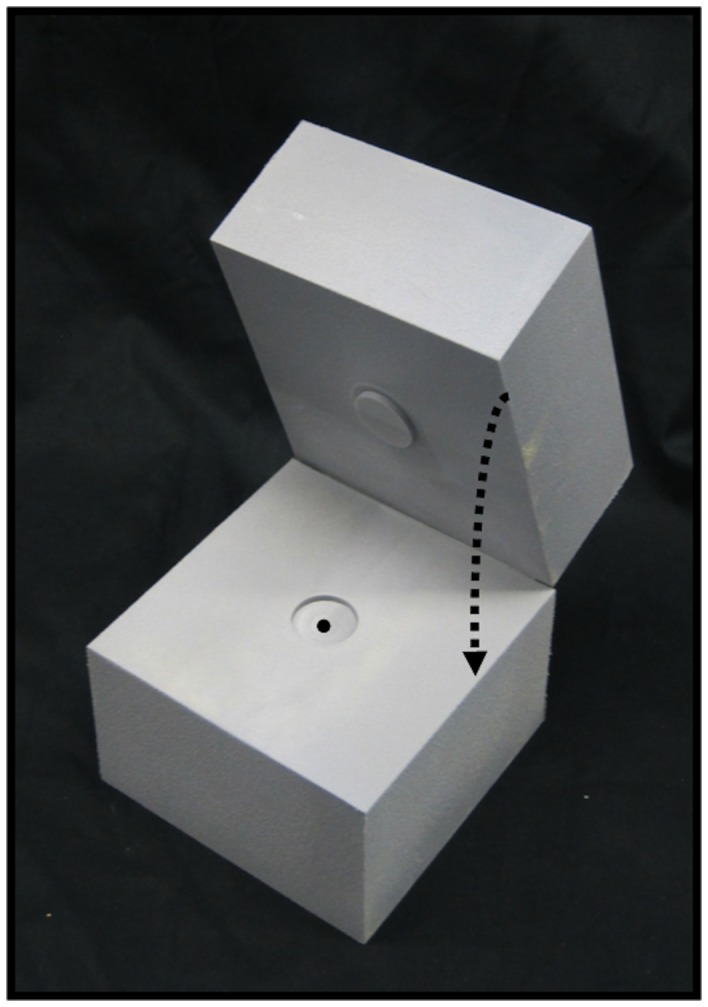
The block of polyethylene foam consists of two halves whereby on the inner surface of one half, a disk-shaped protrusion fits into a disk-shaped recess on the other. A radioactive drop is placed right in the centre of the cubic block of polyethylene foam with a density of 0.1 g/cm3.
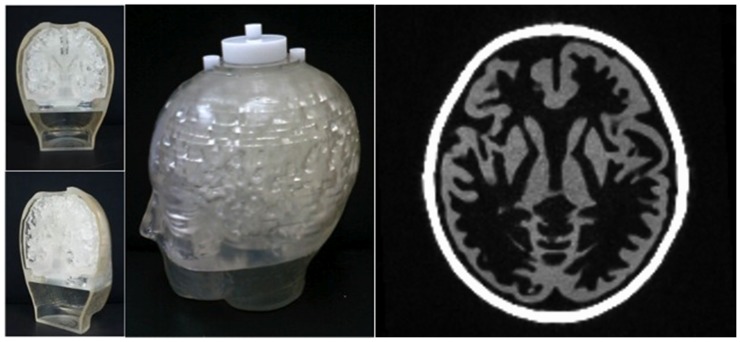
In order to mimic the human brain, a phantom (subsequently referred to as the “Iida brain phantom”) was employed; the brain phantom (Fig. 2) was constructed from a photo-curable polymer with a density of 1.07 g/mL by using a laser-technique modelling the head shape of a young healthy Japanese volunteer [27]. The Iida brain phantom has two fillable compartments: the outer one, which is to be filled with K2HPO4 diluted in water (100 g K2HPO4 and 100 g water), simulates the skull, whereas the inner compartment has the structure of the cortex (grey matter = GM) and can be filled with radioactivity diluted in water. The interior space is solid, i.e. there is no fillable white matter compartment such as in a Hoffman 3D brain phantom [28]. This compartment was used as a reference in the numerical analysis and is denoted in the following as “white matter” (WM). The brain phantom was positioned in the field-of-view (FOV) of the BrainPET such that its centre coincided with the centre of the FOV. The caudal-cranial direction of the BrainPET was parallel to the z-axis of the scanner.
Figure 2. Left: Photographs of the Iida brain phantom used in this study.
On the left, the sections show the elaborate internal structure of the phantom with the putative ‘grey/white matter’ compartments. Right: Transaxial MPRAGE image of the brain phantom with the same slice position as shown in Fig. 7.
In separate experiments, the phantoms were filled with 3 different positron emitters, the low-energy positron emitter 18F, the medium-energy positron emitter 68Ga and the high-energy positron emitter 120I [29], [30]. 120I was chosen because of its high maximum positron energy of and ranges in water of these radionuclides are listed in Table 1. The amount of radioactivity filled into the line source and the point source phantom ranged from 1 to 5 MBq. As indicated above, only the grey matter compartment of the Iida brain phantom was filled with radioactivity; about 30 MBq of each of the different positron emitters was used.
Table 1. Literature values of the positron energy in water of 18F (14), 68Ga (14), and 120I (31) and of the positron range (expressed in terms of FWHM and FWTM) in water of 18F (14), 68Ga (14), and 120I (35).
| Isotope | Energy | β+ - Range in Water | ||
| mean | max | FWHM | FWTM | |
| (keV) | (keV) | (mm) | (mm) | |
| 18F | 248 | 635 | 0.1 | 1 |
| 68Ga | 829 | 1899 | 0.5 | 4 |
| 120I | 1845 | 4613 | 4.4 | 14.6 |
In Ref. 35 the positron range of 120I is reported as the resulting image resolution, if 120I is applied in an imaging system with an intrinsic spatial resolution of 1.5 mm FWHM.
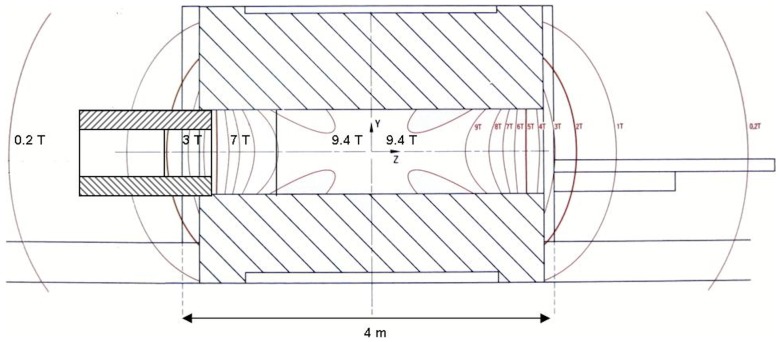
In order to examine the influence of different magnetic field strengths, the BrainPET was placed outside the bore of the magnet of the MR scanner and at three positions in the MR scanner. At about 3.5 m behind the scanner, but importantly, outside the 870-ton iron shield the magnetic field is approximately 0 T, that is, 0.022 T to be precise. At the entrance of the bore of the 9.4 T magnet the field is about 3 T (see Fig. 3). Similarly, another point corresponding to 7 T was found and, finally, at the isocentre of the magnet the field has the designed value of 9.4 T. The strength of the magnetic field at the different positions was measured with a Gauss meter. Since no MR acquisitions were performed, there was no need to locate the head RF coil inside the BrainPET insert.
Figure 3. Schematic representation of the magnet and the positions of the PET insert.
All acquisitions were performed in listmode and framed into sinogram data comprising the total acquisition time prior to reconstruction. In order to take account of radioactive decay, the duration of the individual measurements carried out varied between 600 s and 1000 s.
Point and line spread images were reconstructed using the 3D filtered back-projection algorithm available in the STIR library [32]. Here, a ramp filter (cut-off = 0.5 cycles/pixel), a zoom factor of 2 and an xyz-voxel size of 0.625×0.625×1.25 mm3 were selected. Because the point source images showed extensions in x- and z-direction when using 68Ga and 120I (as detailed below), only the line-spread images were used for the numerical analysis of image resolution in the transaxial (x-y) plane. Vertical and horizontal profiles crossing the lines were extracted from three transaxial images positioned in the middle of the line source and at z-intervals of +/−50 mm. In this way, 6 profiles were evaluated for each radionuclide. The profiles were fitted by Gaussian functions from which the FWHM, as the parameter of image resolution, was obtained. The full width at tenth maximum (FWTM) was obtained directly from the measured profiles using linear interpolation.
Data from the Iida brain phantom were reconstructed using the manufacturer-supplied 3DOSEM algorithm [33] (2 subsets, 32 iterations) taking into account normalization and correction for randoms and attenuation. The resulting image volume had 256×256×153 voxels of 1.25 mm3. With 120I, as with most other non-standard positron emitters, false coincidences, the so-called gamma-coincidences, occur which cause a flat background so that the conventional scatter correction available in Siemens PET devices does not work properly [34]. Therefore, only the18F and 68Ga, but not the120I images were corrected for scatter.
All reconstructed images were smoothed with a 3D Gaussian filter of 3 mm FWHM. Using the Fusion-tool of PMOD (PMOD Technologies Ltd, Switzerland), the images of the brain phantom filled with 68Ga and 120I were registered to the 18F-images. Regions-of-interest (ROIs) were defined on MPRAGE images of the Iida phantom, which had been registered to the PET images. On five transaxial images, each of 1 cm (8 image planes) separation, ROIs delineating GM and WM were defined by using an isocontour level of 50% of the maximum image intensity. In this way a grey/white (GM/WM) ratio for each image was obtained so that the mean and standard deviation of the GM/WM ratios could be calculated.
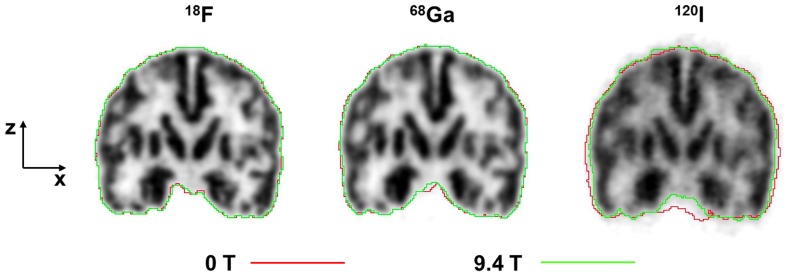
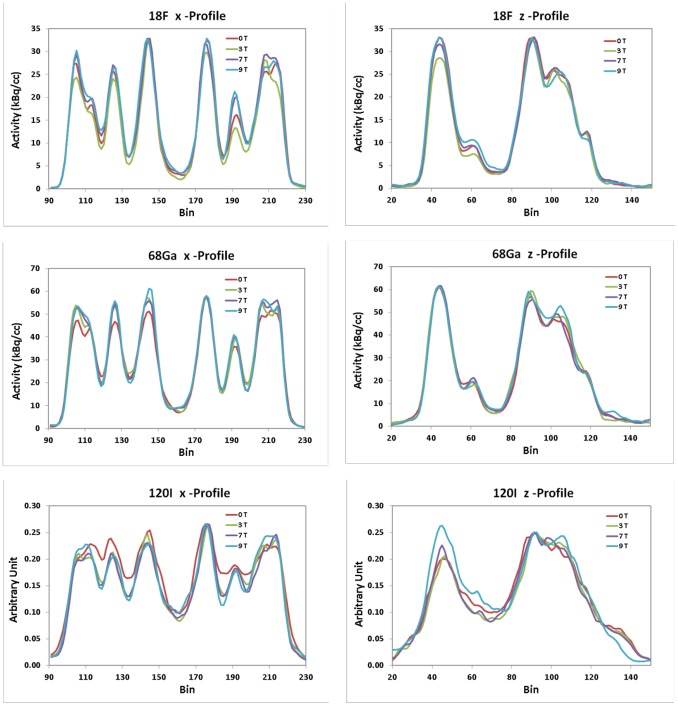
Since the magnetic field with its orientation along the z-axis reduces the positron range in the x- and y-direction, but not in the z-direction, it is interesting to look at coronal (x-z-plane) or sagittal (z-y- plane) slices to verify this effect. First, coronal images were examined. Contours around the outer border of the images measured at 0 T and 9.4 T were defined to demonstrate the different changes of image resolution in the x and z direction. In the case of 18F and 68Ga, the contours were defined at a 20% isocontour level of the image maximum, whereas due to the higher background for 120I, a level of 23% had to be applied to obtain contours similar to those of 18F and 68Ga. Second, in the images of the three radionuclides at 0 T, 3 T, 7 T and 9.4 T, profiles crossing the basal ganglia were defined in the x- and z-directions. Each set of the four profiles was normalized to a common maximum.
Results
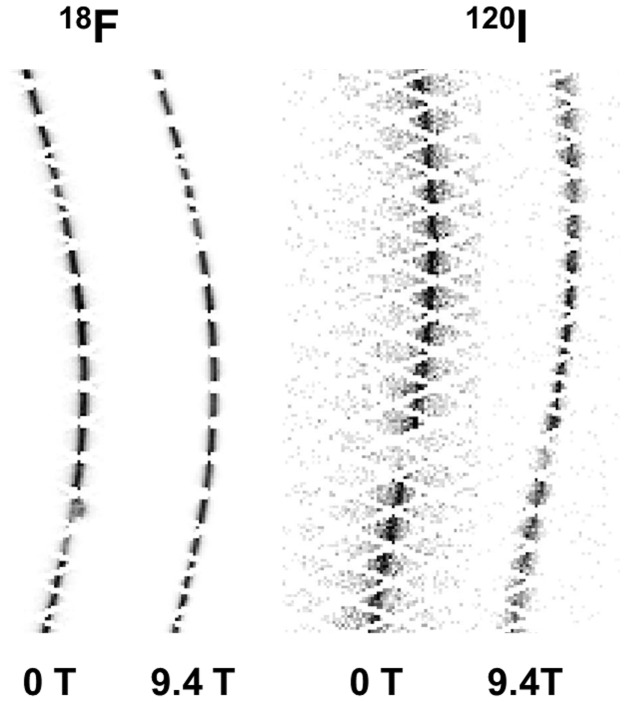
Figure 4 demonstrates the effects of the magnetic field on sinograms of positron emitters with low- and high-positron energy. Whereas no significant difference was observed in the case of 18F, there was a clearly discernable effect with a decreased range in the horizontal (radial) direction of the sinogram when the 120I-filled point source was immersed in a 9.4 T magnetic field as compared to 0 T.
Figure 4. Sinograms of the point source filled with 18F or 120I and measured at 0 T and 9.4 T.
The gap in the sinograms of the 120I test were caused by a block failure.
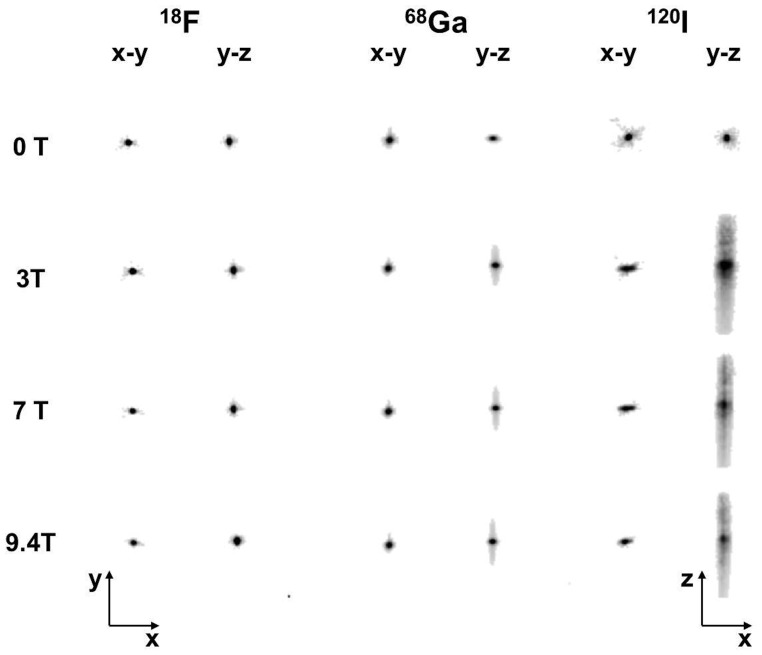
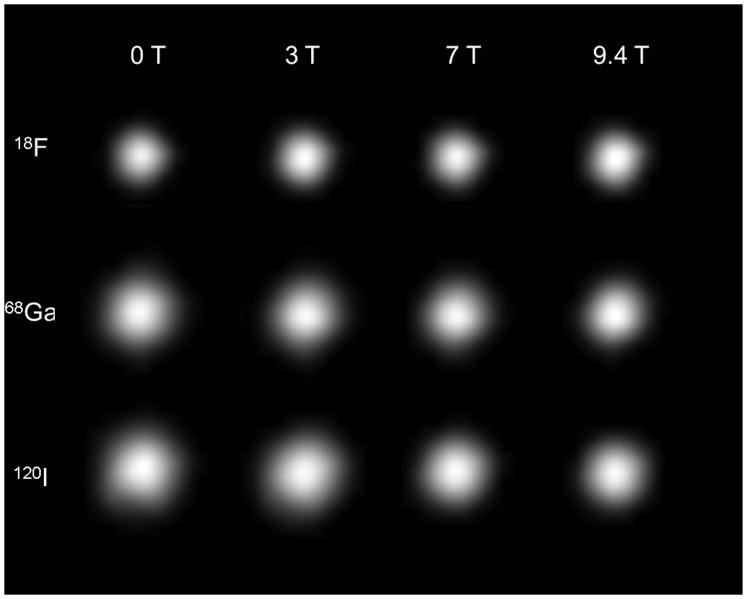
Images of the point source located within the polyethylene foam block are shown in Fig. 5. For 18F and 68Ga, the point images in the x-y plane appear slightly smaller from 0 T to 9.4 T. When the point source contained 68Ga or 120I, their images showed tails in the x- and z- directions when measured inside the magnetic field. The tails were more pronounced for 120I than for 68Ga. The tails in z-direction remained unchanged for ≥3 T with a z-FWHM of 4.36±0.04 and 9.86±1.65 for 68Ga or 120I, respectively. The tails can be explained by the thin gap between the halves of the block at its centre, which is parallel to the x-z-plane (Fig. 1). In this plane medium- and high-energy positrons can spread out in contrast to the vertical (y) direction where they have to interact with the foam. To validate this effect we performed a test in the 3T MR-BrainPET with 68Ga and the foam block tilted by 45 degrees around the z-axis. In this case the tails were also tilted by 45 degrees. The spread of the positron distribution is not visible for 68Ga or 120I, but becomes a clear straight-line distribution along the z axis at >3T, as a result of confinement of positron trajectory in the x-y plane.
Figure 5. Images of the point source filled with 18F, 68Ga or 120I measured at the four different magnetic field strengths.
Figure 6 compares the transaxial images of the line source filled with the three different radionuclides and measured at the four different field strengths. These images demonstrate a decrease of image resolution from low- to high-positron energy. An improvement of the (transaxial) image resolution with increasing magnetic field strength can be observed for 68Ga and 120I, but not for 18F. The numerical results of the line source study are shown in Table 2. Whereas both FWHM and FWTM indicated no effect of the magnetic field for 18F, these measures became smaller from 0 T to 9.4 T for 68Ga and 120I. In agreement with the general cusp-like shape of the distribution of the positron ranges, the numbers of the FWTM show a larger effect with the increasing magnetic field than the FWHM. From 0 T to 3 T the FWHM changed by 0.3%, −3.1% and 1.8% for 18F, 68Ga and 120I, respectively. The corresponding results of the FTWM are −1.6%, −6.1% and −6.7%. Comparing the measurements of 18F, 68Ga and 120I at 0 T and 9.4 T the FWHM was changed by −0.7%, −13.l6% and −14.6%, whereas the FWTM changed by 1.0%, −17.1% and −22.7%.
Figure 6. Transaxial PET-images of the glass capillary placed in water, filled with 18F, 68Ga or 120I, and measured at the four different magnetic field strengths.
Table 2. Resolution findings expressed as FWHM and FWTM for the three positron emitters studied at 0 T, 3 T, 7 T, and 9.4 T.
| Magnetic Field (T) | FWHM (mm) | FWTM (mm) | |
| 18F | 0 | 2.87±0.09 | 6.30±0.49 |
| 3 | 2.87±0.09 | 6.20±0.47 | |
| 7 | 2.88±0.10 | 6.29±0.42 | |
| 9.4 | 2.85±0.08 | 6.36±0.43 | |
| 68Ga | 0 | 3.50±0.07 | 7.46±0.79 |
| 3 | 3.39±0.07 | 7.01±0.60 | |
| 7 | 3.22±0.05 | 6.68±0.61 | |
| 9.4 | 3.02±0.05 | 6.19±0.53 | |
| 120I | 0 | 3.86±0.08 | 8.62±0.56 |
| 3 | 3.93±0.13 | 8.04±0.53 | |
| 7 | 3.60±0.14 | 7.17±0.46 | |
| 9.4 | 3.30±0.06 | 6.66±0.41 |
The data (mean ± standard deviation, n = 6) were calculated from horizontal and vertical profiles crossing the lines sources at three different z-positions.
When the Iida brain phantom was filled with 18F, there was no visible influence from the magnetic field (Fig. 7). Correspondingly, no improvement of the GM/WM ratio was found when the phantom was scanned in the magnetic field (Table 3).
Figure 7. Transaxial, coronal and sagittal PET-images of the Iida brain phantom filled with either of three positron emitters and each measured at 0 T, 3 T, 7 T and 9.4 T.
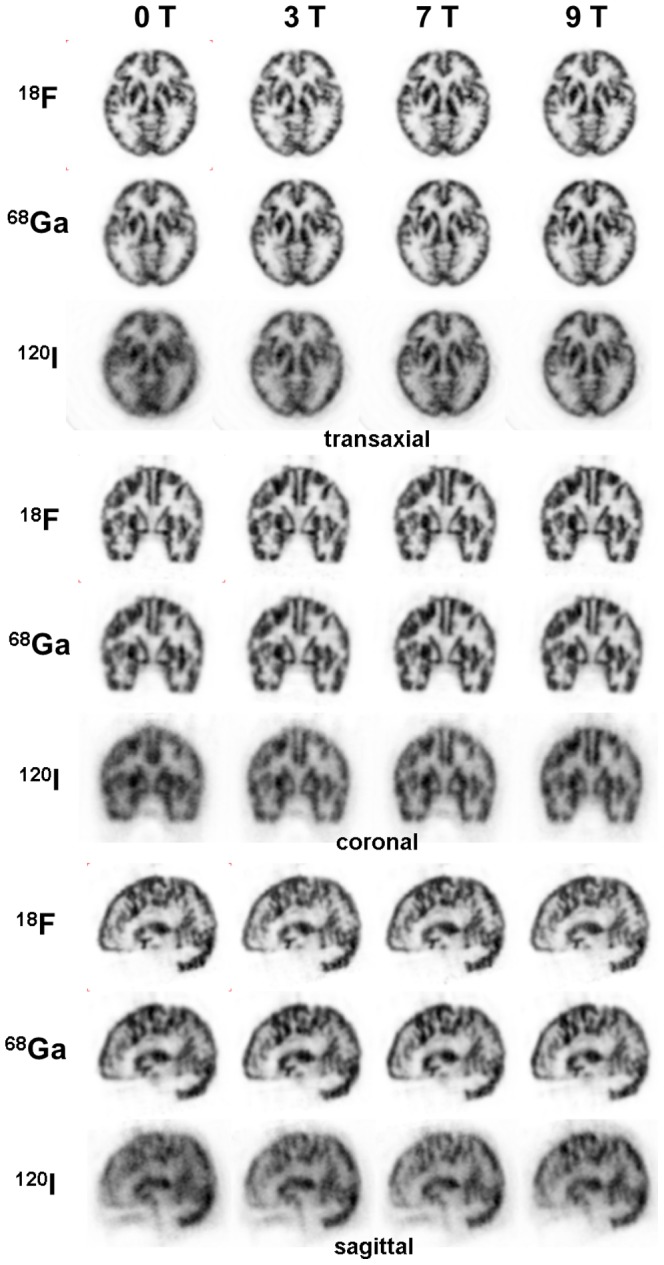
The original reconstructed images are filtered with a 3D Gaussian filter of 3mm FWHM. Each image is scaled to its own maximum. The 18F- and 68Ga-images are scatter-corrected.
Table 3. Ratios of the reconstructed counts measured in the ‘grey matter’ (GM) and the ‘white matter’ (WM”) compartments of Iida brain phantom filled with 18F, 68Ga, and 120I, respectively.
| Magnetic Field (T) | GM/"WM" | |
| 18F | 0 | 2.71±0.04 |
| 3 | 2.69±0.05 | |
| 7 | 2.70±0.04 | |
| 9.4 | 2.70±0.05 | |
| 68Ga | 0 | 2.32±0.04 |
| 3 | 2.46±0.05 | |
| 7 | 2.49±0.04 | |
| 9.4 | 2.49±0.05 | |
| 120I | 0 | 1.44±0.02 |
| 3 | 1.59±0.04 | |
| 7 | 1.67±0.04 | |
| 9.4 | 1.68±0.02 |
The data (mean ± standard deviation) were calculated from GM/WM ratios measured in five transaxial images with z-intervals of 1 cm.
When the brain phantom was filled with 68Ga or 120I, the influence of the magnetic field became obvious (Fig. 7). A noticeable effect can already be seen at 3 T with an increase of the GM/WM ratio by 6.0% for 68Ga and by 10.3% for 120I (Table 3). Especially for the high-energy positron emitter 120I, the image resolution improves further at 7 T and 9.4 T. For 9.4 T the relative increase of the GM/WM ratio was 7.3% for 68Ga and 16.3% for 120I.
Since the magnetic field with its orientation along the z-axis reduces the positron range in the transversal (x-y) plane, images of the Iida brain phantom viewed in the coronal (x-z) or sagittal (z-y) plane are expected to show an improved resolution just in the x- or y-direction. This statement was experimentally confirmed by the results presented in Fig. 8 and 9.
Figure 8. Coronal PET-images of the Iida brain phantom filled with 18F, 68Ga or 120I and measured at 9.4 T.
The green contour was defined on these images, whereas the red contour was defined on the corresponding images obtained at 0 T.
Figure 9. Profiles crossing the ‘basal ganglia’ in the x- and z-direction, i.e. perpendicular and along the magnetic field, respectively, were defined in images of the Iida brain phantom.
The unit of the 120I data is arbitrary since these data are not scatter-corrected and not calibrated.
Looking at coronal images of the Iida brain phantom filled with 18F, 68Ga or 120I there is no difference between the red contour, which represents the cortical outline at 0 T, and the green contour, which represents the cortical outline at 9.4 T (Fig. 8). Upon closer examination of the corresponding outlines in the case of the medium- and high-energy positron emitter, the red contour is outside the green contour in the horizontal direction of the image, which is oriented perpendicular to the magnetic field. For 120I this difference is greater. In the z-direction, the red and green outlines coincide for 68Ga and 120I. For 120I even a slight extension in z-direction becomes visible.
The peak-to-trough differences of the profiles through images of the Iida brain phantom are another indicator of changes in resolution and contrast when the phantom is measured at the different magnetic field strengths (Fig. 9). Profiles crossing the Iida brain phantom filled with 18F show no consistent differences between the different field strengths. This is in agreement with the practically unchanged GM/WM ratios for 18F (Table 3). In case of 68Ga, the x-profile at 0 T has a smaller peak-to-trough difference at 0 T compared to the other field strengths, whereas the z-profiles do not markedly differ. In the case of 120I, the x-profile shows a significantly smaller peak-to-trough difference at 0 T compared to 3 T, 7 T and 9.4 T; there was no consistent differences between the non-zero field strengths. For 68Ga and 120I the greatest peak-to-trough difference were found at 9.4 T.
Discussion
This work presents experimental studies on the effects of the magnetic field, found in conventional high and ultra-high field MRI, on the positron range of different emitters. Using low-, medium- and high-energy positron emitters embedded in point and line sources as well as in a realistic brain phantom, a comprehensive overview of the MR-related influences on the positron range was obtained.
Visible inspection of the images obtained with the low-energy positron emitter, 18F, showed no magnetic field induced improvement in image resolution. This is in agreement with the numerical evaluation of the line source test, where no trend for an improved resolution from 0 T to 9.4 T was found in the case of 18F. The corresponding change of the GM/WM ratio measured in the Iida brain phantom was only 2%. These findings are in agreement with the very small change of FWHM from 3.85 mm at 0 T to 3.78 mm at 10 T reported by Raylman et al. [12] for detector crystals sized 5×5 mm2.
When line sources filled with 68Ga and 120I were measured, the image resolution improved with increasing magnetic field as seen in Fig. 6: this is supported by the numerical results in Table 2. Correspondingly, in the case of the Iida brain phantom, a better image resolution and contrast was observed already at 3 T, which improved further at 7 T and 9.4 T (Fig. 7). When comparing the findings of FWHM and FWTM in Table 2 with the GM/WM ratios reported in Table 3, one can conclude that the image improvement is more related to the smaller FWTM than to the smaller FWHM. Especially at 3 T and 7 T, the relative increases of GM/WM correspond better to the relative decreases of FWTM than of FWHM. As shown by Fig. 7, the images do not change significantly between 7 T and the 9.4 T. This agrees with the practically unchanged GM/WM ratio at 7 T and 9.4 T with values of 2.49±0.04 and 2.49±0.05 for 68Ga, and of 1.67±0.04 and 1.68±0.02 for 120I.
Images of the Iida brain phantom filled with 68Ga were slightly blurred compared to the 18F images when measured at 0 T, which improved at higher field strengths. Since the positron energy of 68Ga is similar to that of 15O, which is not so appropriate for the tests reported here due to its short half-life of just 2 min, our results indicate the improvement which can be expected in studies such as those described by the Tuebingen group which were performed with a small animal 7 T MR-PET system (personal communication). Especially in small animal MR-PET with an intrinsic PET-resolution of 1–2 mm, 15O studies will benefit from the influence of a strong magnetic field.
Images of the Iida brain phantom filled with 120I and measured at 0 T demonstrated a poor spatial resolution and contrast that would not be of much use in practical terms. Here, the advantage of the presence of a magnetic field during the PET acquisition became obvious. Even at 3 T the images demonstrated a marked improvement in resolution and contrast over those at 0 T. Further qualitative improvements were observed at 7 T and 9.4 T. These finding are supported by the ‘GM/WM’ ratios presented in Table 3. On the other hand, when examining the 120I images one must be aware that this positron emitter has a positron abundance of 56% and that 120I images have a flat background caused by the so-called gamma-coincidences [31]. If this background is corrected by an appropriate method such as described earlier [34], the quality of 120I images will improve outside and inside the MR environment – with the best overall image quality at 9.4T. With its half-life of 81 min and β+ abundance of 56%, 120I may be regarded as a short-lived substitute for the SPECT radioisotope 123I. In small animal PET data acquired simultaneously with high-field MR, it may be an interesting radiolabel for many radiotracers commonly applied in SPECT and radiolabelled with 123I. Even though the practical importance of 120I may be small, the results reported here can be regarded as representative for other high-energy positron emitter such as 82Rb (maximum positron energy 3.2 MeV) or 76Br (maximum positron energy 3.4 MeV).
The positron range of 120I has been considered only in one previous paper [35], whereas 82Rb is often examined in the literature as a typical high-energy positron emitter [12], [13], [15], [24], [36], [37]. 82Rb is typically used to examine myocardial flow. In this case the image resolution is not only affected by a long positron range, but also by the beating heart. Therefore, the expected increase of PET image resolution in a high-field MRI scanner should be complemented by an acquisition protocol that takes into account heart motion and rhythm by appropriate triggering.
The problem of motion in the case of a heart study alluded to above is a general cause of image blurring and becomes more relevant with increasing image resolution. In the context of the present study one must take account of patient motion by appropriate restriction or correction. Otherwise, the improvement of image resolution within the magnetic field remains ineffective.
The radiotracer distribution in the grey matter compartment of the Iida brain is similar to the uptake pattern observed in FDG or 15O-water studies. In spite of this, the images shown in our study do not mirror the complete situation in a clinical PET-MR study. In such a study there would be radiotracer uptake also in the white matter so that the GM/WM ratio would be dependent also on this uptake and not only on the reduced positron range like in our findings. Furthermore, in our study no head RF coils were present during the scan. In a real PET-MR study, the quality of the PET images may additionally be influenced by attenuation and scatter introduced by the head RF coils.
The Lorenz force induced by the magnetic field of the MRI scanner acts only in the plane perpendicular to the z-axis of the scanner. Therefore, one might naively expect no effect on the z-coordinate of images oriented along the z-axis. As reported in the literature [12], [15] and confirmed by our results shown in Fig. 5, point source images of the medium- and high- energy positron emitters exhibited tails in the z-direction when measured in the magnetic field. Positrons which leave the point source at angles oblique to the transaxial plane are deflected by the Lorenz force towards the z-axis so that their annihilation points are shifted towards the z-axis and become “visible” by the tails. The observation of the tails leads to the expectation that the MR field causes an elongation in z-direction together with a contraction in the transaxial plane in coronal or sagittal images of phantoms such as the Iida brain phantom. Figure 8 however, shows a slight elongation in z-direction in the 120I test only, but not for 68Ga. The z-profiles shown in Fig. 9 for 68Ga and 120I support this observation.
The restriction of the positron range in the plane perpendicular to the z-axis of the scanner is expected to turn a somewhat poorer isotropic image resolution, which is at least found at the centre of the field-of-view, into an anisotropic one. Consequently, the partial volume effect in the x-y plane should be less than in the x-z and y-z planes. This might influence image analysis, for example, if the patient’s head is differently tilted in two consecutive scans so that planes affected by the restriction of the positron range do not have the same orientation. However, when looking at Figure 7, which presents the images of the irregularly shaped brain phantom, it is very difficult to realise that the restricted positron range leads to an improvement in resolution and contrast of the image of cortical structures only in x- and y-direction. PET images do not comprise an ideal plane, but always a slice containing three-dimensional voxels. The value of an image voxel is influenced by all three dimensions; two of them are affected by the magnetic field and one not. The same pertains to volumes of interest with many voxels, which are commonly applied in data analysis. Thus, effects of image resolution and related partial effects differing for x, y, and z are mixed when averaging the voxels of a VOI.
Conclusions
The use of an integrated, hybrid MR-PET scanner enables the exploitation of advantages accruing from the investigation of different processes and functions observable either by MRI or by PET simultaneously such that complementary results can be obtained. Additionally, the MR field helps to improve the resolution and contrast of PET images if the applied radiotracer is labelled with a medium- or high-energy positron emitter. Although the best improvement was found with an ultra-high field MRI system, our data show an improvement already at 3 T, the field strength of the first commercial integrated MR-PET scanner for human studies. Whilst no commercial integrated human MR-PET scanner with a high-field MR magnet (>3 T) is available, an integrated small animal MR-PET operating at a field of 7 T has been developed and commercial devices are expected in the near future. PET imaging in such systems where resolution might be even more crucial would benefit from the co-existing MR field.
Acknowledgments
The authors thank S. Spellerberg for the production of 120I and R.J. Ehlers PhD and M. Herzog for their support when measuring the magnetic field strength.
Funding Statement
Funding from the Bundesministerium für Bildung and Forschung (Grant No.: 13N9121) and generous support from Siemens Healthcare for construction of the 9.4 T MR–PET scanner are gratefully acknowledged. This work was funded in part by the Helmholtz Alliance ICEMED - Imaging and Curing Environmental Metabolic Diseases, through the Initiative and Network Fund of the Helmholtz Association. N. Jon Shah is also funded in part through the EU FP7 project TRIMAGE (Grant no. 602621). The funders had no role in study design, data collection and analysis, decision to publish, or preparation of the manuscript.
References
- 1. Delso G, Fürst S, Jakoby B, Ladebeck R, Ganter C, et al. (2011) Performance measurements of the Siemens mMR integrated whole-Body PET/MRI scanner. J Nucl Med 52: 1914–1922. [DOI] [PubMed] [Google Scholar]
- 2. Zaidi H, Ojha N, Morich M, Griesmer J, Hu Z, et al. (2011) Design and performance evaluation of a whole-body Ingenuity TF PET-MRI system. Phys Med Biol 56: 3091–3106. [DOI] [PMC free article] [PubMed] [Google Scholar]
- 3. Catana C, Wu Y, Judenhofer MS, Qi J, Pichler BJ, et al. (2006) Simultaneous acquisition of multislice PET and MR images: initial results with a MR-compatible PET scanner. J Nucl Med 47: 1968–1976. [PubMed] [Google Scholar]
- 4. Pichler BJ, Judenhofer MS, Catana C, Walton JH, Kneilling M, et al. (2006) Performance test of an LSO-APD detector in a 7-T MRI scanner for simultaneous PET/MRI. J Nucl Med 47: 639–647. [PubMed] [Google Scholar]
- 5.Schmand M, Burbar Z, Corbeil J, Zhang N, Michael C, et al.. (2007) BrainPET: First human tomograph for simultaneous (functional) PET and MR imaging. J Nucl Med (Suppl 2): 310P.
- 6. Schlemmer HP, Pichler B, Schmand M, Burbar Z, Michel C, et al. (2008) Simultaneous MR/PET imaging of the human brain: feasibility study. Radiology 248: 1028–1035. [DOI] [PubMed] [Google Scholar]
- 7. Boss A, Bisdas S, Kolb A, Hofmann M, Ernemann U, et al. (2010) Hybrid PET/MRI of intracranial masses: initial experiences and comparison to PET/CT. J Nucl Med 51: 1198–1205. [DOI] [PubMed] [Google Scholar]
- 8. Herzog H, Langen KJ, Weirich C, Rota Kops E, Kaffanke J, et al. (2011) High resolution BrainPET combined with simultaneous MRI. Nuklearmedizin 50: 74–82. [DOI] [PubMed] [Google Scholar]
- 9. Iida H, Kanno I, Miura S, Murakami, Takahashi K, et al. (1986) A simulation study of a method to reduce positron annihilation spread distributions using a strong magnetic field in positron emission tomography. IEEE Trans Nucl Sci 33: 597–600. [Google Scholar]
- 10. Hao P, Levin CS (2012) Study of PET intrinsic spatial resolution and contrast recovery improvement for PET/MRI systems. Phys Med Biol 57: N101–N115. [DOI] [PubMed] [Google Scholar]
- 11. Hammer B, Christensen NL, Heil BG (1994) Use of magnetic field to increase spatial resolution of positron emission tomography. Med Phys 21: 1917–1920. [DOI] [PubMed] [Google Scholar]
- 12. Raylman RR, Hammer BE, Christensen NL (1996) Combined MRI-PET scanner: A Monte Carlo evaluation of the improvements in PET resolution due the effects of a static homogeneous magnetic field. IEEE Trans Nucl Sci 43: 2406–2412. [Google Scholar]
- 13. Wirrwar A, Vosberg H, Herzog H, Halling H, Weber S, et al. (1997) 4.5 Tesla magnetic field reduces range of high energy positrons-potential: Implications for positron emission tomography. IEEE Trans Nucl Sci 44: 184–189. [Google Scholar]
- 14. Levin CS, Hoffman EJ (1999) Calculation of positron range and its effect on the fundamental limit of positron emission tomography system spatial resolution. Phys Med Biol. 44: 781–799. [DOI] [PubMed] [Google Scholar]
- 15. Kraus R, Delso G, Ziegler SI (2012) Simulation study of tissue-specific positron range correction for the new Biograph mMR whole-body PET/MR system. IEEE Trans Nucl Sci 59: 1900–1909. [Google Scholar]
- 16. Judenhofer MS, Wehrl HF, Newport DF, Catana C, Siegel SB, et al. (2008) Simultaneous PET-MRI: a new approach for functional and morphological imaging. Nature Medicine 14: 459–6515. [DOI] [PubMed] [Google Scholar]
- 17. Heiss WD (2009) The potential of PET/MR for brain imaging. Eur J Nucl Med Mol Imag 36(Suppl1): S105–S112. [DOI] [PubMed] [Google Scholar]
- 18. Herzog H, Langen KJ, Kaffanke J, Weirich C, Neuner I, et al. (2010) MR-PET opens new horizons in neuroimaging. Future Neurol 5: 807–815. [Google Scholar]
- 19. Neuner I, Kaffanke JB, Langen KJ, Rota Kops E, Tellmann L, et al. (2012) Multimodal imaging utilising integrated MR-PET for human brain tumour assessment. Eur Radiol 22(12): 2568–2580. [DOI] [PubMed] [Google Scholar]
- 20. Judenhofer MS, Catana C, Swann BK, Siegel SB, Jung WI, et al. (2007) PET/MRI images, acquired with a compact MRI compatible PET detector in a 7 Tesla magnet. Radiology 244: 807–814. [DOI] [PubMed] [Google Scholar]
- 21. Derenzo SE (1986) Mathematical removal of positron range blurring in high resolution tomography. IEEE Trans Nucl Sci 33: 565–569. [Google Scholar]
- 22. Catana C, van der Kouwe A, Benner T, Michel CJ, Hamm M, et al. (2010) Toward implementing an MRI-based PET attenuation-correction method for neurologic studies on the MR-PET brain prototype. J Nucl Med 51: 1431–1438. [DOI] [PMC free article] [PubMed] [Google Scholar]
- 23. Lehnert W, Gregoire MG, Reilhac A, Meikle SR (2011) Analytical positron range modelling in heterogeneous media for PET Monte Carlo simulation. Phys Med Biol 56: 3313–3335. [DOI] [PubMed] [Google Scholar]
- 24. Champion C, Le Loirec C (2007) Positron follow-up in liquid water: II. Spatial and energetic study for the most important radioisotopes used in PET. Phys Med Biol 52: 6605–6622. [DOI] [PubMed] [Google Scholar]
- 25. Kolb A, Wehrl HF, Hofmann M, Judenhofer MS, Eriksson L, et al. (2012) Technical performance evaluation of a human brain PET/MRI system. Eur Radiol 22: 1776–1788. [DOI] [PubMed] [Google Scholar]
- 26. Fowler JF, Young AE (1959) The average density of the lung. Am J Roentgenol Radium Therapy Nuclear Med 81: 312–315. [PubMed] [Google Scholar]
- 27. Iida H, Hori Y, Ishida K, Imabayashi E, Matsuda H, et al. (2013) Three-dimensional brain phantom containing bone and grey matter structures with a realistic head contour. Ann Nucl Med 27(1): 25–36. [DOI] [PMC free article] [PubMed] [Google Scholar]
- 28. Hoffman EJ, Cutler PD, Digby WM, Mazziotta JC (1990) 3D Phantom to simulate cerebral blood flow and metabolic images for PET. IEEE Trans Nucl Sci 37: 616–620. [Google Scholar]
- 29. Qaim SM, Hohn A, Bastian T, El-Azoney KM, Blessing G, et al. (2003) Some optimisation studies relevant to the production of high-purity 124I and 120gI at a small-sized cyclotron. Appl Radiat Isot 58: 69–78. [DOI] [PubMed] [Google Scholar]
- 30. Hohn A, Coenen HH, Qaim SM (2000) Positron emission intensity in the decay of 120gI. Radiochim Acta 88: 139–141. [Google Scholar]
- 31. Herzog H, Qaim SM, Tellmann L, Spellerberg S, Kruecker D, et al. (2006) Assessment of the short-lived non-pure positron-emitting nuclide 120I for PET imaging. Eur J Nucl Med 33: 1249–1257. [DOI] [PubMed] [Google Scholar]
- 32.Thielemans K, Tsoumpas SC (2006) STIR: Software for Tomographic Image Reconstruction, Release 2. IEEE NSS-MIC Conference Record M06–359. [DOI] [PubMed]
- 33. Hong IK, Chung ST, Kim HK, Kim YB, Son YD, et al. (2007) Ultra fast symmetry and SIMD-based for 3-D PET image reconstruction. IEEE Trans Med Imag 26: 789–803. [DOI] [PubMed] [Google Scholar]
- 34.Lubberink M, Herzog H (2011) Quantitative imaging of 124I and 86Y with PET. Eur J Nucl Med Mol Imag (Suppl 1): S10–18. [DOI] [PMC free article] [PubMed]
- 35.Palmer MR, Parker JA (2004) High resolution imaging with positron emitters: Modeling range blurring effects. IEEE NSS-MIC Confrenece Record 2682–2685.
- 36. Sánchez-Crespo A, Andreo P, Larsson SA (2004) Positron flight in human tissues and its influence on PET image spatial resolution. Eur J Nucl Med Mol Imag 31: 44–51. [DOI] [PubMed] [Google Scholar]
- 37.Alessio A, MacDonald L (2008) Spatially variant positron range modelling derived from CT for PET image reconstruction. IEEE NSS-MIC Conference Record 3637–3640. [DOI] [PMC free article] [PubMed]


