

Abstract
We report learning-related structural plasticity in layer 1 branches of pyramidal neurons in the barrel cortex, a known site of sensorimotor integration. In mice learning an active, whisker-dependent object localization task, layer 2/3 neurons showed enhanced spine growth during initial skill acquisition that both preceded and predicted expert performance. Preexisting spines were stabilized and new persistent spines were formed. These findings suggest rapid changes in connectivity between motor centers and sensory cortex guide subsequent sensorimotor learning.
Keywords: barrel cortex, object localization, perceptual learning, plasticity
Introduction
Perceptual learning and skill acquisition are associated with dramatic changes in the response properties of sensory cortex neurons (Merzenich and Jenkins, 1994; Wiest et al., 2010). After training, top-down influences from higher cortical areas, mediated in part by layer 1 inputs, are capable of influencing functional responses at the earliest stages of cortical processing, in a context-dependent manner (Merzenich and Jenkins, 1994; Gilbert et al., 2009; Petreanu et al., 2012). Whether these changes in function are accompanied by persistent structural changes localized within primary sensory cortex has not been addressed. Previous studies have identified experience-dependent and cell-type-specific growth of persistent spines in the adult sensory neocortex (Trachtenberg et al., 2002; Holtmaat et al., 2006; Hofer et al., 2009; Holtmaat and Svoboda, 2009; Keck et al., 2011; Moczulska et al., 2013). New persistent spines (NPS) are tightly coupled to synapse formation (Knott et al., 2006) and therefore indicative of functional rewiring of cortical circuits. However, aside from one study in auditory cortex (Moczulska et al., 2013), these studies analyzed structural plasticity triggered by sensory deprivation or enrichment. Little is known about structural plasticity at connections that are likely involved in reinforced sensorimotor learning.
Layer (L) 2/3 pyramidal neurons in the barrel cortex receive somatosensory input from L4 neurons. They are also modulated by inputs from motor centers, including the primary motor cortex and the medial subdivision of the posterior nucleus, both of which impinge on their branches in L1 (Petreanu et al., 2009). L2/3 pyramidal neurons are therefore a site of sensorimotor integration, and changes in synaptic input onto these cells may serve as a substrate for sensorimotor learning. We therefore studied the effect of learning an active tactile task on structural plasticity of L2/3 pyramidal neurons.
Materials and Methods
Experiments were approved by the Janelia Farm Animal Care and Use Committee.
Animal preparation.
L2/3 neurons of left barrel cortex in mice (C57BL/6Crl) were labeled with green fluorescent protein using in utero electroporation as described previously (Petreanu et al., 2009). Whiskers were trimmed starting at 6–7 weeks of age, sparing rows C1–3 and D1–3. Retrimming occurred every 3 d under brief isoflurane anesthesia. A titanium headpost was attached to the skull to permit head fixation during training (O'Connor et al., 2010b). A craniotomy (∼2 mm in diameter) was made over the left barrel cortex of 2-month-old mice as described previously (Holtmaat et al., 2009). For ∼10 d before training, mice were limited to 1 ml/d of water. Mice of either sex were randomly assigned to either vibrissa or auditory control training groups (Fig. 1A,B).
Figure 1.
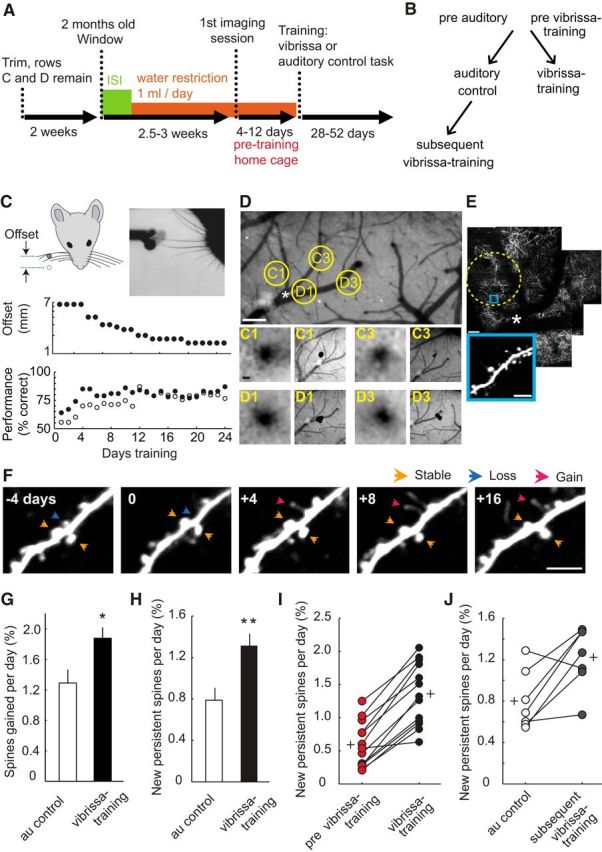
Perceptual learning triggers new spine formation in primary sensory cortex. A, Experimental design. After an initial baseline imaging period spanning 4–12 d (two or three imaging sessions) in which mice were maintained in their home cages and did not visit the training environment, mice were next subjected to either the go/no-go whisker task or the auditory control task that did not require the use of whiskers. Imaging began 4.5–5 weeks after whiskers were first trimmed. The behavioral task was initiated on the same day as the last baseline imaging session. B, Hierarchy of experimental groups. C, Vibrissa training. On each trial, a pole was presented on one side of the mouse face in either a “go” or a “no-go” position. The go and no-go positions were initially offset by 6.5 mm along the anterior–posterior axis. The mouse had to use whisker rows C and D to determine whether the pole was in the go or no-go position. Task difficulty was increased by decreasing the offset, ranging from 6.5 to 0.8 mm. Top plot, Median offset across animals during the course of training. All mice trained in the vibrissa-based task (9 animals) achieved a minimum of 80% performance at an offset distance of 2 mm within 20 d of training. Median performance across animals depicted in lower plot (closed circles; for individual animal offsets and performance, see Fig. 3B). Median performance during auditory training followed a similar trajectory (open circles). D, Example of vasculature and intrinsic signal optical imaging to lo calize C1, C3, D1, and D3 whisker columns. Scale bars, 200 μm. E, Example two-photon image of C1–3 and D1–3 whisker column region. The shadow of blood vessels aligns with vasculature; asterisk indicates alignment. Dashed circle represents column C1. Scale bar, 40 μm; inset, 5 μm. F, Example longitudinal two-photon imaging of individual spine dynamics during 4 d of home cage baseline (−4 d) and whisker-based training (0–16). Scale bar, 5 μm. G, Percentage gained spines per day for “control auditory” (n = 8 cells; 586 spines, 4 animals) and “vibrissa training” only (n = 13 cells; 779 spines; 6 animals that did not experience auditory training) groups, Mann–Whitney U test, p = 0.048. H, Percentage NPS per day for same animals and cells as in G, Mann–Whitney U test, p = 0.009. I, Within-cell comparison of percentage NPS per day for mice in the “whisker-training only” group, before (pre) and after whisker-training, paired t test (p < 0.001). Twelve of 13 cells show an increase in NPS. J, Within-cell comparison of percentage NPS per day for mice first exposed to the control auditory task and subsequently trained in the whisker task (n = 7 cells, 555 spines, 3 animals), paired t test (p = 0.02). Five of 7 cells show an increase in NPS. I, J, Plus symbols represent group means. *p < 0.05. **p < 0.01. Error bars indicate SE across neurons.
Behavioral training.
Methods and apparatus for head-fixed object localization were as described previously (O'Connor et al., 2010a, b). The stimulus object was a 1.59-mm-diameter pole (stainless steel dowel pin, McMaster) coupled to a linear slider (Schneeberger), which moved the pole in the anterior–posterior dimension (9.7 mm from the mouse midline), driven by a stepper motor (Zaber).
Mice were initiated into the training environment on day 0, after the last baseline imaging session. On the first day, mice were shaped to drink water from a lickport.
For day 1 and onward, mice were trained in one session per day. On days mice were also imaged under the two-photon microscope, the imaging session preceded training by at least 2 h. Thus, “4” days training includes one shaping session and three discrimination sessions, “8” days training includes the subsequent four discrimination sessions, etc. Mice typically performed >300 trials within a session (range, 290–400 trials). Sessions typically lasted 40–60 min.
Trials began with the pole descending (∼0.5 s) into reach of the whiskers. The pneumatically driven pole descent produced an audible hissing sound that signaled the start of the trial. After a 0.75 s grace period, the mouse had until 2 s from the start of pole descent to either lick (“go” response) or withhold a lick (“no-go” response). Correct no-go responses (“correct rejections”) were not rewarded, and incorrect no-go responses (“misses”) were not punished. Correct go responses (“hits”) were rewarded with a drop of water (∼8 μl). Incorrect go responses (“false alarms”) triggered a 200 ms air puff and the start of a “time-out” period in which the trial was paused for 5 s. If the mouse licked during this time-out, it received an identical air puff and the time-out period was restarted. Each trial ended with the pole ascending (∼0.75 s).
Performance, reported as percentage correct in plots, was calculated as follows: (no. correct go trials + no. correct no-go trials)/no. of trials, using a 100-trial sliding average. When animals reached >90% performance or >80% for 3 d, task difficulty was increased by moving the no-go position to decrease the offset between the go and no-go positions. The following offset schedule was used (in mm): 6.5, 4, 3.5, 3, 2.75, 2.5, 2.25, 2, 1.75, 1.5, 1.25, 1, 0.9, and 0.8 (Fig. 1C). Within a session, difficulty was never increased more than one time.
The auditory version of the task exploited the hissing sound made by the pneumatic slider at the start of both go and no-go trials. We used this to control for sensory stimulation and stressors not associated with whisker-dependent learning. The “go” stimulus was the sound of the pole moving into a position that was out of reach of the whiskers, and was followed by a miss/hit response window of 2 s. “No-go” trials consisted of a correct rejection/false alarm response window of 2 s preceding the auditory cue; the mouse had to withhold licking during this window to avoid the punishment described above.
Intrinsic signal optical imaging.
Intrinsic signal optical imaging through the glass window was performed as described previously (O'Connor et al., 2013). We localized 2–4 barrel columns within rows C1–3 and D1–3 per mouse (Fig. 1D).
Two-photon imaging.
Mice were lightly anesthetized using isoflurane (3% induction, 1–1.5% maintenance) for 1–1.5 h. GFP was excited at 925 nm with a Ti:Sappire laser (Mai Tai, Spectra Physics) and imaged through a 40× 0.8 NA objective (Olympus). To confirm correct barrel column location, image stacks through layer 1 (10–80 μm from the pia surface) were acquired at a low zoom (scan resolution: 0.50 μm/pixel), in which the shadow of blood vessels was evident (Fig. 1E). Dendrite braches for longitudinal imaging were then located at a higher zoom using a scan resolution of 0.1 μm/pixel (Fig. 1E, inset). Image stacks acquired for spine analysis consisted of sections (scan resolution: 0.07 μm/pixel) acquired using ScanImage software (Pologruto et al., 2003). All dendrites were traced back to cell soma to ensure that soma were located within rows C1–3 and D1–3. Soma location for the groups defined in Fig 1B were as follows: auditory control, 2×C1, 2×C2, 1×C3, 2×D1, 1×D2; subsequent vibrissa training (same as auditory training except one less C1 cell), 1×C1, 2×C2, 1×C3, 2×D1, 1×D2; and vibrissa training, 3×C1, 3×C2, 2×C3, 2×D1, 2×D2, 1×D3. Average number of cells per mouse, dendritic length (microns), and spines per cell for the three groups were (mean ± SEM) as follows: auditory control, 2.00 ± 0.41, 70.63 ± 9.21, 73.25 ± 8.35; subsequent vibrissa training, 1.75 ± 0.48, 76.22 ± 10.18, 79.29 ± 6.66; and vibrissa training, 2.17 ± 0.65, 55.75 ± 5.83, 59.92 ± 8.18.
Image analysis.
Spine dynamics were manually annotated using the Spine Analysis program included in ScanImage software, using criteria previously described (Holtmaat et al., 2009). Spines were annotated and classified as “Loss,” “Gain,” or “Stable.” A lost spine is a spine that was present in the previous imaging session and the scored session but not present in the subsequent session. A gained spine is a spine that first appeared in the scored session. A stable spine is a spine that was present in the previous session, the scored session, and the subsequent session. “Gained” spines present for ≥8 d (present for at least three sessions) were classified as “New Persistent Spines.” Annotation was done by an observer blind to sequence order after the sequential image series of a given dendrite branch was randomly reversed at a probability of 50%. Classification was corrected in reversed sequences after annotation was completed.
To calculate percentage NPS/d for each neuron (Figs. 1H–J, 2a,b, and 3A), first the average number of spines for a given neuron was calculated by summing the number of all spines for the given neuron and dividing the sum by the number of imaging sessions. Then for each imaging session, the number of NPS for a given neuron was divided by the average number of spines as calculated above. Thus, for a given neuron, the denominator was the same across imaging sessions. Finally, because neurons were imaged every 4 d, to report daily NPS formation the above value was divided by 4. To report percentage NPS/d averaged across training days (Fig. 1H–J), percentage NPS/d for each image session, as calculated above, was averaged across the first 24 d of training for each neuron.
Figure 2.

Time course of dendritic spine dynamics during training. a, NPS formation expressed as fold difference relative to control (same dataset as in Fig. 1H; vibrissa training: n = 13 cells, 6 animals; control: n = 8 cells, 4 animals). ANOVA, p = 0.013, post hoc Dunnett, p values for 4–24 d of whisker training versus pretraining: 0.332, 0.006, 0.706, 0.971, 0.562, and 0.999, respectively. b, NPS formation expressed as cumulative summation over the course of training (4–24 d). Home cage pretraining (pre) is shown for comparison and is not included in the cumulative summation values. c, Spine intensity expressed relative to dendritic shaft intensity (see Materials and Methods). Approximately 20% of NPS intensity values fell within the upper 50% fraction of intensity values for stable spines present for the entire experiment. Additionally, the intensity of NPS was significantly higher than spines lost in the next imaging session (Kolmogorov–Smirnov, p = 0.004), although lower than stable spines present for the entire imaging experiment (Kolmogorov–Smirnov, p < 0.001). d, Spine loss expressed as fold difference relative to control. ANOVA, p = 0.020, post hoc Dunnett, p values for 4–24 d of vibrissa training versus pretraining: 0.996, 0.214, 0.306, 0.036, 0.305, and 0.986, respectively. e, Spine loss expressed as cumulative summation over the course of training (4–24 d). Home cage baseline average is shown for comparison (pre) and is not included in the cumulative summation values. f, Average spine density of L2/3 neurons for vibrissa training (closed circles) and control (open circles), with each cell normalized to initial pretraining density. Two-way ANOVA interaction, control/vibrissa training versus time point: p = 0.002. g, Median offset and performance across animals, binned as in a, d. h, Survival curve of preexisting spines, two-way ANOVA main effect, control versus vibrissa training: p = 0.016. i, Survival curve of spines newly formed within the first 4 d of training, two-way ANOVA main effect, control (open circles) versus vibrissa training (closed circles): p = 0.047. *p < 0.05. Error bars indicate SE across neurons.
Figure 3.

Performance of individual animals. A, Correlation of behavioral performance (task difficulty: offset = 2 mm) and NPS formation, for time points at days 4, 8, and 12 of vibrissa training. Plot symbols represent individual mice. Spearman correlation coefficient (r) and p values for 4, 8, and 12 d training, respectively: r = −0.824, p = 0.009; r = −0.487, p = 0.186; and r = 0.544, p = 0.134. B, Progression of skill acquisition for individual mice. Warm colors represent high performance. Offset is indicated by the vertical position of the black bars for each color block plotted on a log scale, as indicated on the upper right side of the plot in italics. Black blocks represent missing data.
To calculate fold difference in NPS (vibrissa training/control) for each imaging session (Fig. 2a), the percentage NPS/d value for each individual neuron in the vibrissa training group was divided by the mean percentage NPS/d across all control neurons, for a given imaging session. Similarly, to calculate the fold difference in loss (vibrissa training/control; Fig. 2d), the percentage loss/d value for each individual neuron in the vibrissa training group was divided by the mean percentage loss/d across all control neurons, for a given imaging session. Relative spine intensity was calculated as in Holtmaat et al. (2005), except that the background-subtracted, summed pixel value for each spine was divided by the average shaft pixel value rather than the summed shaft pixel value (Fig. 2c).
Results
We imaged L1 dendritic spines of L2/3 cells during learning of an object localization task (vibrissa training; Fig. 1A,B). Mice were required to move their whiskers to distinguish two locations of a small pole with a subset (C and D rows) of their mystacial vibrissae (whiskers) for a water reward (O'Connor et al., 2010b). Task difficulty was increased throughout training; when animals reached high performance (>90% correct; or >80% for 3 d) on a version of the task defined by a particular offset between pole positions, the offset was decreased (Fig. 1C).
We labeled L2/3 pyramidal neurons with GFP via in utero electroporation (Petreanu et al., 2009). In naive young adult mice, a small area of skull over the barrel cortex was replaced with a glass window (Holtmaat et al., 2009). Intrinsic signal optical imaging was used to identify the cortical columns corresponding to task-relevant whiskers (D1-D3 and C1-C3; Fig. 1D) for imaging. Approximately 3 weeks after window surgery, we used two-photon microscopy to track dendritic spines in L1 (Fig. 1E,F). A total of 1365 spines were analyzed in 10 mice. Imaging took place over 1–2 months. First, mice were maintained in their home cages and did not visit the training environment for 4–8 d while we obtained baseline measures (two or three imaging sessions). Next, one group of mice was trained in the object localization task (6 animals, “vibrissa training”). This task is known to require the barrel cortex (O'Connor et al., 2010b; Guo et al., 2014). Alternatively, a different group of mice was trained on an auditory version of the task that did not require the use of whiskers (4 animals, “auditory control”) and presumably did not engage the barrel cortex but did expose the mice to the same environment and stressors. A subset of auditory control mice were subsequently trained in the object localization task (3 animals, “subsequent vibrissa training”; Fig. 1B); dendritic spine data from these mice appear only in Figures 1J and 3.
We found that training induced an increase in new spine formation (Fig. 1G). A subset of newly produced spines form new synaptic connections and are identified as NPS (new spines present for ≥8 days) (Holtmaat et al., 2005; Knott et al., 2006). The fraction of NPS for individual neurons increased by 67% during learning of the whisker-dependent go/no-go task compared with control auditory-trained mice (Fig. 1H; Mann–Whitney U test, p = 0.012). We also quantified NPS formation during the baseline period before training (“previbrissae training”) and compared these values with those obtained during vibrissa training, across the same cells. We found that NPS increased twofold compared with the baseline period (Fig. 1I; paired t test, p < 0.001).
Spine dynamics can change in response to an enriched environment (Yang et al., 2009) or stress (Bock et al., 2005). However, the enhanced spine growth we observed (Fig. 1G,H) was specific to learning of the whisker task because the control auditory group experienced the same environment and stressors as the vibrissa trained group and yet developed fewer NPS. Furthermore, we found NPS also increased in mice experiencing vibrissa training after first learning the auditory task (53%; Fig. 1J; paired t test, p = 0.02). We did not detect a difference between the baseline period of the vibrissa-trained group (Fig. 1I; “previbrissae training”) and the auditory control group (Fig. 1G,H; “au control,” t test, p = 0.186). Together, the vast majority (17 of 20) of imaged L2/3 neurons showed an increase in NPS associated with tactile learning (Fig. 1I,J).
We analyzed the time course of structural dynamics (Fig. 2). We found that NPS accumulation, averaged across the 6 animals in the “vibrissa training” only group, was elevated during the first 8 d of training (Fig. 2a,b), while mice learned to associate pole position with water reward in the simplest versions of the task (Fig. 2g; median offset at the 8 day time-bin, 4.4 mm). To better understand how NPS size compares with mature spine sizes, we analyzed spine volumes of new persistent, stable, and lost spines. The spine sizes in the NPS population were distinct from spines that were lost in the next imaging session (Kolmogorov–Smirnov, p = 0.004). Median NPS spine size was 90% larger compared with lost spines, although it was 51% smaller than stable spines present for the entire imaging experiment (Fig. 2c).
In addition to the rapid effect of training on spine formation, our time course analysis revealed that spine loss was significantly reduced during later stages of learning compared with the control group (Fig. 2d,e; ANOVA, p = 0.020). Consistent with these results, we found that the net impact of training was a modest increase in spine density (Fig. 2f). Thus, perceptual learning stabilized spines in L1. To determine whether stabilization was specific to spines formed during training or applied also to preexisting spines, we quantified spine survival percentages. We found that perceptual learning stabilized both preexisting and newly formed spines (Fig. 2h,i). These results distinguish the effect of reinforced sensorimotor learning in L1 branches of L2/3 excitatory neurons from novel environmental exposure in which spine elimination within L1 branches of L5 excitatory neurons is increased (Yang et al., 2009).
To further explore the behavioral relevance of increased NPS formation, we examined the relationship between performance and NPS formation. When considering all whisker-trained animals, we noted that there was an animal-by-animal correlation between NPS formation and behavioral performance for the first few days of training (Fig. 3A). Animals learned at different rates (Fig. 3B), and those animals with slower rates of learning formed less NPS at the 4 day time point. Thus, the initial training-induced structural changes that occur on L1 branches of L2/3 excitatory neurons are predictive of subsequent performance.
Discussion
Our results indicate that new spines are produced in layer 2/3 primary sensory cortical neurons to support learning during discrimination training. We found that both preexisting spines and newly formed spines in L2/3 neurons stabilize during perceptual learning, resulting in a net increase in spine density. During vibrissa-based object localization, L1 of primary somatosensory cortex receives diverse, axon-specific information from motor cortex (Petreanu et al., 2012). The widespread structural changes we observed within L1 could dramatically impact the manner in which motor information is integrated and received within L2/3 neurons over the course of learning to facilitate progressive improvement of discriminative performance.
The rapid growth of persistent spines in response to behavioral training observed here is similar to that of L5 neurons in the auditory cortex (Moczulska et al., 2013), prefrontal cortex specifically during extinction training (Lai et al., 2012), and motor cortex (Xu et al., 2009; Yang et al., 2009). Also in common with our findings, previous studies have shown that learning-induced synapse formation correlates with performance in the motor cortex (Xu et al., 2009; Yang et al., 2009; Liston et al., 2013; Parkhurst et al., 2013). Thus, our findings establish that, similar to L5 neurons, structural connectivity of L2/3 neurons is remodeled during learning.
Additionally, a recent study examining cocaine-conditioned place preference learning in L5 neurons of the prefrontal cortex reported that both preexisting and newly formed spines are stabilized during cocaine conditioning (Muñoz-Cuevas et al., 2013). However, in motor cortex, motor-skill learning leads to elimination of preexisting spines (Xu et al., 2009; Yang et al., 2009). Together, the data indicate that de novo synapse formation occurs in a wide range of cortical regions and across many cortical behavioral paradigms, but the degree to which preexisting spines are maintained differs across cortical areas and/or cell types.
Footnotes
We thank Ryan Wyatt and Mark Nicholas for help with analysis; Janelia Farm vivarium staff for assistance in water restriction; Denise O'Connor, Daniel Huber, and Leopoldo Petreanu for help with in utero electroporation; and Joshua Trachtenberg, Zengcai Guo, Mac Hooks, Daniel Huber, and Nuo Li for comments on the manuscript. We acknowledge the support of the HHMI visiting scientists program.
The authors declare no competing financial interests.
References
- Bock J, Gruss M, Becker S, Braun K. Experience-induced changes of dendritic spine densities in the prefrontal and sensory cortex: correlation with developmental time windows. Cereb Cortex. 2005;15:802–808. doi: 10.1093/cercor/bhh181. [DOI] [PubMed] [Google Scholar]
- Gilbert CD, Li W, Piech V. Perceptual learning and adult cortical plasticity. J Physiol. 2009;587:2743–2751. doi: 10.1113/jphysiol.2009.171488. [DOI] [PMC free article] [PubMed] [Google Scholar]
- Guo ZV, Li N, Huber D, Ophir E, Gutnisky D, Ting JT, Feng G, Svoboda K. Flow of cortical activity underlying a tactile decision in mice. Neuron. 2014;81:179–194. doi: 10.1016/j.neuron.2013.10.020. [DOI] [PMC free article] [PubMed] [Google Scholar]
- Hofer SB, Mrsic-Flogel TD, Bonhoeffer T, Hübener M. Experience leaves a lasting structural trace in cortical circuits. Nature. 2009;457:313–317. doi: 10.1038/nature07487. [DOI] [PMC free article] [PubMed] [Google Scholar]
- Holtmaat A, Svoboda K. Experience-dependent structural synaptic plasticity in the mammalian brain. Nat Rev Neurosci. 2009;10:647–658. doi: 10.1038/nrn2699. [DOI] [PubMed] [Google Scholar]
- Holtmaat AJ, Trachtenberg JT, Wilbrecht L, Shepherd GM, Zhang X, Knott GW, Svoboda K. Transient and persistent dendritic spines in the neocortex in vivo. Neuron. 2005;45:279–291. doi: 10.1016/j.neuron.2005.01.003. [DOI] [PubMed] [Google Scholar]
- Holtmaat A, Wilbrecht L, Knott GW, Welker E, Svoboda K. Experience-dependent and cell-type-specific spine growth in the neocortex. Nature. 2006;441:979–983. doi: 10.1038/nature04783. [DOI] [PubMed] [Google Scholar]
- Holtmaat A, Bonhoeffer T, Chow DK, Chuckowree J, De Paola V, Hofer SB, Hübener M, Keck T, Knott G, Lee WC, Mostany R, Mrsic-Flogel TD, Nedivi E, Portera-Cailliau C, Svoboda K, Trachtenberg JT, Wilbrecht L. Long-term, high-resolution imaging in the mouse neocortex through a chronic cranial window. Nat Protoc. 2009;4:1128–1144. doi: 10.1038/nprot.2009.89. [DOI] [PMC free article] [PubMed] [Google Scholar]
- Keck T, Scheuss V, Jacobsen RI, Wierenga CJ, Eysel UT, Bonhoeffer T, Hübener M. Loss of sensory input causes rapid structural changes of inhibitory neurons in adult mouse visual cortex. Neuron. 2011;71:869–882. doi: 10.1016/j.neuron.2011.06.034. [DOI] [PubMed] [Google Scholar]
- Knott GW, Holtmaat A, Wilbrecht L, Welker E, Svoboda K. Spine growth precedes synapse formation in the adult neocortex in vivo. Nat Neurosci. 2006;9:1117–1124. doi: 10.1038/nn1747. [DOI] [PubMed] [Google Scholar]
- Lai CS, Franke TF, Gan WB. Opposite effects of fear conditioning and extinction on dendritic spine remodelling. Nature. 2012;483:87–91. doi: 10.1038/nature10792. [DOI] [PubMed] [Google Scholar]
- Liston C, Cichon JM, Jeanneteau F, Jia Z, Chao MV, Gan WB. Circadian glucocorticoid oscillations promote learning-dependent synapse formation and maintenance. Nat Neurosci. 2013;16:698–705. doi: 10.1038/nn.3387. [DOI] [PMC free article] [PubMed] [Google Scholar]
- Merzenich MM, Jenkins WM. Cortical representation of learned behaviors. Amsterdam: Elsevier; 1994. [Google Scholar]
- Moczulska KE, Tinter-Thiede J, Peter M, Ushakova L, Wernle T, Bathellier B, Rumpel S. Dynamics of dendritic spines in the mouse auditory cortex during memory formation and memory recall. Proc Natl Acad Sci U S A. 2013;110:18315–18320. doi: 10.1073/pnas.1312508110. [DOI] [PMC free article] [PubMed] [Google Scholar]
- Muñoz-Cuevas FJ, Athilingam J, Piscopo D, Wilbrecht L. Cocaine-induced structural plasticity in frontal cortex correlates with conditioned place preference. Nat Neurosci. 2013;16:1367–1369. doi: 10.1038/nn.3498. [DOI] [PMC free article] [PubMed] [Google Scholar]
- O'Connor DH, Peron SP, Huber D, Svoboda K. Neural activity in barrel cortex underlying vibrissa-based object localization in mice. Neuron. 2010a;67:1048–1061. doi: 10.1016/j.neuron.2010.08.026. [DOI] [PubMed] [Google Scholar]
- O'Connor DH, Clack NG, Huber D, Komiyama T, Myers EW, Svoboda K. Vibrissa-based object localization in head-fixed mice. J Neurosci. 2010b;30:1947–1967. doi: 10.1523/JNEUROSCI.3762-09.2010. [DOI] [PMC free article] [PubMed] [Google Scholar]
- O'Connor DH, Hires SA, Guo ZV, Li N, Yu J, Sun QQ, Huber D, Svoboda K. Neural coding during active somatosensation revealed using illusory touch. Nat Neurosci. 2013;16:958–965. doi: 10.1038/nn.3419. [DOI] [PMC free article] [PubMed] [Google Scholar]
- Parkhurst CN, Yang G, Ninan I, Savas JN, Yates JR, 3rd, Lafaille JJ, Hempstead BL, Littman DR, Gan WB. Microglia promote learning-dependent synapse formation through brain-derived neurotrophic factor. Cell. 2013;155:1596–1609. doi: 10.1016/j.cell.2013.11.030. [DOI] [PMC free article] [PubMed] [Google Scholar]
- Petreanu L, Mao T, Sternson SM, Svoboda K. The subcellular organization of neocortical excitatory connections. Nature. 2009;457:1142–1145. doi: 10.1038/nature07709. [DOI] [PMC free article] [PubMed] [Google Scholar]
- Petreanu L, Gutnisky DA, Huber D, Xu NL, O'Connor DH, Tian L, Looger L, Svoboda K. Activity in motor-sensory projections reveals distributed coding in somatosensation. Nature. 2012;489:299–303. doi: 10.1038/nature11321. [DOI] [PMC free article] [PubMed] [Google Scholar]
- Pologruto TA, Sabatini BL, Svoboda K. ScanImage: flexible software for operating laser scanning microscopes. Biomed Eng Online. 2003;2:13. doi: 10.1186/1475-925X-2-13. [DOI] [PMC free article] [PubMed] [Google Scholar]
- Trachtenberg JT, Chen BE, Knott GW, Feng G, Sanes JR, Welker E, Svoboda K. Long-term in vivo imaging of experience-dependent synaptic plasticity in adult cortex. Nature. 2002;420:788–794. doi: 10.1038/nature01273. [DOI] [PubMed] [Google Scholar]
- Wiest MC, Thomson E, Pantoja J, Nicolelis MA. Changes in S1 neural responses during tactile discrimination learning. J Neurophysiol. 2010;104:300–312. doi: 10.1152/jn.00194.2010. [DOI] [PMC free article] [PubMed] [Google Scholar]
- Xu T, Yu X, Perlik AJ, Tobin WF, Zweig JA, Tennant K, Jones T, Zuo Y. Rapid formation and selective stabilization of synapses for enduring motor memories. Nature. 2009;462:915–919. doi: 10.1038/nature08389. [DOI] [PMC free article] [PubMed] [Google Scholar]
- Yang G, Pan F, Gan WB. Stably maintained dendritic spines are associated with lifelong memories. Nature. 2009;462:920–924. doi: 10.1038/nature08577. [DOI] [PMC free article] [PubMed] [Google Scholar]