

High-throughput sequencing of DNA marker genes recovered from environmental samples (known as ecogenomics or metabarcoding) is an emerging tool for understanding patterns and processes in ecology and biodiversity [1]. The recent paper ‘Are there species smaller than 1 mm?’ [2] was inspired by a re-examination of published metabarcoding data from meiobiotic communities (including meiofauna and protists less than 1 mm) [3,4] which did not support the existence of well-defined genetic species. Rossberg et al. (hereafter referred to as RRM) noted that this observation is ‘at odds with much of the existing theoretical literature’ [2, p. 2]. Moreover, there are many empirical studies that demonstrate well-defined genetic species in meiobiotal organisms using phylogenetic, biological and morphological criteria [5–8]. Here, we offer a contrasting view highlighting a number of analytical and theoretical issues that cast doubt on their conclusion that available data are consistent with the hypothesis that ‘ecospecies form only for organisms with body sizes exceeding the millimetre scale’ [2, p. 6]. We provide new analyses to support our view that the cited observations for meiobiotic communities are affected by analytical artefacts generated by errors in the pyrosequencing reads that were not fully corrected in the original studies. We demonstrate that removing the noise generated by these errors results in small organisms exhibiting signals of species formation similar to those of larger species.
Models developed by RRM showed that ecospecies are unlikely to form under high values of μK, the product of mutation rate (μ) and carrying capacity (K). Additionally, they showed that under conditions where ecospecies form, a lineage-through-time (LTT) plot on double-logarithmic axes exhibits a characteristic shape, including a plateau that separates the intra-specific and inter-specific diversification timescales. RRM compared their model predictions to published results using an analogue of LTT plots (the relationship between the published number of operational taxonomic units (OTUs) and increasing genetic clustering distance). Under these conditions, meiobiotal community data display a steady decline of OTU counts instead of the plateau displayed by DNA sequences from larger organisms (their fig. 1 [2]). RRM proposed three explanations why meiobiotal metabarcoding data do not exhibit the plateau: (i) the inflection points corresponding to ecospecies lie outside the range of genetic distances explored (1–10%); (ii) the plots represent methodological artefacts or (iii) species cannot form in meiofaunal assemblages, as μK is too large. RRM hypothesized that the higher carrying capacity of small organisms is potentially responsible for the inferred differences in species formation between large and small organisms [2], although they acknowledged that the underlying data may be affected by methodological artefacts, in particular that errors in pyrosequencing data can lead to inflated OTU counts.
We believe that the original meiobiotal results cited in RRM indeed are significantly influenced by methodological errors that obscure the true LTT relationships and alter their interpretation. It is now widely recognized that the metabarcoding protocol generates errors that lead to inflated diversity estimates in environmental samples [4,8]. Algorithms such as OCTUPUS [4] and ESPRIT [8], which were originally used to generate the results cited by RRM [3,4], attempt to account for combinations of these errors to provide more accurate estimates of taxonomic richness and composition.
Algorithms for detecting and removing errors are commonly tested by sequencing mock communities (pools of known DNA sequences) [9]. Mock communities are useful when addressing hypotheses about the signatures of species formation as they comprise unambiguous genetic species and should show LTT patterns characteristic of ecospecies formation. We therefore examined a widely used mock community comprising 21 genetically distinct species with high inter-species divergence, but no intra-specific variability at clustering distances above 1% [10]. LTT plots for the known reference sequences for this mock community (see the electronic supplementary material) display the expected plateau corresponding to the known number of genetic species at 1% clustering distance (figure 1—triangles). However, LTT plots for the raw pyrosequences from this community display a curve consistent with the lack of ecospecies over the same interval of genetic distances considered by RRM, and the number of OTUs is consistently overestimated (figure 1—diamonds). The result is similar using data processed with OCTUPUS (figure 1—circles). Now the plateau is more sharply defined with the inflection point close to the correct number of species, but it is not apparent within the genetic distance interval plotted by RRM (fig. 1 in [2]). Again, the number of OTUs is consistently overestimated at all clustering distances compared with the underlying reference sequences. This indicates that pyrosequencing noise, rather than the characteristics of the underlying community, is responsible for the pattern observed by RRM, and that the analytical methods used in the paper from which the data were taken were unable to account for this effect. Thus, even in cases where the underlying community comprises a known number of well-defined genetic species, failure to remove the noise generated by errors results in plots that lack a clustering threshold defining genetic species. When these errors are removed using the more effective method APDP [9] (figure 1—squares), the sequence data conform to the expected pattern characteristic of a community of well-defined genetic species, confirming that accurate error removal is possible, and vital to recovering the real signal in pyrosequenced DNA samples.
Figure 1.
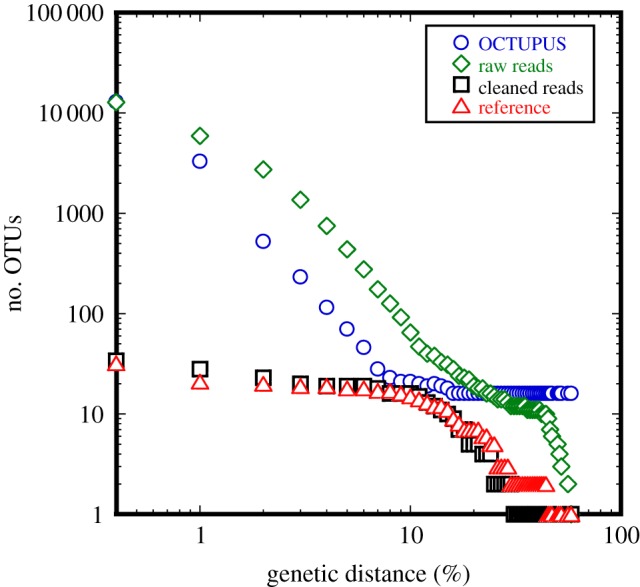
Relationship between genetic distance and the observed number of OTUs for the 21-species Human Microbiome Project mock community dataset. Note the log-scale on both axes. Points on the y-axis indicate the number of unique sequences observed after each treatment. (Online version in colour.)
We applied the same error-removal approach (APDP) to one of the marine littoral benthos environmental datasets [4] (referred to as FO in [2]) to test whether errors similarly influence the observed relationships in RRM. We see a similar relationship for raw reads and error-cleaned sequences to that observed for the mock community sequences (figure 2), and the cleaned sequences now display the plateau that was absent from RRM's results [2]. Here, the initial steep gradient representing intra-specific variation is absent, likely because this 18S region is highly conserved even between species of the same genus and intra-specific variation is expected to be below the range plotted by RRM [6,11–13].
Figure 2.
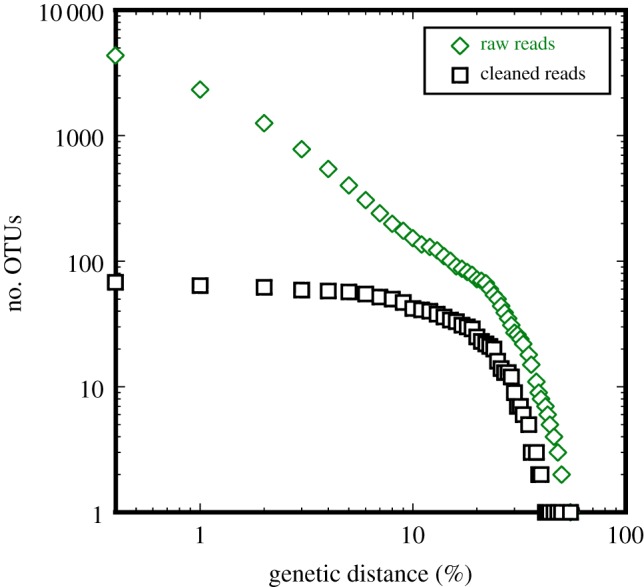
Relationship between genetic distance and the observed number of OTUs for raw reads and error-cleaned sequences derived from the FO dataset [4]. Note the log-scale on both axes. Points on the y-axis indicate the number of unique sequences observed after each treatment. (Online version in colour.)
The models developed by RRM suggest that ecospecies are unlikely to form under high values of μK, and RRM hypothesized that the higher carrying capacity K of small organisms could be responsible for their observed differences in species formation [2]. Alternatively, we propose that the incomplete removal of minor sequence variants, generated errors from the real gene sequences in the underlying community, will mimic high mutation rates (μ). That is, the patterns for pyrosequenced meiobiotal communities look similar to those generated by the model for high μK values because μ is artificially elevated, not because small organisms have higher carrying capacities than large organisms.
Further to the interpretation of the cited empirical data, we have concerns about the application of the model to meiobiota. Firstly, the model describes ecospecies formation in a single panmictic population, and it is unclear whether the application of such a model to meiobiotal community ecology is valid. The macroinvertebrate data analysed in RRM featured a limited number of species from one beetle genus and a complex of neotropical butterflies [13,14], whereas the meiobiotal data included taxa from approximately 14 phyla of meiobiotic and protist lineages [3,4]. Given the variability in rates and patterns of molecular evolution, life histories, taxonomic complexity and population sizes represented in such communities, a continuum of lineages at different levels of sequence similarity should be predicted a priori. Secondly, the model used in RRM proposes a constant rate of asexual reproduction in all individuals and constant carrying capacity in a unidimensional ecological niche, with no opportunities for allopatric or parapatric speciation. This model reflects the mode of evolution of parthenogenetic species and of mtDNA in sexually reproducing species, but the meiobiotal biosphere violates the assumptions of the model in many ways. While many meiobiota reproduce asexually, the majority are sexual. Importantly, meiobiotal species also differ markedly in size (44 µm–1 mm [3,4]), consequent reproductive rate (e.g. between 1 and 55 generations per year in nematodes [15]) and carrying capacities are strongly affected by nutrient inputs [16]. Furthermore, interstitial taxa are notoriously patchy and often possess life histories lacking a dispersal phase [16]. Asynchronous reproductive rates, variable carrying capacity and heterogeneous ecological distributions will introduce temporal and population genetic variability in levels of gene flow, hence enhanced opportunity for drift and natural selection to act on temporally and spatially disjunct populations. Although all models are simplifications of real-world processes, the present simulations of RRM do not take into account these potentially significant deviations from the assumptions of their model. Finally, there is ample independent empirical evidence for species below 1 mm in size. Briefly, many taxa exist as populations that are reproductively isolated [5] and display concordant genetic variation at nuclear and mitochondrial loci [17], and even very closely related meiobiotal species display consistent morphological [6,18] and behavioural differences [19] that also coincide with ecological differentiation [19]. There is also clear evidence for biogeographic structuring of microscopic eukaryotes [20,21]. While the proposal that small organisms cannot form species might be supported if all organisms existed in conditions defined by the model, the existence of clearly defined genetic and ecological species supports the proposal that these models are not appropriate for organisms that compose meiobiotal communities.
Microscopic organisms are a vital component of the biosphere and underpin the majority of ecosystem processes. Given the recent advances in sequencing technology, we are now in a position to explore microscopic biodiversity, associated ecosystem function and reaction to environmental change. However, accurate interpretation of the taxonomic diversity of these data will be vital in forming and testing hypotheses about ecological and evolutionary patterns and processes. The extraordinary claim that species cannot form for small organisms is clearly at odds with much of the existing observational and theoretical literature, and it is far from clear that the currently available data provided by RRM support it. On the basis of our re-analyses that account for the noise in metabarcoding datasets, the available data are not consistent with the hypothesis that ecospecies form only for larger organisms. In conjunction with the existing literature, which provides strong evidence that meiobiotal species have been, and continue to be, observed experimentally, there is little empirical evidence to support a distinction between the abilities of large and small organisms to form genetic species on the basis of size alone.
Footnotes
The accompanying reply can be viewed at http:/dx.doi.org/doi:10.1098/rspb.2014.0191.
References
- 1.Taberlet P, Coissac E, Pompanon F, Brochmann C, Willerslev E. 2012. Towards next-generation biodiversity assessment using DNA metabarcoding. Mol. Ecol. 21, 2045–2050 (doi:10.1111/j.1365-294X.2012.05470.x) [DOI] [PubMed] [Google Scholar]
- 2.Rossberg AG, Rogers T, McKane AJ. 2013. Are there species smaller than 1 mm? Proc. R. Soc. B 280, 20131248 (doi:10.1098/rspb.2013.1248) [DOI] [PMC free article] [PubMed] [Google Scholar]
- 3.Creer S, et al. 2010. Ultrasequencing of the meiofaunal biosphere: practice, pitfalls and promises. Mol. Ecol. 19(Suppl. 1), 4–20 (doi:10.1111/j.1365-294X.2009.04473.x) [DOI] [PubMed] [Google Scholar]
- 4.Fonseca VG, et al. 2010. Second-generation environmental sequencing unmasks marine metazoan biodiversity. Nat. Commun. 1, 98 (doi:10.1038/ncomms1095) [DOI] [PMC free article] [PubMed] [Google Scholar]
- 5.Fonseca G, Derycke S, Moens T. 2008. Integrative taxonomy in two free-living nematode species complexes . Biol. J. Linn. Soc. 94, 737–753 (doi:10.1111/j.1095-8312.2008.01015.x) [Google Scholar]
- 6.Bass D, Howe AT, Mylnikov AP, Vickerman K, Chao EE, Smallbone JE, Snell J, Cabral C, Jr, Cavalier-Smith T. 2009. Phylogeny and classification of Cercomonadida (Protozoa, Cercozoa): Cercomonas, Eocercomonas, Paracercomonas, and Cavernomonas gen. nov. Protist 160, 483–521 (doi:10.1016/j.protis.2009.01.004) [DOI] [PubMed] [Google Scholar]
- 7.Howe AT, Bass D, Vickerman K, Chao EE, Cavalier-Smith T. 2009. Phylogeny, taxonomy, and astounding genetic diversity of Glissomonadida ord. nov. the dominant gliding zooflagellates in soil (Protozoa: Cercozoa). Protist 160, 159–189 (doi:10.1016/j.protis.2008.11.007) [DOI] [PubMed] [Google Scholar]
- 8.Sun Y, Cai Y, Liu L, Yu F, Farrell ML, McKendree W, Farmerie W. 2009. ESPRIT: estimating species richness using large collections of 16S rRNA pyrosequences. Nucleic Acids Res. 37, e76 (doi:10.1093/nar/gkp285) [DOI] [PMC free article] [PubMed] [Google Scholar]
- 9.Morgan MJ, Chariton AA, Hartley DM, Court LN, Hardy CM. 2013. Improved inference of taxonomic richness from environmental DNA. PLoS ONE 8, e71974 (doi:10.1371/journal.pone.0071974) [DOI] [PMC free article] [PubMed] [Google Scholar]
- 10.Jumpstart Consortium Human Microbiome Project Data Generation Working Group. 2012. Evaluation of 16S rDNA-based community profiling for human microbiome research. PLoS ONE 7, e39315 (doi:10.1371/journal.pone.0039315) [DOI] [PMC free article] [PubMed] [Google Scholar]
- 11.Tang CQ, Leasi F, Obertegger U, Kieneke A, Barraclough TG, Fontaneto D. 2012. The widely used small subunit 18S rDNA molecule greatly underestimates true diversity in biodiversity surveys of the meiofauna. Proc. Natl Acad. Sci. USA 109, 16 208–16 212 (doi:10.1073/pnas.1209160109) [DOI] [PMC free article] [PubMed] [Google Scholar]
- 12.Blaxter ML, De Ley P, Garey JR, Liu LX, Scheldeman P, Vierstraete A, Thomas WK. 1998. A molecular evolutionary framework for the phylum Nematoda. Nature 392, 71–75 (doi:10.1038/32160) [DOI] [PubMed] [Google Scholar]
- 13.Jones M, Ghoorah A, Blaxter M. 2011. jMOTU and Taxonerator: turning DNA barcode sequences into annotated operational taxonomic units . PLoS ONE 6, e19259 (doi:10.1371/journal.pone.0019259) [DOI] [PMC free article] [PubMed] [Google Scholar]
- 14.Pons J, Barraclough TG, Gomez-Zurita J, Cardoso A, Duran DP, Hazell S, Kamoun S, Sumlin WD, Vogler AP. 2006. Sequence-based species delimitation for the DNA taxonomy of undescribed insects. Syst. Biol. 55, 595–609 (doi:10.1080/10635150600852011) [DOI] [PubMed] [Google Scholar]
- 15.Vranken G, Heip C. 1983. Calculation of the intrinsic rate of natural increase, rm, with Rhabditis marina Bastian 1865 (Nematoda). Nematologica 29, 468–477 (doi:10.1163/187529283X00348) [Google Scholar]
- 16.Giere O. 2009. Meiobenthology: the microscopic motile fauna of aquatic sediments. Heidelberg, Germany: Springer [Google Scholar]
- 17.Derycke S, Remerie T, Backeljau T, Vierstraete A, Vanfleteren J, Vincx M, Moens T. 2008. Phylogeography of the Rhabditis (Pellioditis) marina species complex: evidence for long-distance dispersal, and for range expansions and restricted gene flow in the northeast Atlantic. Mol. Ecol. 17, 3306–3322 (doi:10.1111/j.1365-294X.2008.03846.x) [DOI] [PubMed] [Google Scholar]
- 18.De Oliveira DAS, Decraemer W, Holovachov O, Burr J, De Ley IT, De Ley P, Moens T, Derycke S. 2012. An integrative approach to characterize cryptic species in the Thoracostoma trachygaster Hope, 1967 complex (Nematoda: Leptosomatidae). Zool. J. Linn. Soc. 164, 18–35 (doi:10.1111/j.1096-3642.2011.00758.x) [Google Scholar]
- 19.De Meester N, Derycke S, Moens T. 2012. Differences in time until dispersal between cryptic species of a marine nematode species complex. PLoS ONE 7, e42674 (doi:10.1371/journal.pone.0042674) [DOI] [PMC free article] [PubMed] [Google Scholar]
- 20.Fontaneto D. 2011. Biogeography of microscopic organisms: is everything small everywhere? Cambridge, UK: Cambridge University Press [Google Scholar]
- 21.Bass D, Richards TA, Matthai L, Marsh V, Cavalier-Smith T. 2007. DNA evidence for global dispersal and probable endemicity of protozoa. BMC Evol. Biol. 7, 162 (doi:10.1186/1471-2148-7-162) [DOI] [PMC free article] [PubMed] [Google Scholar]