

SUMMARY
Climbing fibers (CFs) are thought to contribute to cerebellar plasticity and learning by triggering a large influx of dendritic calcium in the postsynaptic Purkinje cell (PC) to signal the occurrence of an unexpected sensory event. However, CFs fire about once per second whether or not an event occurs, raising the question of how sensory-driven signals might be distinguished from a background of ongoing spontaneous activity. Here, we report that in PC dendrites of awake mice, CF-triggered calcium signals are enhanced when the trigger is a sensory event. In addition, we show that a large fraction of the total enhancement in each PC dendrite can be accounted for by an additional boost of calcium provided by sensory activation of a non-CF input. We suggest that sensory stimulation may modulate dendritic voltage and calcium concentration in PCs to increase the strength of plasticity signals during cerebellar learning.
INTRODUCTION
Calcium is the trigger for cellular mechanisms of plasticity in many neurons throughout the brain and as such, it is thought to play a central role during learning and memory formation (Sjöström and Nelson, 2002; Zucker, 1999). For Purkinje cells (PCs) of the cerebellar cortex, the job of generating the calcium signals necessary for plasticity and learning is often attributed to the powerful climbing fiber (CF) input (De Zeeuw et al., 1998; Ito, 2013; Raymond et al., 1996; Simpson et al., 1996; Thach et al., 1992). This is because in many learning tasks, CFs seem to play the role of “teachers” by firing a burst of action potentials to signal that an unexpected sensory event has occurred (Gilbert and Thach, 1977; Kitazawa et al., 1998; Medina and Lisberger, 2008; Rasmussen et al., 2008; Raymond and Lisberger, 1998; Soetedjo et al., 2008). In turn, the CF burst produces a strong depolarization of the postsynaptic PC and causes a calcium-based dendritic spike that serves as the trigger for a variety of plasticity mechanisms (Kitamura and Kano, 2013; Schmolesky et al., 2002). In this report, we use calcium imaging of PC dendrites in awake mice to resolve a long-standing question about the way CF inputs encode information and generate plasticity signals in the cerebellum.
It was pointed out 40 years ago that from the perspective of an individual PC, CF signals are potentially ambiguous (Gilbert, 1975). In the adult cerebellum, each PC receives input from a single CF (Ito, 1984), and every CF fires bursts of action potentials spontaneously at a rate of about once per second in vivo (Ito, 1984). Furthermore, early investigators demonstrated that because CF bursts are “all or nothing” (Crill, 1970), they evoke the same electrical response in the soma of the postsynaptic PC (i.e., a complex spike [CS]) regardless of whether the CF input fired spontaneously or in response to a sensory event (Eccles et al., 1966). These classic electrophysiology studies led to the current view of cerebellar learning, according to which all individual CF bursts are equivalent, and therefore to obtain information about sensory-driven instructive signals, one must collect responses to CF inputs over many learning trials or many PCs (Gibson et al., 2004; Houk et al., 1996; Mauk and Donegan, 1997; Ozden et al., 2009; Schultz et al., 2009).
Our experiments challenge the classical view that spontaneous and sensory-driven CF inputs are equivalent. This view does not take into account the fact that the somatic and dendritic compartments of the PC are functionally separate and process CF signals independently during synaptic activation (Davie et al., 2008; Llinás and Sugimori, 1980). Therefore, we designed our experiments to test whether spontaneous and sensory-driven CF inputs are different from each other, not by recording the electrical CS response near the PC soma as in previous work (Eccles et al., 1966), but by measuring CF-triggered calcium spikes and visualizing dendritic plasticity signals directly.
RESULTS
We used two-photon microscopy to image spontaneous and sensory-driven calcium spikes triggered by activation of the CF input to individual PC dendrites. Awake mice were head-fixed on top of a cylindrical treadmill while we delivered periocular airpuffs via a needle pointed toward the eye (Figure 1A). We imaged 13 locations in five mice and found CF-triggered calcium spikes in response to the periocular airpuff in a total of 76 PCs distributed broadly within three separate zones of the cerebellar cortex (Figure 1B): the vermis of lobule VI and the paravermis of lobules IV/V and VI.
Figure 1. Imaging Calcium Spikes in PC Dendrites of Awake Mice.
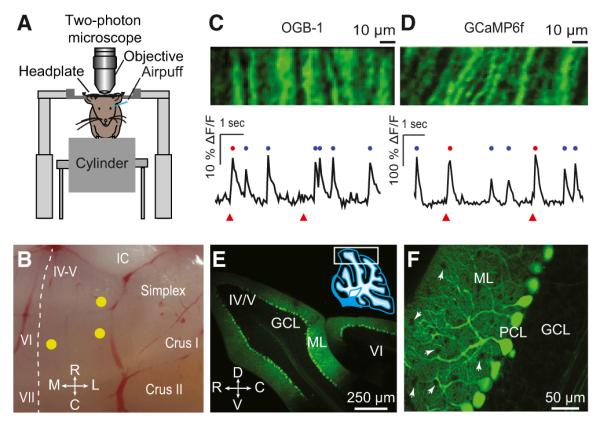
(A) Two-photon microscopy of cerebellar cortex in awake mice, head-fixed on a cylindrical treadmill. Airpuff stimuli were delivered to the ipsilateral eye.
(B) Imaged locations in cerebellar cortex (yellow circles). Dashed line indicates the midline.
(C) Top: field of view showing PC dendrites in an example OGB-1/AM experiment. Bottom: an example fluorescence trace representing spontaneous (blue dots) and sensory-evoked (red dots) calcium spikes in response to periocular airpuff stimuli (triangles).
(D) Same as (C), for an example GCaMP6f experiment.
(E and F) Expression of GCaMP6f (green) in PCs (PCL, Purkinje cell layer) located in the area marked by a rectangle in the inset of (E). Notice the absence of staining in the GC layer (GCL) and MLIs (white arrows in F). C, caudal; D, dorsal; IC, inferior colliculus; L, lateral; M, medial; R, rostral; V, ventral. IV-V, VI, VII, simplex, and crusI/II are different lobules.
As in earlier imaging studies (Ozden et al., 2008; Sullivan et al., 2005), PC dendrites appeared as elongated structures separated from each other by 5–10 μm (Figures 1C and 1D, top). We used two different fluorescent calcium indicators with complementary advantages: OGB-1/AM (Figure 1C), a fast-responding synthetic indicator that can be bulk loaded and is taken up by a variety of cell types in the cerebellar cortex (Sullivan et al., 2005), and GCaMP6f (Figure 1D), a genetically encoded calcium indicator with slower kinetics that allows cell-type-specific expression (Figures 1E and 1F; see Experimental Procedures). With GCaMP6f, we observed labeled PCs at an average density of 13.6 ± 1.4 cells per 104 μm2 cortical surface area, an estimated 76% of all PCs (percentages were calculated in comparison with cell densities reported in Sturrock, 1989). In comparison, other cell types were sparser and dimmer: 7% of molecular layer interneurons (MLIs) were visible at an average of 0.4 times the brightness of PC dendrites, and 1% of granule cells (GCs) were visible at 0.06 times the brightness of PC dendrites. Thus, under our expression conditions, nearly all of the GCaMP6f signal in the ML neuropil arose from PC dendrites, even before regions of interest (ROIs) were identified.
Calcium spikes in individual PC dendrites were apparent as a rapidly rising transient increase in the fluorescence signal (Figures 1C and 1D, bottom). We have shown previously that these dendritic calcium spikes are generated when the CF input fires and generates a CS in the PC (Ozden et al., 2008). Our imaging tools and template-and-threshold algorithm can detect approximately 95% of all CSs with a <8% false-positive rate (Ozden et al., 2008). In PC dendrites, calcium spikes occurred at the expected spontaneous rate of once per second (Figures 1C and 1D, blue dots; rate = 0.90 ± 0.25 Hz, mean ± SD), and also in response to periocular airpuff stimulation (Figures 1C and 1D, red dots; response probability = 0.58 ± 0.24, mean ± SD). We termed these events spontaneous and evoked calcium spikes, respectively.
Sensory-Driven Enhancement of Calcium Spikes in a Representative Dendrite
Figure 2 shows data for an example PC dendrite in a GCaMP6f experiment. The average evoked calcium spike (Figure 2A, red; 27 spikes) was larger in amplitude than the average spontaneous calcium spike (Figure 2A, blue; 65 spikes; difference between evoked and spontaneous spikes shown in black). Note that all fluorescence traces have been normalized so that the peak of the average signal for spontaneous calcium spikes in the PC is “1” (see Experimental Procedures). As an index of the size of the calcium spike, we computed the integral of each normalized fluorescence signal in the 100 ms window following its peak (Figure 2A; “integral”). We will refer to this quantity as the ΔF/F-integral. In the example shown, the ΔF/F-integral of the calcium spike was on average 50% larger for evoked versus spontaneous events (Figure 2B; red versus blue, Kolmogorov-Smirnov test, p < 0.001).
Figure 2. Sensory-Driven Enhancement of Calcium Spikes in a Representative Dendrite.
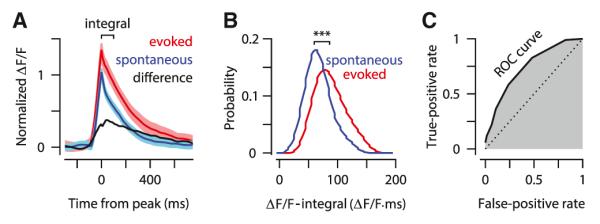
(A) Average of spontaneous (blue) and sensory-evoked (red) calcium spikes (± SEM). The difference trace (black) is the difference between evoked and spontaneous traces. All traces are normalized to the peak of the spontaneous trace.
(B) Histograms of the size of spontaneous (blue) and evoked (red) calcium spikes computed by taking the ΔF/F integral in the window shown in (A) (“integral”). Bin width = 20 ΔF/F × ms.
(C) ROC curve (black solid line) and the corresponding area under the curve (shaded gray) computed from the histograms shown in (B). The dotted diagonal is the ROC curve if the two histograms were completely overlapping.
Next, we used receiver operating characteristic (ROC) analysis to quantify the degree to which the ΔF/F-integral of the calcium spike was sufficient to distinguish sensory-evoked signals from spontaneous ones (see Experimental Procedures). We constructed an ROC curve (Figure 2C) by sliding the value of a discriminability criterion along the horizontal axis of Figure 2B. For each value of the criterion, we plotted a point in the ROC curve with coordinates FPR and TPR, where FPR is the false-positive rate (i.e., the fraction of calcium spikes in the spontaneous distribution whose ΔF/F-integral is bigger than the criterion), and TPR is the true-positive rate (i.e., the fraction of calcium spikes in the evoked distribution whose ΔF/F-integral is bigger than the criterion). The area under the ROC curve provides a standard measure of % correct in a two-alternative discrimination task (Green and Swets, 1966). In the example dendrite, the area under the ROC curve was 76% (Figure 2C, gray shaded area), indicating that for each randomly drawn pair of calcium spikes (one from the evoked distribution and one from the spontaneous distribution; Figure 2B), the spike with the larger ΔF/F-integral would be sensory evoked in 76% of cases. In comparison, identical spontaneous and evoked distributions would give an ROC area of 50% (Figure 2C, dotted diagonal).
Population Analysis
Evoked calcium spikes were bigger than spontaneous calcium spikes in nearly all of the PC dendrites we examined, both in experiments using OGB-1/AM (Figures 3A–3C; n = 33/35 dendrites) and in experiments using GCaMP6f (Figures 3D–3F; n = 40/41 dendrites). This enhancement was apparent in the population difference trace (Figures 3A and 3D), which was obtained by averaging the difference between evoked and spontaneous traces across all dendrites. Note that the fluorescence signal of each individual dendrite was first normalized separately as before, and as a result, the difference traces shown in Figures 3A and 3D are relative to the average size of spontaneous calcium spikes. The ΔF/F-integral for evoked spikes was on average 32% ± 20% larger than that for spontaneous spikes in OGB-1/AM experiments (Figure 3B, red circle; mean ± SD), and 41% ± 24% larger in GCaMP6f experiments (Figure 3E, red circle; mean ± SD). This sensory-driven enhancement was statistically significant (two-sample Kolmogorov-Smirnov test, p < 0.05) for 69% of OGB-1/AM-labeled dendrites and 73% of GCaMP6f-expressing dendrites (Figures 3B and 3E; black circles). ROC analysis (Figures 3C and 3F) showed that sensory-evoked and spontaneous calcium spikes could be discriminated above chance level in most dendrites (median % correct is 81% in Figure 3C and 73% in Figure 3F). The small mismatch between the two calcium indicators is consistent with the known nonlinearity of GCaMP6f (Chen et al., 2013), which would tend to differentially amplify calcium spikes depending on the baseline level and cause greater variability in ΔF/F values.
Figure 3. Sensory-Driven Enhancement of Calcium Spikes.
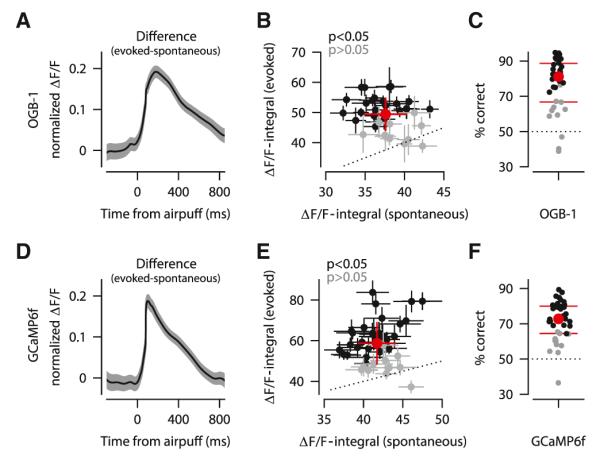
(A–C) OGB-1/AM experiments.
(D–F) GCaMP6f experiments.
(A and D) Difference between evoked and spontaneous CF-triggered fluorescence signals averaged across all dendrites (± SEM). All traces are normalized to the peak of the spontaneous trace of each dendrite separately.
(B and E) Average size of evoked and spontaneous calcium spikes in dendrites with a significant sensory-driven enhancement (black: mean ± SEM), and without (gray: mean ± SEM). Average ± SD of all dendrites is shown in red.
(C and F) ROC analysis showing % correct discrimination of sensory-evoked and spontaneous calcium spikes, for individual dendrites (black and gray as in B and E), and averaged across population (red: circle is median and lines are interquartile range). Dotted line indicates the chance discrimination level.
Sensory-Driven Calcium Signals in Trials without CF-Triggered Calcium Spikes
In addition to the CF input, PC dendrites receive input from GCs and MLIs (Ito, 1984), both of which are capable of modulating the amplitude of the CF-triggered calcium spike (Callaway et al., 1995; Kitamura and Häusser, 2011; Wang et al., 2000). To assess the role of non-CF inputs, we examined the same population of dendrites as shown in Figure 3, but this time we analyzed the fluorescence signal in trials without a detectable sensory-driven calcium spike. The average fluorescence signal in these trials revealed a small but clear rise of dendritic calcium in response to the periocular airpuff stimulus, for both OGB-1/AM (Figure 4A, left, green trace) and GCaMP6f (Figure 4A, right, green trace) experiments. For direct comparison with traces in previous figures, we normalized the fluorescence signals in Figure 4A exactly as before (i.e., “1” represents the average peak of the spontaneously evoked calcium spikes, computed for each dendrite separately). These signals were not detected as calcium spikes by our template-matching-and-threshold algorithm because they were much smaller (Figures 4A and S1) and much slower (rise time: 154 ± 48 versus 10 ± 3 ms for calcium spikes; mean ± SD, two-sample Kolmogorov-Smirnov test, p < 0.0001).
Figure 4. Sensory Stimulation Triggers Non-CF Calcium Signals in PC Dendrites.
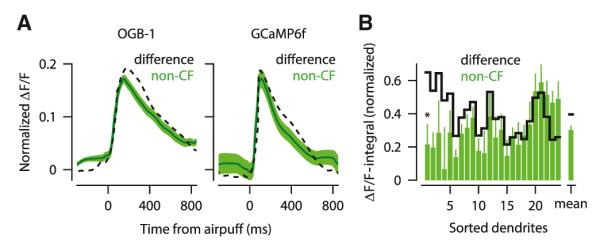
(A) Average fluorescence signal (± SEM) in response to sensory stimulation when there was no CF-triggered calcium spike (green, non-CF). Difference traces in Figures 3A and 3D are superimposed (dashed). Left: OGB-1/AM; right: GCaMP6f experiments. All traces are normalized to the peak of the spontaneous trace of each dendrite separately.
(B) Average size of non-CF (green; error bars, SEM) and difference (black) calcium signals shown for each dendrite separately after normalizing to the average size of its spontaneous spike. Dendrites are sorted by the difference of the two signals. “Mean” indicates the average across all dendrites. Asterisk indicates significantly different non-CF and difference signals.
See also Figure S2.
We refer to the fluorescence signal in Figure 4A as the non-CF calcium signal because it was measured in trials without a detectable calcium spike. We have previously shown that our algorithm for identifying calcium spikes detects nearly all CSs correctly (Experimental Procedures; Ozden et al., 2008), which means that the lack of a detectable calcium spike in any given trial can be taken as a reliable indicator that the periocular airpuff failed to activate the CF input. In PCs that were responsive to periocular airpuffs, approximately 40% of all trials did not show a sensory-driven calcium spike, consistent with the low probability of a CF response to peripheral stimulation reported in previous studies (Eccles et al., 1972; Gilbert and Thach, 1977; Kitazawa et al., 1998; Medina and Lisberger, 2008; Ozden et al., 2012; Soetedjo et al., 2008). Nonetheless, spike detection is not perfect and some CF events were probably missed. To reduce the number of missed CF events, we lowered the threshold for detecting calcium spikes by as much as 50% (Figure S2). Under this condition, we still observed a sensory-driven non-CF signal (Figure S2C), which indicates that the non-CF signal is unlikely to arise from small CF-triggered calcium spikes that our algorithm might have failed to detect.
A potential source of the non-CF calcium signal in a PC dendrite is neighboring CF inputs to nearby PCs, which could contribute either by providing a source of diffuse fluorescence signal or by spillover-mediated effects (Coddington et al., 2013; Mathews et al., 2012). To test for these potential contributions, we examined the non-CF signals of individual PC dendrites in trials in which the periocular airpuff failed to evoke calcium spikes in the two nearest dendrites. Relative to the size of spontaneous calcium spikes, the average ΔF/F-integral of the non-CF signal was 28% ± 17% in trials with calcium spikes in adjacent dendrites, and 27% ± 22% in trials without such spikes (mean ± SD; two-sample Kolmogorov-Smirnov test, p = 0.7). Thus, our results demonstrate that sensory events are capable of triggering a measurable rise of calcium in the PC dendrite in the absence of any CF activation in the immediately adjacent neuropil, suggesting that spillover effects do not make a major contribution. However, a contribution from more distant CFs cannot be entirely ruled out (Coddington et al., 2013).
The average non-CF signal (Figure 4A, green) was similar in magnitude and time course to the difference signal shown in Figures 3A and 3D (replotted for comparison in Figure 4A, dashed lines). This suggests that the non-CF signal and the sensory-driven enhancement of the calcium spike might share a common origin. We evaluated this possibility further in a subset of dendrites with significant enhancement and enough trials with and without sensory-driven calcium spikes (13 dendrites for OGB-1/AM and 11 for GCaMP6f experiments). In many of these dendrites, the average ΔF/F-integral of the non-CF signal (Figure 4B, green; error bars, SEM) was comparable to the average ΔF/F-integral of the difference signal (Figure 4B, black). Indeed, the two signals were significantly different from each other in only one of the 24 dendrites (Figure 4B, asterisk). On average, we found that the non-CF signal could account for 76% of the total sensory-driven enhancement of the calcium spike (Figure 4B), consistent with the hypothesis that the majority of enhancement in CF trials arose from non-CF sources.
DISCUSSION
We have demonstrated that calcium spikes in individual PC dendrites are significantly larger when the CF input fires in response to an instructive stimulus than when it fires spontaneously. As revealed by our ROC analysis, this sensory-driven enhancement of the calcium spike could potentially be used to tag the occurrence of unexpected sensory events, thus allowing an individual PC to distinguish instructive signals from ongoing background activity.
The mechanisms underlying the sensory-driven enhancement of the dendritic calcium spike are currently unknown. One possibility is that sensory stimuli, like periocular airpuffs, drive this enhancement by directly amplifying signals along the CF pathway itself. For example, recent work has shown that certain types of vestibular/visual stimulation can increase the number of action potentials within a single (~10 ms) CF burst (Maruta et al., 2007), which is known to enhance the PC dendritic depolarization, result in more calcium entry and determine the direction of cerebellar learning (Mathy et al., 2009; Rasmussen et al., 2013). Similarly, delivery of an unexpected periocular airpuff may recruit arousal centers such as the locus coeruleus, which could potentiate CF signals by releasing noradrenaline in the cerebellar cortex (Moises et al., 1981). However, in cerebellar slices, the direct application of noradrenaline decreases the probability of release at the CF synapse and reduces the amplitude of CF-triggered calcium spikes (Carey and Regehr, 2009).
Our findings suggest an additional mechanism for enhancing dendritic calcium signals that is based on sensory-driven activation of a non-CF input, possibly via the mossy fiber (MF) pathway to the cerebellar cortex. This hypothesis is consistent with previous work showing that the amplitude of the CF-triggered calcium spike depends on the membrane potential of the PC dendrite (Kitamura and Häusser, 2011), and can be regulated by two types of MF-driven inputs to the PC: inhibitory inputs from MLIs (Callaway et al., 1995) and excitatory inputs from the parallel fibers (PFs) of GCs (Wang et al., 2000). Additional evidence supporting a contribution of the MF pathway comes from extracellular recording studies that demonstrated that cutaneous stimulation of the limb can activate PF, MLI, and CF inputs converging on the same PC (Apps and Garwicz, 2005; Eccles et al., 1972; Ekerot and Jörntell, 2003).
It is of note that in previous electrophysiological studies, MF and CF convergence usually resulted in sensory-driven suppression of somatic PC spiking at the time of the CF input (Eccles et al., 1972; Ekerot and Jörntell, 2003), whereas we only found reliable enhancement of CF-triggered dendritic calcium spikes. Our unexpected finding may reflect inherent differences in how synaptic inputs are processed to independently generate electrical signals in the PC soma and calcium signals in the dendrites (Davie et al., 2008; Denk et al., 1995; Llinás and Sugimori, 1980; Wang et al., 2000), and could be explained if spiking were influenced by factors that occur downstream of dendritic integration, such as somatic inhibition. Another difference is that we used periocular airpuff stimuli, which are rare and unexpected sensory events, whereas previous studies used cutaneous stimulation of hindlimb or toes, which is frequently experienced during self-generated movements and presumably results in depressed PF synapses and potentiated MLI inputs (Ekerot and Jörntell, 2003). Indeed, CFs appear to be particularly sensitive to this type of contextual modulation because they respond much more reliably to peripheral stimulation when it is unexpected than when it can be anticipated (Apps, 1999; Ozden et al., 2012).
Our findings have important implications for theories of cerebellar learning. In the prevailing view, instructive signals are encoded at the level of an individual PC as all-or-nothing calcium spikes that are triggered once for every CF firing event, whether spontaneous or in response to an unexpected sensory event (Houk et al., 1996; Kitamura and Häusser, 2011; Najafi and Medina, 2013). Our results challenge this view in two ways. First, we have shown that the amplitudes of sensory-driven and spontaneous calcium spikes are significantly different from each other. Second, we found that sensory stimulation causes a small rise of dendritic calcium in the PC dendrite even when its CF input does not fire, consistent with the idea that instructive signals may be relayed to the cerebellar cortex via multiple pathways, including both the MF and CF pathways (Raymond et al., 1996).
In the cerebellum, short- and long-term synaptic modifications of PC inputs are tightly regulated by the precise amplitude and duration of the dendritic calcium signal (Gao et al., 2012). For example, PF-PC plasticity is steeply dependent on calcium concentration (Tanaka et al., 2007), and small variations in dendritic calcium are sufficient to differentially drive either long-term potentiation or long-term depression (Coesmans et al., 2004). Our observations reflect both differences in PC dendritic depolarization and in the ensuing amount of calcium entry in response to single sensory events in contrast to spontaneous conditions. Thus, the type of sensory-driven enhancement of the calcium spike reported here may help modulate the efficacy of the CF input to serve as an instructive signal and drive plasticity and learning.
EXPERIMENTAL PROCEDURES
Animal Preparation
The experimental procedures were approved by the Princeton University Institutional Animal Care and Use Committee and performed in accordance with the animal welfare guidelines of the National Institutes of Health. C57BL/6J mice 8–14 weeks old were anesthetized with isoflurane and a small craniotomy was made over the cerebellum. A coverslip with a premolded Kwik-Sil plug was placed on the exposed brain and held in place by a two-piece headplate. On the following day, the animals were anesthetized with isoflurane and a calcium indicator or viral construct was injected into the cerebellar cortex (two to three injections, ~300 nl, 150–200 μg below the dura surface). The injections contained either the calcium indicator Oregon Green BAPTA-1/AM (OGB-1/AM) or a combination of AAV2/1.CMV.PI.Cre.rBG and AAV2/1.CAG. Flex.GCaMP6f.WPRE.SV40 (Penn Vector Core, University of Pennsylvania). Hyperosmotic d-mannitol (15% in PBS) was given i.p. ~15 min before virus injection to reduce toxicity associated with AAV injections and GCaMP6f overexpression.
Two-Photon Imaging
Imaging was performed immediately after the animals recovered from anesthesia for OGB-1/AM injections, or after 7–10 days for AAV injections. Mice were head-fixed on top of a cylindrical treadmill while airpuff stimuli (30 ms, 20–50 psi) were delivered through a blunted hypodermic needle pointed at the ipsilateral eye (~4 s intertrial interval, ~35 trials/experiment). Fluorescence signals were acquired with a custom-built two-photon microscope that collected data as movies of 32 × 128 pixels (64 ms/frame). Dendritic calcium spikes were detected with a three-step process as described previously (Ozden et al., 2012): (1) Pixels corresponding to individual dendrites were determined with an algorithm that uses the independent spatial components estimated by PCA/ICA. (2) The fluorescence trace (ΔF/F) of a PC dendrite was computed as (F − Fb)/Fb, where F is the mean fluorescence intensity of the pixels contributing to a dendrite in each frame, and Fb is the baseline defined as the lowest 8th percentile of all fluorescence values within a 1 s window surrounding each frame. (3) Calcium spikes were detected by examining the fluorescence trace for each dendrite frame by frame, using a template-matching algorithm and setting a threshold. Essentially, this algorithm identifies transient increases in fluorescence with the characteristic temporal profile of CF-triggered calcium spikes and a peak amplitude larger than a threshold value.
GCaMP6f Cell Specificity
In order to quantify the cellular origin of the signal recorded in the ML, we estimated the expression density of PCs, MLIs, and GCs. In vivo, within GCaMP6f-expressing zones, we counted visible structures up to the maximum optical penetration depth of 260 μm and compared them with published total density values (Sturrock, 1989). We found 13.6 ± 0.8 stained PCs per 104 μm2 (76% of all estimated PCs; mean ± SEM, n = 3), 6.0 ± 1.3 dimly stained MLIs per 106 μm3 (7% of all estimated MLIs; mean ± SEM, n = 5), and no GCs with brightness > 2.5% of the average PC brightness (n = 5). MLI and GC visibility in vivo is dependent on the animal’s behavioral state (Ozden et al., 2012); therefore, we repeated our measurements in fixed brain slices (n = 3), which are optically more uniform and in which calcium concentrations are expected to be uniformly high. We found that 75% of PCs were visible, 7% of MLIs were visible at 40% the brightness of PCs, and 1.1% of GCs were visible at 6% the brightness of PCs. In summary, the relative fraction of PC:MLI:GC expression was 1:0.09:0.01 with a relative brightness of 1:0.4:0.01, indicating that more than 95% of the signal in the ML arises from PC dendrites. In the selected ROIs, which include PC dendrites only, we expect a much higher value.
Analysis of Calcium Signals
All ΔF/F traces, except for those shown in Figures 1C and 1D, were normalized for each dendrite separately such that the peak value of the average spontaneous calcium spike was one. To limit the analysis to single CF inputs, we removed segments of the fluorescence trace containing more than one calcium spike separated from each other by <100 ms (doublets or multiples). Trials with a single calcium spike in a 50–150 ms interval after the periocular airpuff were used for the analysis of evoked calcium spikes. Trials without any calcium spikes in this interval were used for the analysis of the non-CF signal. The size of each individual calcium spike was computed by taking the integral of the normalized ΔF/F signal in a 100 ms window starting at the peak (ΔF/F-integral). The size of the non-CF signal was measured similarly, by taking the integral of the normalized ΔF/F signal in a 100 ms window starting at a point selected randomly within 50–150 ms of the periocular airpuff. See also Figure S1.
ROC Analysis
The TPR and FPR were computed under the assumption that the amplitude of evoked calcium spikes is larger than the amplitude of spontaneous spikes. TPR was calculated as the fraction of evoked spikes that would have been correctly identified because their amplitude was bigger than the criterion, and FPR was calculated as the fraction of spontaneous spikes that would have been incorrectly identified because their amplitude was bigger than the criterion.
Supplementary Material
ACKNOWLEDGMENTS
We thank A. Kloth for help with eyelid acquisition software, I. Ozden and D. Dombeck for help with imaging in awake mice, and K. Ohmae for help with the graphical abstract. This work was supported by grants to J.M. (Searle Scholars Program, NIH R01 MH093727), A.G. (New Jersey Commission on Brain Injury Research CBIR12FE1031), and S.W. (NIH R01 NS045193, W.M. Keck Distinguished Young Investigator, and NIH RC1 NS068414).
Footnotes
SUPPLEMENTAL INFORMATION Supplemental Information includes two figures and can be found with this article online at http://dx.doi.org/10.1016/j.celrep.2014.02.001.
AUTHOR CONTRIBUTIONS F.N. and A.G. developed analysis tools, established the behavioral and imaging setup, and performed the experiments in the laboratory of S.W. F.N., A.G., and J.M. analyzed the data and prepared the figures. F.N. and J.M. wrote the first draft of the manuscript. F.N., A.G., S.W., and J.M. designed experiments, developed analyses, and edited the manuscript.
REFERENCES
- Apps R. Movement-related gating of climbing fibre input to cerebellar cortical zones. Prog. Neurobiol. 1999;57:537–562. doi: 10.1016/s0301-0082(98)00068-9. [DOI] [PubMed] [Google Scholar]
- Apps R, Garwicz M. Anatomical and physiological foundations of cerebellar information processing. Nat. Rev. Neurosci. 2005;6:297–311. doi: 10.1038/nrn1646. [DOI] [PubMed] [Google Scholar]
- Callaway JC, Lasser-Ross N, Ross WN. IPSPs strongly inhibit climbing fiber-activated [Ca2+]i increases in the dendrites of cerebellar Purkinje neurons. J. Neurosci. 1995;15:2777–2787. doi: 10.1523/JNEUROSCI.15-04-02777.1995. [DOI] [PMC free article] [PubMed] [Google Scholar]
- Carey MR, Regehr WG. Noradrenergic control of associative synaptic plasticity by selective modulation of instructive signals. Neuron. 2009;62:112–122. doi: 10.1016/j.neuron.2009.02.022. [DOI] [PMC free article] [PubMed] [Google Scholar]
- Chen TW, Wardill TJ, Sun Y, Pulver SR, Renninger SL, Baohan A, Schreiter ER, Kerr RA, Orger MB, Jayaraman V, et al. Ultrasensitive fluorescent proteins for imaging neuronal activity. Nature. 2013;499:295–300. doi: 10.1038/nature12354. [DOI] [PMC free article] [PubMed] [Google Scholar]
- Coddington LT, Rudolph S, Vande Lune P, Overstreet-Wadiche L, Wadiche JI. Spillover-mediated feedforward inhibition functionally segregates interneuron activity. Neuron. 2013;78:1050–1062. doi: 10.1016/j.neuron.2013.04.019. [DOI] [PMC free article] [PubMed] [Google Scholar]
- Coesmans M, Weber JT, De Zeeuw CI, Hansel C. Bidirectional parallel fiber plasticity in the cerebellum under climbing fiber control. Neuron. 2004;44:691–700. doi: 10.1016/j.neuron.2004.10.031. [DOI] [PubMed] [Google Scholar]
- Crill WE. Unitary multiple-spiked responses in cat inferior olive nucleus. J. Neurophysiol. 1970;33:199–209. doi: 10.1152/jn.1970.33.2.199. [DOI] [PubMed] [Google Scholar]
- Davie JT, Clark BA, Häusser M. The origin of the complex spike in cerebellar Purkinje cells. J. Neurosci. 2008;28:7599–7609. doi: 10.1523/JNEUROSCI.0559-08.2008. [DOI] [PMC free article] [PubMed] [Google Scholar]
- De Zeeuw CI, Simpson JI, Hoogenraad CC, Galjart N, Koekkoek SK, Ruigrok TJ. Microcircuitry and function of the inferior olive. Trends Neurosci. 1998;21:391–400. doi: 10.1016/s0166-2236(98)01310-1. [DOI] [PubMed] [Google Scholar]
- Denk W, Sugimori M, Llinás R. Two types of calcium response limited to single spines in cerebellar Purkinje cells. Proc. Natl. Acad. Sci. USA. 1995;92:8279–8282. doi: 10.1073/pnas.92.18.8279. [DOI] [PMC free article] [PubMed] [Google Scholar]
- Eccles JC, Llinás R, Sasaki K. The excitatory synaptic action of climbing fibres on the Purkinje cells of the cerebellum. J. Physiol. 1966;182:268–296. doi: 10.1113/jphysiol.1966.sp007824. [DOI] [PMC free article] [PubMed] [Google Scholar]
- Eccles JC, Sabah NH, Schmidt RF, Táboríková H. Integration by Purkynĕ cells of mossy and climbing fiber inputs from cutaneous mechanoreceptors. Exp. Brain Res. 1972;15:498–520. doi: 10.1007/BF00236405. [DOI] [PubMed] [Google Scholar]
- Ekerot CF, Jörntell H. Parallel fiber receptive fields: a key to understanding cerebellar operation and learning. Cerebellum. 2003;2:101–109. doi: 10.1080/14734220309411. [DOI] [PubMed] [Google Scholar]
- Gao Z, van Beugen BJ, De Zeeuw CI. Distributed synergistic plasticity and cerebellar learning. Nat. Rev. Neurosci. 2012;13:619–635. doi: 10.1038/nrn3312. [DOI] [PubMed] [Google Scholar]
- Gibson AR, Horn KM, Pong M. Activation of climbing fibers. Cerebellum. 2004;3:212–221. doi: 10.1080/14734220410018995. [DOI] [PubMed] [Google Scholar]
- Gilbert P. How the cerebellum could memorise movements. Nature. 1975;254:688–689. doi: 10.1038/254688a0. [DOI] [PubMed] [Google Scholar]
- Gilbert PF, Thach WT. Purkinje cell activity during motor learning. Brain Res. 1977;128:309–328. doi: 10.1016/0006-8993(77)90997-0. [DOI] [PubMed] [Google Scholar]
- Green DM, Swets JA. Signal Detection Theory and Psychophysics. Wiley & Sons, Inc.; New York: 1966. [Google Scholar]
- Houk JC, Buckingham JT, Barto AG. Models of the cerebellum and motor learning. Behav. Brain Sci. 1996;19:368–383. [Google Scholar]
- Ito M. The Cerebellum and Neural Control. Raven Press; New York: 1984. [Google Scholar]
- Ito M. Error detection and representation in the olivo-cerebellar system. Front. Neural Circuits. 2013;7:1. doi: 10.3389/fncir.2013.00001. [DOI] [PMC free article] [PubMed] [Google Scholar]
- Kitamura K, Häusser M. Dendritic calcium signaling triggered by spontaneous and sensory-evoked climbing fiber input to cerebellar Purkinje cells in vivo. J. Neurosci. 2011;31:10847–10858. doi: 10.1523/JNEUROSCI.2525-10.2011. [DOI] [PMC free article] [PubMed] [Google Scholar]
- Kitamura K, Kano M. Dendritic calcium signaling in cerebellar Purkinje cell. Neural Netw. 2013;47:11–17. doi: 10.1016/j.neunet.2012.08.001. [DOI] [PubMed] [Google Scholar]
- Kitazawa S, Kimura T, Yin PB. Cerebellar complex spikes encode both destinations and errors in arm movements. Nature. 1998;392:494–497. doi: 10.1038/33141. [DOI] [PubMed] [Google Scholar]
- Llinás R, Sugimori M. Electrophysiological properties of in vitro Purkinje cell dendrites in mammalian cerebellar slices. J. Physiol. 1980;305:197–213. doi: 10.1113/jphysiol.1980.sp013358. [DOI] [PMC free article] [PubMed] [Google Scholar]
- Maruta J, Hensbroek RA, Simpson JI. Intraburst and interburst signaling by climbing fibers. J. Neurosci. 2007;27:11263–11270. doi: 10.1523/JNEUROSCI.2559-07.2007. [DOI] [PMC free article] [PubMed] [Google Scholar]
- Mathews PJ, Lee KH, Peng Z, Houser CR, Otis TS. Effects of climbing fiber driven inhibition on Purkinje neuron spiking. J. Neurosci. 2012;32:17988–17997. doi: 10.1523/JNEUROSCI.3916-12.2012. [DOI] [PMC free article] [PubMed] [Google Scholar]
- Mathy A, Ho SS, Davie JT, Duguid IC, Clark BA, Häusser M. Encoding of oscillations by axonal bursts in inferior olive neurons. Neuron. 2009;62:388–399. doi: 10.1016/j.neuron.2009.03.023. [DOI] [PMC free article] [PubMed] [Google Scholar]
- Mauk MD, Donegan NH. A model of Pavlovian eyelid conditioning based on the synaptic organization of the cerebellum. Learn. Mem. 1997;4:130–158. doi: 10.1101/lm.4.1.130. [DOI] [PubMed] [Google Scholar]
- Medina JF, Lisberger SG. Links from complex spikes to local plasticity and motor learning in the cerebellum of awake-behaving monkeys. Nat. Neurosci. 2008;11:1185–1192. doi: 10.1038/nn.2197. [DOI] [PMC free article] [PubMed] [Google Scholar]
- Moises HC, Waterhouse BD, Woodward DJ. Locus coeruleus stimulation potentiates Purkinje cell responses to afferent input: the climbing fiber system. Brain Res. 1981;222:43–64. doi: 10.1016/0006-8993(81)90939-2. [DOI] [PubMed] [Google Scholar]
- Najafi F, Medina JF. Beyond “all-or-nothing” climbing fibers: graded representation of teaching signals in Purkinje cells. Front. Neural Circuits. 2013;7:115. doi: 10.3389/fncir.2013.00115. [DOI] [PMC free article] [PubMed] [Google Scholar]
- Ozden I, Lee HM, Sullivan MR, Wang SS-H. Identification and clustering of event patterns from in vivo multiphoton optical recordings of neuronal ensembles. J. Neurophysiol. 2008;100:495–503. doi: 10.1152/jn.01310.2007. [DOI] [PMC free article] [PubMed] [Google Scholar]
- Ozden I, Sullivan MR, Lee HM, Wang SS-H. Reliable coding emerges from coactivation of climbing fibers in microbands of cerebellar Purkinje neurons. J. Neurosci. 2009;29:10463–10473. doi: 10.1523/JNEUROSCI.0967-09.2009. [DOI] [PMC free article] [PubMed] [Google Scholar]
- Ozden I, Dombeck DA, Hoogland TM, Tank DW, Wang SS-H. Widespread state-dependent shifts in cerebellar activity in locomoting mice. PLoS ONE. 2012;7:e42650. doi: 10.1371/journal.pone.0042650. [DOI] [PMC free article] [PubMed] [Google Scholar]
- Rasmussen A, Jirenhed DA, Hesslow G. Simple and complex spike firing patterns in Purkinje cells during classical conditioning. Cerebellum. 2008;7:563–566. doi: 10.1007/s12311-008-0068-2. [DOI] [PubMed] [Google Scholar]
- Rasmussen A, Jirenhed DA, Zucca R, Johansson F, Svensson P, Hesslow G. Number of spikes in climbing fibers determines the direction of cerebellar learning. J. Neurosci. 2013;33:13436–13440. doi: 10.1523/JNEUROSCI.1527-13.2013. [DOI] [PMC free article] [PubMed] [Google Scholar]
- Raymond JL, Lisberger SG. Neural learning rules for the vestibulo-ocular reflex. J. Neurosci. 1998;18:9112–9129. doi: 10.1523/JNEUROSCI.18-21-09112.1998. [DOI] [PMC free article] [PubMed] [Google Scholar]
- Raymond JL, Lisberger SG, Mauk MD. The cerebellum: a neuronal learning machine? Science. 1996;272:1126–1131. doi: 10.1126/science.272.5265.1126. [DOI] [PubMed] [Google Scholar]
- Schmolesky MT, Weber JT, De Zeeuw CI, Hansel C. The making of a complex spike: ionic composition and plasticity. Ann. N Y Acad. Sci. 2002;978:359–390. doi: 10.1111/j.1749-6632.2002.tb07581.x. [DOI] [PubMed] [Google Scholar]
- Schultz SR, Kitamura K, Post-Uiterweer A, Krupic J, Häusser M. Spatial pattern coding of sensory information by climbing fiber-evoked calcium signals in networks of neighboring cerebellar Purkinje cells. J. Neurosci. 2009;29:8005–8015. doi: 10.1523/JNEUROSCI.4919-08.2009. [DOI] [PMC free article] [PubMed] [Google Scholar]
- Simpson JI, Wylie DR, De Zeeuw CI. On climbing fiber signals and their consequence(s) Behav. Brain Sci. 1996;19:384–398. [Google Scholar]
- Sjöström PJ, Nelson SB. Spike timing, calcium signals and synaptic plasticity. Curr. Opin. Neurobiol. 2002;12:305–314. doi: 10.1016/s0959-4388(02)00325-2. [DOI] [PubMed] [Google Scholar]
- Soetedjo R, Kojima Y, Fuchs AF. Complex spike activity in the oculomotor vermis of the cerebellum: a vectorial error signal for saccade motor learning? J. Neurophysiol. 2008;100:1949–1966. doi: 10.1152/jn.90526.2008. [DOI] [PMC free article] [PubMed] [Google Scholar]
- Sturrock RR. Changes in neuron number in the cerebellar cortex of the ageing mouse. J. Hirnforsch. 1989;30:499–503. [PubMed] [Google Scholar]
- Sullivan MR, Nimmerjahn A, Sarkisov DV, Helmchen F, Wang SS-H. In vivo calcium imaging of circuit activity in cerebellar cortex. J. Neurophysiol. 2005;94:1636–1644. doi: 10.1152/jn.01013.2004. [DOI] [PubMed] [Google Scholar]
- Tanaka K, Khiroug L, Santamaria F, Doi T, Ogasawara H, Ellis-Davies GC, Kawato M, Augustine GJ. Ca2+ requirements for cerebellar long-term synaptic depression: role for a postsynaptic leaky integrator. Neuron. 2007;54:787–800. doi: 10.1016/j.neuron.2007.05.014. [DOI] [PubMed] [Google Scholar]
- Thach WT, Goodkin HP, Keating JG. The cerebellum and the adaptive coordination of movement. Annu. Rev. Neurosci. 1992;15:403–442. doi: 10.1146/annurev.ne.15.030192.002155. [DOI] [PubMed] [Google Scholar]
- Wang SS-H, Denk W, Häusser M. Coincidence detection in single dendritic spines mediated by calcium release. Nat. Neurosci. 2000;3:1266–1273. doi: 10.1038/81792. [DOI] [PubMed] [Google Scholar]
- Zucker RS. Calcium- and activity-dependent synaptic plasticity. Curr. Opin. Neurobiol. 1999;9:305–313. doi: 10.1016/s0959-4388(99)80045-2. [DOI] [PubMed] [Google Scholar]
Associated Data
This section collects any data citations, data availability statements, or supplementary materials included in this article.