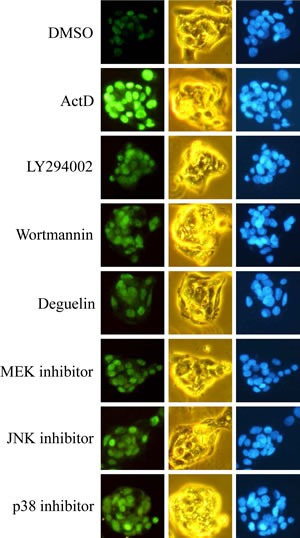
Figure 5. Effects of kinase inhibitors on p53 expression as revealed by immunofluorescence imaging.

HepG2 cells were seeded on microscope cover glasses in 6-well plates overnight before drug treatment. Cells were treated individually with ActD (10 nM), LY294002 (10 μM), wortmannin (10 μM), deguelin (0.2 μM), PD98059 (10 μM), SP600125 (50 μM), and SB203580 (25 μM) for 6 h in HepG2 cells.
